
Abstract
Objective
To estimate the potential budget impact on US third party payers (commercial or Medicare) associated with addition of selpercatinib as a tumor-agnostic treatment for patients with Rearranged during Transfection (RET)-altered solid tumors.
Methods
An integrated budget impact model (iBIM) with 3-year (Y) time horizon was developed for 19 RET-altered tumors. It is referred to as an integrated model because it is a single model that integrated results across multiple tumor types (as opposed to tumor-specific models developed traditionally). The model estimated eligible patient populations and included tumor-specific comparator treatments for each tumor type. Estimated annual total costs (2022USD, $) included costs of drug, administration, supportive care, and toxicity. For a one-million-member plan, the number of patients with RET-altered tumors eligible for treatment, incremental total costs, and incremental per-member per-month (PMPM) costs associated with introduction of selpercatinib treatment were estimated. Uncertainty associated with model parameters was assessed using various sensitivity analyses.
Results
Commercial perspective estimated 11.68 patients/million with RET-altered tumors as treatment-eligible annually, of which 7.59 (Y1), 8.17 (Y2), and 8.76 (Y3) patients would be selpercatinib-treated (based on forecasted market share). The associated incremental total and PMPM costs (commercial) were estimated to be: $873,099 and $0.073 (Y1), $2,160,525 and $0.180 (Y2), and $2,561,281 and $0.213 (Y3), respectively. The Medicare perspective estimated 55.82 patients/million with RET-altered tumors as treatment-eligible annually, of which 36.29 (Y1), 39.08 (Y2), and 41.87 (Y3) patients would be selpercatinib-treated. The associated incremental total and PMPM costs (Medicare) were estimated to be: $4,447,832 and $0.371 (Y1), $11,076,422 and $0.923 (Y2), and $12,637,458 and $1.053 (Y3), respectively. One-way sensitivity analyses across both perspectives identified drug costs, selpercatinib market share, incidence of RET, and treatment duration as significant drivers of incremental costs.
Conclusions
Three-year incremental PMPM cost estimates suggest a modest impact on payer-budgets associated with introduction of tumor-agnostic selpercatinib treatment.
Introduction
Budget impact analyses (BIA) are used to estimate the affordability of new healthcare interventions versus existing standard of care (SoC). BIAs are primarily conducted from payers’ perspective and include cost measures relevant to them, and are used by the payers to inform their formulary and reimbursement related decision-makingCitation1–3. Over the years, cancer treatment has shifted from a histology-based approach to a tumor-agnostic approach, which involves identifying molecular biomarkers and targeting oncogenic drivers, irrespective of the tumor type. This approach is evaluated in basket trialsCitation4–6, making it important to understand the monetary impact of treatments on multiple tumor types simultaneously. As more trials evaluating tumor-agnostic treatments are anticipatedCitation7, traditional approaches to developing important payer resources (like BIA)Citation4–6 may have to be revisited to ensure that the methodology is aligned and able to accommodate the tumor-agnostic focused drug development. This will help estimate economic outcomes from a tumor-agnostic perspective for stakeholder considerationsCitation8.
Oncogenic alterations in Rearranged during Transfection (RET) genes are reported in multiple solid tumor typesCitation9–12 and are associated with tumor proliferation, metastasis, and poor prognosisCitation13,Citation14. The overall prevalence of RET-altered tumors is low (<2–3%)Citation15–18. Selpercatinib is a highly selective and potent RET kinase inhibitor (RET inhibitor, RETi), which was approved in September 2022 by the US FDA for RET fusion-positive solid tumors (i.e. tumor-agnostic) after being approved in May 2020 for RET-altered non-small cell lung cancer (NSCLC), thyroid cancer (TC), and medullary TC (MTC)Citation19–22. Prior to approval of selpercatinib, RET-altered tumors were commonly treated with anti-angiogenic therapy or immune checkpoint inhibitor alone or in combination with chemotherapy (NSCLC), multi-kinase inhibitors (MKIs; TC and MTC)Citation23–25, with limited data available for other RET-altered tumor types.
In this study, an integrated budget impact model (iBIM) was developed with an aim to estimate the number of patients diagnosed with incident RET-altered solid tumors eligible for treatment with RETi in the US, and to determine the potential budget impact on US third party payers’ formulary budgets associated with the addition of selpercatinib as a tumor-agnostic treatment for patients with these tumor types. The model was referred to as integrated as it is a single model that integrated results across multiple tumor types or indications (as opposed to indication-specific or tumor-specific models developed traditionally).
Methods
Model structure and perspective
This iBIM was developed using Microsoft Excel®, and in accordance with the International Society for Pharmacoeconomics and Outcomes Research (ISPOR) good practice guidelines for conducting BIACitation1.
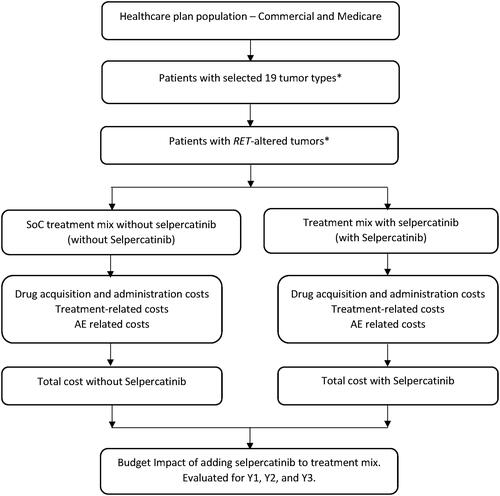
The model included 19 RET-altered tumor types and was developed from the US third party payer perspectives including commercial and Medicare. The model was built using a 3-year (Y) time horizon that allowed determining the impact of varying treatment mix inclusive and exclusive of selpercatinib on payers’ budget. The same structure and approach were applied to both perspectives, with the primary difference being cost and input data used in estimation of the patient population. The model estimated differences in costs between standard of care (SoC) treatment mix in the absence of selpercatinib (without selpercatinib) and the treatment mix with selpercatinib as an available treatment option (with selpercatinib) for all tumor types. The model structure is presented in . Key model assumptions and/or limitations are presented in Supplementary Table S1.
Figure 1. iBIM framework.
* NSCLC, pancreatic cancer, CRC, MTC, TC, salivary gland cancer, cholangiocarcinoma, gastric cancer, small intestine cancer, ovarian cancer, breast cancer, prostate cancer, xanthogranuloma, melanoma skin cancer, non-melanoma skin cancer, sarcoma, pulmonary carcinosarcoma, carcinoid, carcinoma of unknown primary.
Abbreviations: CRC, colorectal cancer; NSCLC, non-small cell lung cancer; MTC, medullary thyroid cancer; TC, thyroid cancer.
Base-case analysis
Patient population
Both commercial and Medicare perspectives were assumed to have one-million plan members. Assumptions and calculations for number of eligible patients for the treatment for each RET-altered tumor type was performed using the base-case population from each plan, disease stage, histology, testing rate, incidence of RET-alteration, proportion of patients eligible for treatment, proportion of patients receiving first-line (1 L) therapy, and proportion of patients receiving second-line or beyond (2 L+) therapy similar to the methodology, as published previouslyCitation26. As an example, Supplementary Table S2 presents detailed attrition demonstrating the estimation of patient population with advanced or metastatic RET fusion-positive NSCLC and Supplementary Table S3 presents the detailed inputs used similarly for each tumor type included in the model.
The 19 RET-altered tumor types included in the iBIM were NSCLC, MTC, TC, salivary gland cancer, pancreatic cancer, colorectal cancer (CRC), cholangiocarcinoma (CCA), gastric cancer, small intestine cancer, ovarian cancer, breast cancer, prostate cancer, xanthogranuloma, melanoma skin cancer, non-melanoma skin cancer, sarcoma, pulmonary carcinosarcoma, carcinoid tumors, and carcinoma of unknown primary. Consistent with the US FDA-approved label, NSCLC, MTC, and TC tumors accounted for both first-line (1 L) and previously (2 L+) treated settings while the remaining tumor types only accounted for 2 L + setting in the modelCitation27. The tumor types included in this iBIM were based on RET-altered tumor types included in the phase 1/2 LIBRETTO-001Citation20 and ARROWCitation28 studies as well as the published literature indicating the presence of oncogenic RET-alterations in multiple solid tumor typesCitation15–18.
Treatments
For each tumor type, the most frequently used treatment regimen in the absence of selective RETi was identified using the IPSOS Oncology Data MonitorCitation29 and included in the model as the SoC for the tumor type (defined as the SoC comparator representative of treatment options available for the disease). Additionally, pralsetinib was included for tumor types where it was approved for use in the US at the time of model developmentCitation30,Citation31. These treatments comprised SoC options in the “without selpercatinib” mix, while selpercatinib was included as an additional treatment option in the “with selpercatinib” mix. Please refer to Supplementary Tables S4 and S5 for details on tumor-specific treatments included in the model.
Market shares (based on internal real-world data and/or forecasting data) were specified for each SoC treatment in the “without selpercatinib” mix at 100% or 75% (if pralsetinib was an added SoC in the mix), which were reduced by the annual forecasted market share of selpercatinib in the “with selpercatinib” mix. The assumed market share for selpercatinib was 65%, 70%, and 75% in years 1 (Y1), 2 (Y2), and 3 (Y3), respectively. Pralsetinib market share was assumed to be constant at 25% across all years in “with and without selpercatinib” mixes. These values were the same for commercial and Medicare perspectives in the model.
Cost inputs
The iBIM used several comprehensive medical resources to estimate the costs of each treatment including drug acquisition costs, administration costs, treatment-related costs (monitoring, supportive care, and its administration), and adverse event (AE) related costs. The costs were reported for individual years and were not discounted, consistent with best practice guidanceCitation1. All costs were inflated to 2022 USD using the half-year 2022 conversion factor for the medical care component of the consumer price index (CPI) that was available at the time of model developmentCitation32.
Drug costs
The drug acquisition and relevant administration costs (Supplementary Tables S4 and S5) for each treatment were calculated based on the recommended drug dosing and the average patient bodyweight for each tumor type, as well as the published median duration of treatmentCitation33. The wholesale acquisition cost (WAC) of drugs sourced from the REDBOOK online database was used for commercial perspective while the Medicare perspective used the payment allowance limits for Medicare Part B drugs as available, and WAC costs where payment allowance limits were not availableCitation34. For intravenous treatment, infusion costs were retrieved from the Centers for Medicare and Medicaid Services (CMS) physician fee schedule for Medicare perspective and were inflated using a multiplier (×1.65) for commercial perspectiveCitation35 (Supplementary Table S1).
Treatment-related costs
Treatment-related costs included monitoring costs (lab fee and physician fee), premedication costs/supportive care drug costs, and their administration costs. Treatment-related costs for each regimen were derived primarily from prescribing information and recommended treatment guidelines (Supplementary Tables S4 and S5).
AE rates and related costs
Grade 3 or higher AEs associated with treatment were included in the model if rates were ≥5% based on published clinical trials related to each treatment included. Costs associated with managing AEs, with an assumption that grade ≥3 AE required hospitalization, were sourced from the Healthcare Cost and Utilization Project databaseCitation36. It was also assumed that rates of AEs and the dosing regimen were the same for commercial and Medicare perspectives. Supplementary Tables S6–S8 present the AE-related costs for treatment by tumor types included in the iBIM.
Analyses
Annual total estimated patient populations diagnosed with incident RET-altered tumors eligible to receive treatment and those treated with selpercatinib (based on forecasted market share) were presented separately for one-million member commercial and Medicare plan perspectives. Similarly, total costs (for “without selpercatinib” and “with selpercatinib”) and the per-member per-month (PMPM) costs were estimated and reported for each of the 3 years. The PMPM cost was calculated as the total cost for a selected year divided by the plan population divided by 12 months. The incremental costs (“with selpercatinib” minus “without selpercatinib”) representing the budget impact associated with introduction of selpercatinib as an additional treatment option in Y1, Y2, and Y3 were also reported individually for 3 years. Incremental total costs were also disaggregated into costs of drug acquisition, drug administration/Tx infusion, treatment-related, and AE-related. All costs were reported for the integrated tumor-agnostic population as well as reported separately for individual tumor types.
Sensitivity and scenario analyses
One-way sensitivity analyses (OWSA)
Base-case model parameters were varied by ±10% to assess uncertainty in estimated incremental costs for both perspectives across 3 years. The ten most influential parameters were presented in tornado graphs. This OWSA was performed for the integrated model including all tumor types, however, functionality was built in the model to conduct OWSA for a single or a selected list of tumor types as well (data not shown).
Alternative comparator costing
An additional sensitivity analysis was conducted using an alternative approach for costing SoC, in which average costs associated with treating each disease (in 1 L or 2 L + settings as applicable) were obtained from published literature instead of micro-costing only one treatment selected to be the representative of the disease (in base-case approach) for each tumor type included in the model. In the absence of published literature for a few rare tumor types, an estimated cost of treating each disease from the base-case was used. Supplementary Table S9 presents the average SoC costs used in this sensitivity analyses and the assumptions made for each tumor type.
Scenario analyses
In addition to the base-case analysis, which assumed a 100% RET testing rate and included 19 RET-altered tumors, we also conducted analyses for two different scenarios. In scenario 1 (50% RET testing scenario), the rate of RET testing was assumed as 50%, to estimate the potential budget impact to payers that is reflective of contemporary real-world evidence, which demonstrates that not all patients with cancer currently receive biomarker testingCitation37. In scenario 2 (gastrointestinal tumor-specific scenario, GI-specific), the integrated model was restricted to five GI-specific tumor types (pancreatic cancer, CRC, CCA, gastric cancer, and small intestinal cancer) to provide the estimated size of the eligible patient population and associated budgetary impacts in GI-setting. The GI-specific scenario was conducted given the higher prevalence of these diseases observed in the non-lung/non-thyroid cohort of patients treated with selpercatinib in the LIBRETTO-001 trial as well as the high unmet need reported in this population, and the ARROW trial for pralsetinibCitation22,Citation38,Citation39. These scenario analyses followed the same costing approach as described in the base-case, unless specified otherwise.
Results
Base-case
Commercial perspective (1-million-member plan)
Overall, 11.68 patients per million were estimated to have an incident diagnosis of RET-altered advanced or metastatic cancer and considered eligible for treatment annually, of which 7.59 (Y1) to 8.76 (Y3) patients were estimated to be treated with selpercatinib ().
Table 1. Estimated patient population per million.
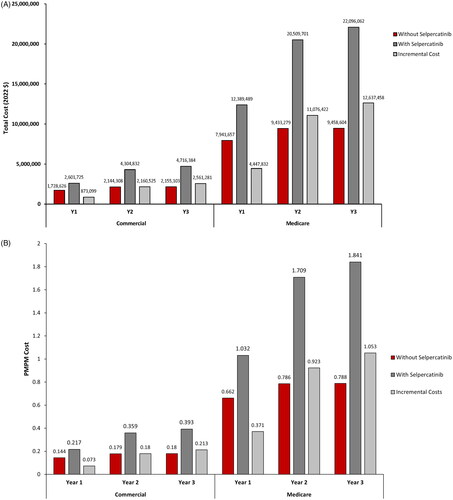
The incremental total costs of adding selpercatinib as a tumor-agnostic treatment option for patients with RET-altered tumors were estimated to be $873,099 (Y1), $2,160,525 (Y2), and $2,561,281 (Y3) (), with corresponding incremental PMPM costs estimated at $0.073 (Y1), $0.180 (Y2), and $0.213 (Y3) (). For the included tumor types, the estimated incremental total costs ranged from −$3,395 to $252,537 (Y1), $372 to 922,071 (Y2), and $398 to $1,017,597 (Y3); and the estimated corresponding incremental PMPM costs ranged from $0.000 to $0.021 (Y1), $0.000 to $0.077 (Y2), and $0.000 to $0.085 (Y3) (Supplementary Tables S10–S12), including disaggregated incremental costs.
Figure 2. Incremental costs for commercial and medicare perspectives – all tumor types, base-case.
Medicare perspective (1-million-member plan)
Overall, 55.82 patients per million were estimated to have an incident diagnosis of RET-altered advanced or metastatic cancer and considered eligible for treatment annually, of which 36.29 (Y1) to 41.87 (Y3) patients were estimated to be treated with selpercatinib ().
The incremental total costs of adding selpercatinib as a tumor-agnostic treatment option for patients with RET-altered tumors were estimated to be $4,447,832 (Y1), $11,076,422 (Y2), and $12,637,458 (Y3) (), with corresponding incremental PMPM costs of $0.371 (Y1), $0.923 (Y2), and $1.053 (Y3) (). For the included tumor types, the estimated incremental total costs ranged from –$7,926 to $1,490,016 (Y1), $1,205 to $5,200,859 (Y2), and $1,291 to $5,746,766 (Y3); and the estimated corresponding incremental PMPM costs ranged from $−0.001 to $0.124 (Y1), $0.000 to $0.433 (Y2), and $0.000 to $0.479 (Y3) (Supplementary Tables S13–S15), including disaggregated incremental costs.
Sensitivity and scenario analyses
OWSA
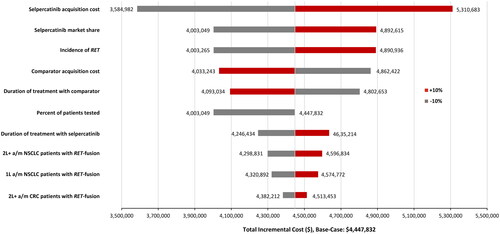
In the commercial perspective, the drug acquisition cost of selpercatinib was the most important driver of incremental costs across all 3 years, with duration of selpercatinib or comparator treatment, comparator acquisition cost, selpercatinib market share, and the incidence of RET being the other most influential drivers of incremental costs (, Supplementary Figures S1 and S2). These observations were similar in the Medicare perspective with a few notable differences. For example, selpercatinib market share was not one of the prominent drivers of incremental cost in Y1. In addition, for Y2 and Y3 of Medicare perspective, the percent of patients tested for RET and the number of 1 L a/mNSCLC patients with RET fusion were additional drivers of incremental cost (, Supplementary Figures S3 and S4).
Figure 3. OWSA, base-case – commercial perspective (Y1).
Abbreviations: 1L, first-line; 2L+, second-line and beyond; CRC, colorectal cancer; NSCLC, non-small cell lung cancer; RET, REarranged during Transfection; Y1, year 1.
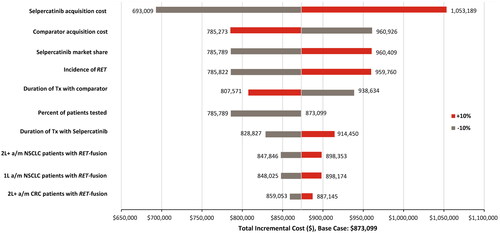
Figure 4. OWSA, base-case – Medicare perspective (Y1).
Abbreviations: 1L, first-line; 2L+, second-line and beyond; CRC, colorectal cancer; NSCLC, non-small cell lung cancer; RET, REarranged during Transfection; Y1, year 1.
Alternative comparator costing
The results for the alternative comparator costing analysis were mostly similar to the results of base-case analysis. Please refer to Supplementary Figures S5A and B and Supplementary Tables S16–S21 for detailed results.
Scenario analysis
For scenario 1, decreasing the rate of testing from 100% to 50% decreased the incremental total cost and incremental PMPM cost to half of the values in the base-case ( and ).
Table 2. Scenario analyses.
For scenario 2, the incremental total costs and incremental PMPM costs for GI-tumors accounted for approximately 18%, 8%, and 7% of the incremental PMPM for a tumor-agnostic population (as reported in base-case) in Y1, Y2, and Y3 in the commercial perspective, respectively. From the Medicare perspective, GI-tumors accounted for approximately 17%, 7%, and 7% of the incremental PMPM for a tumor-agnostic population (as reported in base-case) in Y1, Y2, and Y3, respectively ( and ).
Discussion
To the best of our knowledge, this is the first BIM that developed an approach to estimate the economic impact of a new treatment approved for tumor-agnostic use in the US. In this iBIM, we estimated the annual number of patients diagnosed with incident RET-altered tumors eligible to receive treatment and reported a modest incremental cost of introducing selpercatinib to a third party payers’ budget in the US for treatment of patients with RET-altered tumors. Most influential parameters affecting the incremental costs included cost of drug acquisition (selpercatinib or comparator SoC), share of market of selpercatinib, incidence of RET-alteration, and duration of selpercatinib treatment. These notable findings were consistent across both commercial and Medicare perspectives evaluated in this study.
The estimated total annual number of patients diagnosed with RET-altered tumors was 11.68 (commercial) and 55.82 (Medicare) per million, which ranged from 0.01 to 5.84 (commercial) and 0.03 to 34.37 (Medicare) patients per million for different tumor types. The estimated number of patients was expected to be low given the known incidence of RET-alterations across tumor typesCitation16–18,Citation40–43, which in turn might be a function of low rates of biomarker testing in the real-world. Duff et al. previously estimated a patient population with RET-altered lung (2–4.6 patients/million) and thyroid cancers (0.5–0.7 patients/million) assuming an increased rate of testing for RET (30–70%) over 3 years in the USCitation44. Despite using lower and contemporary rates of incidence of RET-alterations in lung and thyroid cancers in this study versus the analysis by Duff et al. the estimated patient population numbers for the same tumor types were higher in the current base-case analysis because the RET testing rate was assumed at 100% to avoid potential underestimation of impact to payers.
To our knowledge, no other study has published a comprehensive estimation of eligible patient population diagnosed with RET-altered tumors in the US and this is one of the key strengths of this current analysis. As molecular testing increases over time, the incidence of RET may change, potentially affecting the numbers presented in this analysis. Currently, however, the low testing rates for identification of biomarkers translates into lower use of appropriate treatments, which is also described in literature where providers reported sub-optimal knowledge of screening for RET-alterations that resulted in initiating a sub-optimal treatment planCitation45.
The addition of selpercatinib as a tumor-agnostic treatment for patients with RET-altered tumors in this analysis was shown to be associated with an increase of 7–21 cents (commercial, percent change: 50% [Y1], 100% [Y2], and 118% [Y3]) or 37–105 cents (Medicare, percent change: 56% [Y1], 117% [Y2], and 137% [Y3]) on a PMPM basis over Y1 to Y3 in the US. This assumed the rate of testing for RET at 100%, however, these estimates were reduced to 4–11 cents (commercial; percent change: 51% [Y1], 101% [Y2], and 78% [Y3]) or 18–53 cents (Medicare; percent change: 56% [Y1], 118% [Y2], and 134% [Y3]) over Y1 to Y3 when the rate of testing for RET was reduced to 50% (scenario analysis 1). The estimates from scenario analysis 1 may better reflect the current budget impact to payers given that rates of biomarker testing in the US are approximately 50–60%Citation23,Citation24. Focusing on GI-specific cancers alone (scenario analyses 2), these numbers ranged from 1.3–1.5 cents (commercial, percent change: 118% [Y1], 127% [Y2], and 136% [Y3]) and 6–7 cents (Medicare, percent change: 175% [Y1], 186% [Y2], and 200% [Y3]) on a PMPM basis over Y1 to Y3, suggesting a modest impact to address a high unmet need. Collectively, these findings indicate that including selpercatinib as an additional treatment option for patients with RET-altered tumors resulted in a modest increase in cost burden for payers. The increase in incremental PMPM costs in this iBIM is attributed to the assumed increase in the market share of selpercatinib over 3 years, and these PMPM costs were higher for the Medicare than observed for the commercial perspective due to the greater number of patients diagnosed with RET-altered tumors in those aged 65 years or more. This was consistently observed in both base-case and scenario analyses.
Non-selective inhibitors of RET (such as cabozantinib, vandetanib, and lenvatinib) have demonstrated lower efficacy in few RET-altered cancers compared with selpercatinib, with high incidence of AEsCitation46,Citation47. Furthermore, the clinical benefit of MKIs in the RET-altered cancers has generally been poor, with modest benefit in RET-mutant MTCCitation48,Citation49. In the LIBRETTO-431 (vs. platinum-based chemotherapy +/- pembrolizumab) and LIBRETTO-531 (vs. MKI – cabozantinib or vandetanib) phase 3 randomized controlled trials, selpercatinib demonstrated significant and clinically meaningful improvements in progression-free survival in patients with RET-altered NSCLC and MTC in the first-line setting, respectivelyCitation50,Citation51. Additionally, in the LIBRETTO-001 trial, selpercatinib showed clinically meaningful activity in various RET-altered non-lung/non-thyroid solid tumors and was reported as well-toleratedCitation22. The published clinical efficacy evidence of selpercatinib and the modest economic impact of selpercatinib observed in this analysis together indicate the added value of selpercatinib as a tumor-agnostic treatment option for patients with RET-altered tumors. The highly selective nature of selpercatinib and these data also suggest making biomarker testing available to a broader patient population, which will help in initiating the appropriate biomarker-driven targeted therapy in eligible patients wherever available. A collaborative effort between regulatory bodies, industry, laboratories, and academia is important to have a consensus on factors such as patient heterogeneity and interpretation of NGS resultsCitation52. This is required to create a unified approach to testing, which includes waiting for test results (in most cases, as applicable) and subsequently initiating appropriate concordant targeted therapy for eligible patients.
Strengths and limitations
This iBIM has several strengths. The model was flexible to integrate data across 19 different tumor types for a wholistic view as well as to view results independently for each tumor type as desired. The model allowed for inclusion of various inputs for drug acquisition costs (WAC or AWP – data not shown), multiple costing approaches, and study perspective (commercial and Medicare). The model also allows users to conduct sensitivity analyses at the global/integrated level across all tumor types as well as for a specific tumor type of choice. Overall, the present iBIM provides monetary impact to payers associated with use of a single new drug across all plausible indications, providing them with more practical information versus individual disease-specific indications as reported traditionally. The scenario analysis of 50% testing rate for RET reduced the incremental total and incremental PMPM costs to 50% of the base-case values, which may be the actual incremental values in the real-world setting where all patients are not tested for biomarkers. The scenario analysis showed GI-tumors form approximately 17% of the RET-altered tumor cases, making it a large subgroup after NSCLC, MTC, and TC. It is expected that this wholistic information will be helpful to payers in formulary decision-making. Additionally, this iBIM serves as a proof of concept for future economic models evaluating the impact of treatments approved for tumor-agnostic use (or potentially for many indications) developed using innovative trial designs such as basket trials. A systematic review of oncology study protocols demonstrated that the number of master trials, including basket trials, have increased in the last 5 years and are expected to increase in the future. This is due to the potential efficiency they offer in drug development and approval processCitation53.
There are also a few limitations of this model. The assumptions of static populations, incident rates, and market share are approximations that simplify the use of this iBIM; however, these are modifiable inputs in the model and could be changed as appropriate for a stakeholder. The number of patients in each population of interest or the relative costs of treatment were not expected to change substantially over a 3-year period. The costs of drug treatment were based on WAC pricing from RED BOOK, and since they do not include any discounts, deductibles, or co-payments, they may not reflect the final cost to the budget holder. The AEs included in the model were only grade ≥3 that were assumed to incur hospitalization costs and were assumed to be independent when there may have been either additional costs due to their severity or savings due to concurrent hospitalizations. The model did not account for adherence to treatment (and associated drug wastage). Treatment duration and the rates of AEs were obtained from primary clinical trials of treatments and were not based on meta-analyses; these inputs may or may not differ from common clinical practice. Finally, while pralsetinib was included as an additional comparator in the model for patients with MTC per approved label and national treatment guidelines available during the development of the model, this indication was recently withdrawnCitation54, however, it does not have a substantial impact on the results presented here.
Conclusions
The integrated model estimated approximately 12 (commercial) or 56 (Medicare) patients per million per year that were diagnosed with RET-altered tumors and would be eligible for treatment with RET inhibitors. The 3-year incremental PMPM cost estimates suggest modest impact on payer-budgets associated with the introduction of selpercatinib as a tumor-agnostic treatment. Among various factors, selpercatinib acquisition cost was the most significant driver of incremental costs. Lastly, the methodology described in this iBIM serves as a proof of concept for future economic models evaluating treatments approved for tumor-agnostic use.
Transparency
Declaration of funding
Medical Decision Modeling Inc. received funding from Eli Lilly and Company to conduct the study.
Declaration of financial/other relationships
NRB, AMG, and AAA are employees and minor stockholders at Eli Lilly and Company. JM and LS are employees of Medical Decision Modeling Inc., which was contracted by Eli Lilly and Company to perform the analysis.
Author contributions
Conception of work: NRB, JM, AAA LS. Design of work: NRB, AMG, JM, LS. Acquisition of data: JM, LS. Data Analysis: JM, LS. Data interpretation: NRB, AMG, JM, AAA, LS. Manuscript writing and critical revision: NRB, AMG, JM, AAA, LS. Final approval: NRB, AMG, JM, AAA, LS.
Reviewer disclosures
Peer reviewers on this manuscript have no relevant financial or other relationships to disclose.
Ethics approval
This iBIM was exempt from institutional review board approval as it did not include patients directly.
Consent to participate
Due to the nature of the study, consent to participate from patients was not required.
Consent to publication
The manuscript does not contain any individual person’s data in any form. Therefore, consent for publication was not required.
Previous presentation
The abstract and poster were presented at the International Society for Pharmacoeconomics and Outcomes Research (ISPOR); Boston, MA; 7–10 May 2023 (Poster ID EE507).
Supplemental Material
Download MS Word (1.3 MB)Acknowledgements
The authors would like to acknowledge Frank Cinfio, a former employee of Medical Decision Modeling Inc., for his contributions in model development. The authors would also like to acknowledge Karan Sharma from Eli Lilly Services India Private Limited for his medical writing and editorial assistance during the preparation of this manuscript.
Data sharing statement
The integrated budget impact model could be available to health care decision makers, healthcare organizations, and third party payers by contacting The Lilly Answers Center at 1-800-LillyRx (1-800-545-5979).
Disclosure statement
Naleen Raj Bhandari, Adrienne M. Gilligan, and Amine Ale-Ali are employees and minor stockholders at Eli Lilly and Company. Julie Myers and Lee Smolen are employees of Medical Decision Modeling Inc., which was contracted by Eli Lilly and Company to perform the analysis.
References
- Sullivan SD, Mauskopf JA, Augustovski F, et al. Budget impact analysis-principles of good practice: report of the ISPOR 2012 Budget Impact Analysis Good Practice II Task Force. Value Health. 2014;17(1):5–14. doi: 10.1016/j.jval.2013.08.2291.
- Schlander M, Dintsios CM, Gandjour A. Budgetary impact and cost drivers of drugs for rare and ultrarare diseases. Value Health. 2018;21(5):525–531. doi: 10.1016/j.jval.2017.10.015.
- Hay JW. Now is the time for transparency in value-based healthcare decision modeling. Value Health. 2019;22(5):564–569. doi: 10.1016/j.jval.2019.01.009.
- Schiller J, Eckhardt H, Schmitter S, et al. Challenges and solutions for the benefit assessment of tumor-agnostic therapies in Germany. Value Health. 2023;26(6):854–864. doi: 10.1016/j.jval.2023.01.011.
- Weis LN, Tolaney SM, Barrios CH, et al. Tissue-agnostic drug approvals: how does this apply to patients with breast cancer? NPJ Breast Cancer. 2021;7(1):120. doi: 10.1038/s41523-021-00328-3.
- Hobbs BP, Pestana RC, Zabor EC, et al. Basket trials: review of current practice and innovations for future trials. J Clin Oncol. 2022;40(30):3520–3528. doi: 10.1200/JCO.21.02285.
- Raez LE, Santos ES. Tumor type-agnostic treatment and the future of cancer therapy. Target Oncol. 2018;13(5):541–544. doi: 10.1007/s11523-018-0593-y.
- Sullivan S, Carlson J, Hansen R, et al. Challenges estimating the economic value of tissue-agnostic anti-cancer treatments. J Manag Care Spec Pharm. 2018;24:10A–32.
- Mulligan LM. 65 YEARS OF THE DOUBLE HELIX: exploiting insights on the RET receptor for personalized cancer medicine. Endocr Relat Cancer. 2018;25(8):T189–T200. doi: 10.1530/ERC-18-0141.
- Kato S, Subbiah V, Marchlik E, et al. RET aberrations in diverse cancers: next-generation sequencing of 4,871 patients. Clin Cancer Res. 2017;23(8):1988–1997. doi: 10.1158/1078-0432.CCR-16-1679.
- Davis JL, Vargas SO, Rudzinski ER, et al. Recurrent RET gene fusions in paediatric spindle mesenchymal neoplasms. Histopathology. 2020;76(7):1032–1041. doi: 10.1111/his.14082.
- Santoro M, Moccia M, Federico G, et al. RET gene fusions in malignancies of the thyroid and other tissues. Genes (Basel). 2020;11(4):424. doi: 10.3390/genes11040424.
- Regua AT, Najjar M, Lo HW. RET signaling pathway and RET inhibitors in human cancer. Front Oncol. 2022;12:932353. doi: 10.3389/fonc.2022.932353.
- Li AY, McCusker MG, Russo A, et al. RET fusions in solid tumors. Cancer Treat Rev. 2019;81:101911. doi: 10.1016/j.ctrv.2019.101911.
- Addeo A, Miranda-Morales E, den Hollander P, et al. RET aberrant cancers and RET inhibitor therapies: current state-of-the-art and future perspectives. Pharmacol Ther. 2023;242:108344. doi: 10.1016/j.pharmthera.2023.108344.
- Zhou L, Li J, Zhang X, et al. An integrative pan cancer analysis of RET aberrations and their potential clinical implications. Sci Rep. 2022;12(1):13913. doi: 10.1038/s41598-022-17791-y.
- Parimi V, Tolba K, Danziger N, et al. Genomic landscape of 891 RET fusions detected across diverse solid tumor types. NPJ Precis Oncol. 2023;7(1):10. doi: 10.1038/s41698-023-00347-2.
- Andreev-Drakhlin A, Roszik J, Subbiah V. The landscape of RET alterations from 56,970 adult patients with cancer: clinical implications. J Clin Oncol. 2019;37(15_suppl):3106. doi: 10.1200/JCO.2019.37.15_suppl.3106.
- FDA approves selpercatinib for lung and thyroid cancers with RET gene mutations or fusions. 2020 [cited 2023 Jun 9]. Available from: https://www.fda.gov/drugs/resources-information-approved-drugs/fda-approves-selpercatinib-lung-and-thyroid-cancers-ret-gene-mutations-or-fusions
- Drilon A, Oxnard GR, Tan DSW, et al. Efficacy of selpercatinib in RET fusion-positive non-small-cell lung cancer. N Engl J Med. 2020;383(9):813–824. doi: 10.1056/NEJMoa2005653.
- FDA approves selpercatinib for locally advanced or metastatic RET fusion-positive solid tumors. 2022 [cited 2023 Jun 8]. Available from: https://www.fda.gov/drugs/resources-information-approved-drugs/fda-approves-selpercatinib-locally-advanced-or-metastatic-ret-fusion-positive-solid-tumors
- Subbiah V, Wolf J, Konda B, et al. Tumour-agnostic efficacy and safety of selpercatinib in patients with RET fusion-positive solid tumours other than lung or thyroid tumours (LIBRETTO-001): a phase 1/2, open-label, basket trial. Lancet Oncol. 2022;23(10):1261–1273. doi: 10.1016/S1470-2045(22)00541-1.
- Hess LM, Han Y, Zhu YE, et al. Characteristics and outcomes of patients with RET-fusion positive non-small lung cancer in real-world practice in the United States. BMC Cancer. 2021;21(1):28. doi: 10.1186/s12885-020-07714-3.
- Parikh R, Hess LM, Esterberg E, et al. Diagnostic characteristics, treatment patterns, and clinical outcomes for patients with advanced/metastatic medullary thyroid cancer. Thyroid Res. 2022;15(1):2. doi: 10.1186/s13044-021-00119-9.
- Nabhan F, Dedhia PH, Ringel MD. Thyroid cancer, recent advances in diagnosis and therapy. Int J Cancer. 2021;149(5):984–992. doi: 10.1002/ijc.33690.
- Bhandari NR, Cinfio F, Souri S, et al. Estimation of the population of patients with ret-altered tumors in the United States. Value Health. 2020;3(5);Supple 1. Available from: https://www.ispor.org/heor-resources/presentations-database/presentation/intl2020-3182/99990
- Selpercatinib Prescribing Information. 2022 [cited 2023 Jul 24]. Available from: https://pi.lilly.com/us/retevmo-uspi.pdf
- GAVRETO Prescribing Information. 2020 [cited 2023 Aug 9]. Available from: https://www.accessdata.fda.gov/drugsatfda_docs/label/2020/214701s000lbl.pdf
- IPSOS Oncology Monitor (US). 2021. [cited 2023 Aug 17]. Available from: https://www.ipsos.com/
- Kim J, Bradford D, Larkins E, et al. FDA approval summary: pralsetinib for the treatment of lung and thyroid cancers with RET gene mutations or fusions. Clin Cancer Res. 2021;27(20):5452–5456. doi: 10.1158/1078-0432.CCR-21-0967.
- NCCN Clinical Practice Guidelines in Oncology (NCCN Guidelines®). Thyroid Carcinoma. Version 4. 2023. [cited 2023 Sep 15]. https://www.nccn.org/professionals/physician_gls/pdf/thyroid.pdf
- U.S. Department of Labor. Bureau of Labor Statistics. Consumer Price Index-all urban consumers, U.S, medical care, 2022 half year value; 2022 [cited 2023 Jun 8]. Available from: http://data.bls.gov/cgi-bin/surveymost?cu
- [RED BOOK] Micromedex® 2.0. (electronic version). Truven Health Analytics, Greenwood Village, Colorado, USA; 2022 [cited 2023 Jul 7]. Available from: http://www.micromedexsolutions.com/
- CMS ASP File. 2022 [cited 2023 Jun 8]. Available from: https://www.cms.gov/medicare/medicare-part-b-drug-average-sales-price/2022-asp-drug-pricing-files
- Avalere Health LLC. Chart 4.5: aggregate hospital payment-to-cost ratios for private payers, Medicare and Medicaid. Trendwatch Chartbook 2021. American Hospital Association; 2021 [cited 2023 Jul 9]. Available from: https://www.aha.org/system/files/media/file/2020/10/TrendwatchChartbook-2020-Appendix.pdf
- [HCUP 2022] HCUPnet, Healthcare Cost and Utilization Project. Agency for Healthcare Research and Quality, Rockville, MD; [cited 2023 Jun 8]. Available from: https://hcupnet.ahrq.gov/. For more information about HCUP data see http://www.hcup-us.ahrq.gov/
- Freedman AN, Klabunde CN, Wiant K, et al. Use of next-generation sequencing tests to guide cancer treatment: results from a nationally representative survey of oncologists in the United States. J Clin Oncol Precis Oncol. 2018;2:1–13. doi: 10.1200/PO.18.00169.
- Malangone-Monaco E, Doleh Y, Cole A, et al. The economic burden of metastatic pancreatic cancer. Pancreatology. 2020;20(7):1434–1441. doi: 10.1016/j.pan.2020.09.002.
- Phase 1/2 Study of the Highly-selective RET Inhibitor. Pralsetinib (BLU-667), in participants with thyroid cancer, non-small cell lung cancer, and other advanced solid tumors (ARROW). [cited 2023 Oct 26]. Available from: https://clinicaltrials.gov/study/NCT03037385
- Drusbosky LM, Rodriguez E, Dawar R, et al. Therapeutic strategies in RET gene rearranged non-small cell lung cancer. J Hematol Oncol. 2021;14(1):50. doi: 10.1186/s13045-021-01063-9.
- Puliafito I, Esposito F, Prestifilippo A, et al. Target therapy in thyroid cancer: current challenge in clinical use of tyrosine kinase inhibitors and management of side effects. Front Endocrinol. 2022;13:860671. doi: 10.3389/fendo.2022.860671.
- National Cancer Institute. SEER Cancer Stat Facts: thyroid cancer. [cited 2023 Jun 9]. Available from: https://seer.cancer.gov/statfacts/html/thyro.html
- Wirth LJ, Sherman E, Robinson B, et al. Efficacy of selpercatinib in RET-altered thyroid cancers. N Engl J Med. 2020;383(9):825–835. doi: 10.1056/NEJMoa2005651.
- Duff S, Bargiacchi F, Norregaard C, et al. The budget impact of adding pralsetinib to a US health plan formulary for treatment of non-small cell lung cancer and thyroid cancer with RET alterations. J Manag Care Spec Pharm. 2022;28(2):218–231. doi: 10.18553/jmcp.2021.21308.
- Murray S, Subbiah V, Sherman SI, et al. Challenges in the care of patients with RET-altered thyroid cancer: a multicountry mixed-methods study. Thyroid Res. 2023;16(1):22. doi: 10.1186/s13044-023-00166-4.
- Cascetta P, Sforza V, Manzo A, et al. RET inhibitors in non-small-cell lung cancer. Cancers (Basel). 2021;13(17):4415. doi: 10.3390/cancers13174415.
- Elisei R, Grande E, Kreissl MC, et al. Current perspectives on the management of patients with advanced RET-driven thyroid cancer in Europe. Front Oncol. 2023;13:1141314. doi: 10.3389/fonc.2023.1141314.
- Subbiah V, Velcheti V, Tuch BB, et al. Selective RET kinase inhibition for patients with RET-altered cancers. Ann Oncol. 2018;29(8):1869–1876. doi: 10.1093/annonc/mdy137.
- Drilon A, Hu ZI, Lai GGY, et al. Targeting RET-driven cancers: lessons from evolving preclinical and clinical landscapes. Nat Rev Clin Oncol. 2018;15(3):151–167. doi: 10.1038/nrclinonc.2017.175.
- Zhou C, Solomon B, Loong HH, et al. First-Line selpercatinib or chemotherapy and pembrolizumab in RET fusion-positive NSCLC. N Engl J Med. 2023;389(20):1839–1850. doi: 10.1056/NEJMoa2309457.
- Hadoux J, Elisei R, Brose MS, et al. Phase 3 trial of selpercatinib in advanced RET-mutant medullary thyroid cancer. N Engl J Med. 2023;389(20):1851–1861. doi: 10.1056/NEJMoa2309719.
- Gristina V, Pisapia P, Barraco N, et al. The significance of tissue-agnostic biomarkers in solid tumors: the more the merrier? Expert Rev Mol Diagn. 2023;23(10):851–861. doi: 10.1080/14737159.2023.2245752.
- Park JJH, Siden E, Zoratti MJ, et al. Systematic review of basket trials, umbrella trials, and platform trials: a landscape analysis of master protocols. Trials. 2019;20(1):572. doi: 10.1186/s13063-019-3664-1.
- Genentech withdraws US indication for pralsetinib in advanced or metastatic RET + medullary thyroid cancer. [cited 2023 Sep 15]. Available from: https://www.onclive.com/view/genentech-withdraws-us-indication-for-pralsetinib-in-advanced-or-metastatic-ret-medullary-thyroid-cancer