
Abstract
Aim
To evaluate the cost-effectiveness of adjuvant nivolumab compared with surveillance for the treatment of patients with high-risk muscle-invasive urothelial carcinoma (MIUC) after radical resection from a US healthcare payer perspective and to investigate the impact of alternative modeling approaches on the cost-effectiveness results.
Material and methods
A four-state, semi-Markov model consisting of disease free, local recurrence, distant recurrence, and death health states was developed to investigate the cost-effectiveness of nivolumab compared with surveillance over a 30-year time horizon. The model used data from the randomized CheckMate 274 trial (NCT02632409) and published literature to inform transitions among health states, and inputs on cost, utility, adverse event, and disease management. Scenario analyses were conducted to investigate the impact of model structure and key assumptions on the results. One-way deterministic and probabilistic sensitivity analysis were conducted to investigate the robustness of the results.
Results
Total expected costs were higher with nivolumab ($162 268) compared with surveillance ($62 965). Nivolumab was associated with improved survival (1.53 life-years gained compared with surveillance) and an incremental gain of 0.94 quality-adjusted life-years (QALYs). Although total treatment costs were higher for nivolumab, cost offsets were observed because of delayed or avoided recurrences and deaths experienced with nivolumab compared with observation. The incremental cost-effectiveness and cost-utility ratios were $64 929/life-year and $105 660/QALY.
Limitations
At the time of analysis, CheckMate 274 had limited follow-up on disease-free survival and no overall survival data. The limited evidence necessitated assumptions on modeling survival after each type of recurrence.
Conclusions
Nivolumab is estimated to be a life-extending and cost-effective option for adjuvant treatment of MIUC for patients who are at high risk of recurrence after undergoing radical resection in the United States. Using a threshold of $150,000/QALY, the cost-effectiveness conclusions remained consistent across the scenario and sensitivity analyses conducted.
Introduction
Bladder cancer is the fourth most common cancer in men in the United States (US), with an estimated 81,180 new diagnoses overall in 2022 in the USCitation1. With its significant mortality and morbidity profile, it is among the most expensive tumors to treat over a lifetimeCitation2; average lifetime treatment cost per patient is estimated at $117,000–$191,000 dependent on stage of diagnosisCitation3. Urothelial carcinoma (UC), accounting for approximately 90% of bladder cancers, represents the predominant histologic typeCitation4. The majority of patients who die from UC have an initial primary muscle-invasive UC (MIUC) diagnosis, which is associated with a higher risk of recurrence and poorer prognosis despite curative intent of radical surgery (cystectomy, nephroureterectomy, or urethrectomy) with or without (neo)adjuvant therapyCitation5.
MIUC is typically managed with radical resection (RR) after neoadjuvant cisplatin-based combination chemotherapy. Cisplatin-based adjuvant chemotherapy may be considered for patients who do not receive neoadjuvant chemotherapy, have no contraindication to cisplatin, and are at high risk of recurrence, but there is a lack of strong evidence to support this practiceCitation5,Citation6. For patients with upper urinary tract UC, minimally invasive surgery with perioperative chemotherapy is the recommended approachCitation7.
Nivolumab is a fully human immunoglobulin G4 monoclonal antibody that became the first immuno-oncology agent to receive US Food and Drug Administration approval for the adjuvant treatment of patients with UC who are at high risk of recurrence after undergoing RRCitation8. The efficacy of nivolumab for the adjuvant treatment of MIUC was demonstrated in the placebo-controlled phase 3 CheckMate 274 trial (NCT02632409). The study population in this trial was adults (aged ≥18 years) who were at high risk of recurrence after undergoing RR of MIUC originating in the bladder or upper urinary tract (renal pelvis or ureter)Citation9. In CheckMate 274, nivolumab significantly improved disease-free survival (DFS) compared with placebo, with a hazard ratio of 0.70 (95% confidence interval [CI], 0.57–0.85) in the intention-to-treat (ITT) population for the database lock underpinning this analysis. Reported median (95% CI) DFS for the ITT population was 22.0 (17.7–36.9) months for the nivolumab arm compared with 10.9 (8.3–14.0) months for the placebo armCitation7.
With increased cost of cancer treatments in the US, a shift toward value-based oncology has been suggestedCitation10, and cost-effectiveness analyses have become increasingly relevant to decision-making in the USCitation11. With the introduction of nivolumab in the adjuvant setting of MIUC, it is therefore important to investigate whether offering immunotherapy in an earlier setting would be a cost-effective treatment option.
There were two main objectives in our study. The first objective was to evaluate, from a US payer perspective, the cost-effectiveness of adjuvant nivolumab compared with placebo—a proxy for surveillance in CheckMate 274—in patients with high-risk MIUC after RR. The second objective was to compare differences in cost-effectiveness results for adjuvant nivolumab across alternative modeling approaches.
Methods
Model overview
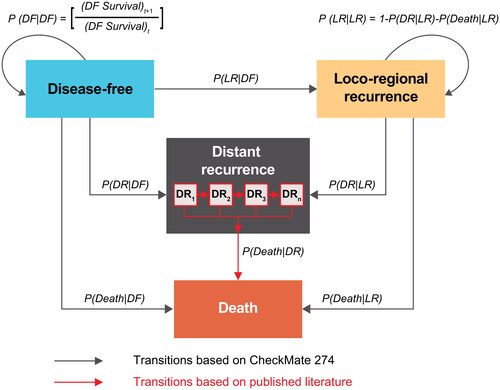
The model was developed based on the challenges, considerations, and approaches presented in an accompanying articleCitation12. The base-case model () was developed as a four–health-state, semi-Markov model consisting of mutually exclusive health states: disease free (DF), local recurrence (LR), distant recurrence (DR), and death, with a cycle length of 1 week. The four-state model denotes a better representation of the clinical progression of MIUC compared with a three-state model by differentiating the prognoses between LR and DR, and their associated costs and health outcomesCitation12. To investigate the impact of this structural assumption on the long-term projection of survival outcomes and cost-effectiveness of nivolumab, an option merging LR and DR into a single recurred-disease health state and reducing the number of states into three was also available in the model (Supplementary Material A, Figure A-1). Differences in outcomes using the three-state model are presented in a scenario analysis.
Figure 1. Model overview. Abbreviations. DF, disease-free; DR, distant recurrence; LR, local recurrence; P(Death|DF), probability of death from DF; P(Death|LR), probability of death from LR; P(DF|DF), probability of staying in DF; P(DR|DF), probability of moving from DF to DR; P(DR|LR), probability of moving from LR to DR; P(LR|DF), probability of moving from DF to LR; P(LR|LR), probability of staying in LR.
Note: DR1 to n indicates model’s ability to track the time of entrance to the DR state via series of tunnel states, which are needed for the application of probability distributions with an underlying time-variant hazard structure.
The analysis was carried out from a US healthcare payer perspective. Cost-effectiveness results are expressed as incremental cost per life-year (LY) gained (incremental cost-effectiveness ratio [ICER]) and incremental cost per quality-adjusted LY (QALY) gained (incremental cost-utility ratio [ICUR]), consistent with the reference case for economic evaluations published by the Institute for Clinical and Economic ReviewCitation13. Based on the median age at diagnosis (73 years)Citation14 and the possibility for long-term remission after RR with or without adjuvant treatment with nivolumab, a time horizon of 30 years was chosen to reflect all important differences in costs or health outcomes between adjuvant nivolumab and surveillance over a lifetime while capturing all intended and unintended consequences associated with them.
Costs and health outcomes were discounted with a 3% annual discount rate per US guidelinesCitation13. Transition probabilities were informed based on survival analysis of both CheckMate 274 efficacy data and data from the published literatureCitation15–17. Estimates for the utility scores in each health-state were based on EQ-5D 3-Level version (EQ-5D-3L) data collected in CheckMate 274. Drug acquisition costs for year 2022 were obtained from RED BOOKCitation18, whereas drug administration, monitoring, and routine disease management costs were derived from Centers for Medicare and Medicaid Services (CMS) dataCitation19. All costs were inflated to 2022 US dollars. End-of-life care and disease management resource use (outpatient visits, monitoring tests, surgery, and terminal care) were based on clinical expert input. Details on model inputs are presented in Supplementary Material B-F. The model was developed in Microsoft Excel, and the survival analyses used to obtain transition probabilities were conducted in R version 4.1.1 using the survival, flexsurv, and bshazard packages. The following sections provide methodological details on model parameterization.
Health-state transitions
Disease-free state
In the model, patients’ disease evolution starts in the DF health state, during which they receive either adjuvant treatment with nivolumab for up to 1 year or surveillance unless treatment is stopped due to recurrence or unacceptable toxicity. At each model cycle, patients can experience disease recurrence (either LR or DR), die, or remain in the DF health state. To inform the lifetime modeling of outcomes, extrapolation of survival data from CheckMate 274 trial data was needed. However, as the majority of recurrences occur within the first 2–3 years after RRCitation17,Citation20 and there is a possibility of clinical cure for patients with MIUC undergoing RR, patients who were DF until a prespecified timepoint were considered as curedCitation6,Citation21,Citation22. Beyond this timepoint, patients are no longer at risk of a recurrence event or disease-related mortality, and their survival can be characterized by general population mortality. Therefore, the actual length of the time horizon for which DFS extrapolations are needed was considerably shorter than the assumed lifetime of 30 years.
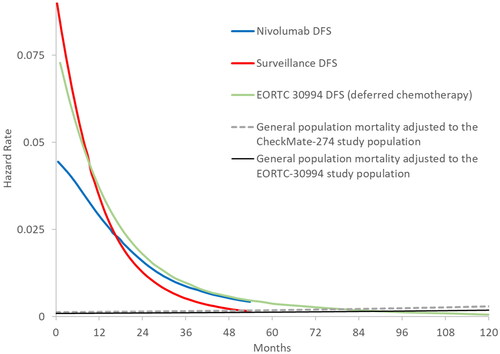
Identification of the cure timepoint for the model was based on clinical guidelines, published long-term DFS data, and clinical input. The National Comprehensive Cancer Network guidelines for bladder cancer (version 1.2022)Citation5 recommend monitoring patients for 5 years after RR if they have not experienced disease recurrence. Clinical input received confirmed this as standard practice, as risk of recurrence after 5 years would be considered very low. Monitoring for recurrence up to 5 years is also supported by the literature, where Cagiannos and MorashCitation20, in a review of patterns of recurrence for patients with muscle-invasive bladder cancer, reported that only 2–3% of patients relapsed between 5 and 10 years after RRCitation5. Further, published DFS data with median 7 years of follow-up from the EORTC 30994 trialCitation17, which investigated immediate versus deferred chemotherapy after radical cystectomy in patients with UC of the bladder, showed there was a very low risk of recurrence after 5 years in both arms of the study (). Finally, the smoothed hazards of DFS for both nivolumab and placebo showed convergence with mortality hazards of general population by 5 years (). Based on this evidence, 5 years of DF status was assumed to represent functional cure in the base case.
Figure 2. Smoothed hazard plots of CheckMate 274 DFS with EORTC 30994 (2015) DFS and general population mortality up to 10 years. Abbreviation. DFS, disease-free survival. General population mortality rates are US specific and adjusted according to baseline age and sex distributions in the studies.
In the model, the gap in the DFS data between the end of CheckMate 274 follow-up and the time of functional cure needed to be filled with survival extrapolations or external data. Following National Institute for Health and Care Excellence (NICE) methods guidanceCitation23,Citation24, standard parametric and spline-based survival models were fitted to CheckMate 274 data to estimate long-term DFS. However, these models either provided poor fits to the DFS Kaplan–Meier (KM) curves reported from CheckMate 274 or resulted in clinically implausible long-term predictions (see Supplementary Material B). Therefore, alternative approaches for extrapolation formally incorporating additional external evidenceCitation24,Citation25, were explored.
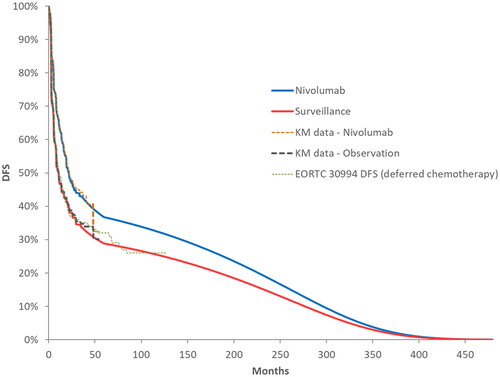
DFS KM curves from the control arms of CheckMate 274 and the EORTC 30994 study showed substantial closeness (), and smoothed DFS hazards were very similar between these two sources starting at year 3 (). Therefore, the observed DFS hazards from EORTC 30994 between years 3 and 5 were used to extend the DFS hazards from CheckMate 274 follow-up until functional cure at 5 years, making the DFS extrapolations distribution-free. In the base-case model setting, observed DFS data from CheckMate 274 were used to model DFS up to 3 years, followed by an adjustment using the DFS hazards from the deferred chemotherapy arm of EORTC 30994 for up to 5 yearsCitation17. The external hazard adjustment using data from EORTC 30994 between 3 and 5 years was applied for both surveillance and nivolumab DFS predictions, conservatively assuming no further treatment effect on DFS for nivolumab beyond the 3-year follow-up in CheckMate 274. In line with the functional cure assumption, the mortality trend of the patients who were DF at year 5 was assumed to follow that of the US general population with identical baseline age and sex distribution in the CheckMate 274 trial. In the model, functionally cured patients had no risk of disease recurrence and no excess mortality due to disease.
Figure 3. Reported DFS KM curves from the ITT population in CheckMate 274 and from the deferred chemotherapy arm of the EORTC-30994 trial, and long-term DFS extrapolations for nivolumab and placebo. Abbreviations. DFS, disease-free survival; ITT, intention to treat; KM, Kaplan–Meier.
Given that overall survival (OS) data from CheckMate 274 were still unavailable at the time of model development, DFS events could not be individually identified as LR, DR, or death in the data. However, the total numbers of LR, DR, and death events from the DFS data pooled across both study arms for the full study period (to database lock) were available. Therefore, to simplify the calculation of transition probabilities from the DF state, the proportion of the first recurrence events was assumed to be constant over time until the functional cure timepoint was reached. Transition probabilities from DF to each health state were calculated by splitting the total likelihood of departing the DF state using the relative fractions of LR, DR, and pre-recurrence death events over the entire follow-upCitation26. Potential impact of the constancy assumption of DFS events on the results was investigated through scenario analyses using external data to estimate the proportion of eventsCitation27.
Local recurrence state
Patients entering the LR state were assumed to receive subsequent surgery and radiotherapy, and to be at risk of experiencing DR or death. Survival and transition estimates from the LR health state were informed by the time to first subsequent event (DR or death) from LR data from CheckMate 274. Due to the limited number of patients in CheckMate 274 who experienced DR or death subsequent to LR, data from both arms of the study were pooled to increase the robustness of the survival analysis. Therefore, no treatment effect from adjuvant therapy with nivolumab was assumed for the frequency of events after LR.
Time to first subsequent event data from LR was extrapolated parametrically using the exponential distribution for the model base case (see Supplementary Material C for further details). Similar to assumptions made for the transitions from the DF state, the relative fraction of first subsequent events after LR was assumed to be constant over time and based on the total number of events reported during the entire trial follow-up. As mentioned in our companion paperCitation12, the possibility of functional cure for the LR patients could have been incorporated into the model in a similar fashion to the functional cure assumption applied for DF patients. However, external trial data on the frequency of DR and death events after LR, to our knowledge, are not common. There are only a few studies reporting survival outcomes for LR patients. Two of these studies report KM curves for survival after LR and one reports only median survival after LRCitation17,Citation27,Citation28. None of these studies report data on the breakdown of first subsequent events between DR and death, or had sufficient follow-up to support the functional cure of disease after LR. Therefore, cure was not assumed for the LR health state in the model.
Distant recurrence state
Patients entering the DR state were assumed to receive first-line (1 L) systemic therapies for the treatment of metastatic UC (mUC). The distribution of subsequent treatments for recurrent patients in the model was informed by CheckMate 274 data. The credibility and maturity of the subsequent treatment distribution in the trial for its reflection of the clinical practice in the US at the time of model development were verified by clinical experts. Alternative distributions of subsequent treatments based on real-world dataCitation29 were tested in a scenario analysis.
Given the lack of OS data from CheckMate 274 to inform transitions from the DR health state, external survival data for each treatment in the 1 L mUC setting were used as a proxy for survival after a DR event. In the base-case analysis, health-state occupancy for DR was based on estimation of DR survival and applied through a tunnel-state approach to ensure that the time of entering the health state could be tracked (see Teitsson et al.Citation12 for the rationale for this approach), and modeling of DR as an absorbing health state (applying one-off costs and outcomes at time of entry to the DR state) was explored via scenario analyses.
A published systematic literature review and indirect treatment comparison (ITC) were conducted to identify survival data (KM curves) and relative treatment effect between 1 L mUC treatments used in the DR stateCitation16. Given that the choice of treatment for 1 L mUC differs depending on patients’ cisplatin-eligibility and that immunotherapies are approved only for cisplatin-ineligible patients with programmed death ligand 1 (PD-L1)–positive status, separate ITCs were conducted for each patient subgroup with respect to their cisplatin eligibility and PD-L1 expression. For carboplatin plus gemcitabine and cisplatin plus gemcitabine combination therapies, the KM data for 1 L mUC survivalCitation15,Citation30 were extracted for each combination through digitization. Based on the digitized KM data, pseudo–patient-level data were constructedCitation31, which enabled parametric survival models to be fitted for each treatment to estimate long-term survival following NICE methods guidanceCitation23,Citation24. Modeling the survival of patients receiving immunotherapy treatments atezolizumab or pembrolizumab was based on hazard ratios estimated from an ITC, which were applied to the predicted long-term OS for carboplatin plus gemcitabine combination therapyCitation16. The resulting predicted survival was used to estimate health-state occupancy, and thus QALYs and LYs, by using a series of submodels for each individual 1 L mUC treatment. Using the outcomes per 1 L mUC treatment and the distribution of subsequent treatment from CheckMate 274 (Supplementary Material F), the overall weighted outcomes of subsequent treatments for the nivolumab and surveillance arms were estimated.
Dead state
The dead health state was modeled as absorbing and associated with no healthcare costs and health outcomes, and transitions to dead were estimated separately for each health state. In the DF health state, deaths were modeled on the basis of DFS extrapolation and the proportion of death events observed in CheckMate 274 until year 5, after which patients’ risk of dying was represented by age- and sex-matched, US-specific general population mortality. Similarly, in the LR health state, deaths were modeled indirectly using the extrapolated composite endpoint measuring time from LR to DR or death in CheckMate 274 and the proportion of death events observed prior to DR for patients in LR. For the DR health state, mortality was based on OS data for each subsequent 1 L mUC treatment.
Adverse events
Grade 3 or 4 treatment-emergent adverse events (AEs) with an incidence rate of ≥2% from CheckMate 274 were included in the model. However, costs of AEs were conservatively applied only to the nivolumab arm of the analysis (Supplementary Material D, Table D-1). AE costs were derived from International Classification of Diseases, Ninth Revision, Clinical Modification codes and estimated using US national inpatient sample data from the Healthcare Cost and Utilization Project for UC (Supplementary Material E). Utility decrements for each AE were sourced from published literature (Supplementary Material F).
Utilities
Patient-level EQ-5D-3L data from CheckMate 274 were used to estimate utility values associated with each state. Common health state values were used across both treatments as no clinically meaningful differences were observed between the treatment arms in CheckMate 274Citation32. To estimate mean values of EQ-5D-3L for each health state, linear mixed-effects repeated measures (MMRM) models with random intercepts were used to estimate the impact of recurrence on changes in EQ-5D-3L health utility scores from baseline. The MMRM models used the restricted maximum likelihood estimation method and included intercept as a random effect to account for the differences in intercept between patients. An unstructured covariance matrix was applied to obtain the random-effects variance components. The dependent variable for the MMRM models was change in EQ-5D-3L health utility values from baseline across all assessment visits. The least squares (LS) mean change scores were estimated for each health state based on each MMRM model. Regression coefficients for covariates included in the MMRM models and differences in LS mean changes between health states were also estimated and summarized. The estimated utility values per health state are provided in Supplementary Material F.
Resource use and costs
The model included costs of drug acquisition, drug administration, disease monitoring, subsequent treatment, and end-of-life care. The following sections present an overview of resources and costs considered in the model, while the estimates for the frequency of resource use and unit costs are provided in Supplementary Material E.
Time on adjuvant nivolumab treatment
The model uses the mean number of doses of nivolumab treatment reported from CheckMate 274 for calculations of drug acquisition, administration, and monitoring. Because of the trial-mandated 1-year cap on adjuvant treatment with nivolumab, all treatment-associated costs are accrued within the first year of the time horizon. Furthermore, at the time of database lock for CheckMate 274, the time-on-treatment data for nivolumab were almost fully mature. With the exception of one patient, the entire cohort either completed the course of treatment or discontinued. Therefore, extrapolation of time on treatment was not required, and the observed mean doses in the trial were used as a direct evidence of total treatment duration.
Drug acquisition, administration, and monitoring costs of nivolumab
The analysis included drug acquisition costs for nivolumab based on the biweekly 240-mg flat dosage received in CheckMate 274 and the cost of nivolumab obtained from RED BOOKCitation18. Unit costs for drug administration were derived from CMS dataCitation33, inflated to 2022 US dollars based on the consumer price index for medical care from the Bureau of Labor StatisticsCitation19,Citation34, and applied at the same rate as the treatment frequency. Monitoring costs reflected treatment-specific resource use such as laboratory evaluations and scans, which were required to ensure that patients tolerated treatment, and were applied every 4 weeks in the model. The unit cost of each resource use was derived from CMS dataCitation19,Citation33 and inflated to 2022 US dollars.
Health-state costs
In the model, disease management costs were health-state specific. They were calculated and incorporated into the model based on 4-week healthcare resource consumption and care needed by patients after RR, regardless of treatment. Given the curative intent of RRCitation5, in line with the functional cure assumption in the model, DF patients incurred disease management costs only until year 5, after which no further follow-up was required. Frequency of resource use (outpatient visits, monitoring tests, surgery, and terminal care) for the calculation of disease management cost was based on clinical expert input. Unit costs of each resource were obtained from CMS dataCitation19,Citation33, and inflated to 2022 US dollars. To account for the medical costs associated with end-of-life care, a one-off cost of terminal care was included in the modelCitation19. The cost of terminal care was sourced from the literatureCitation35, inflated to 2022 US dollars, and applied only to patients transitioning into the death health state in each model cycle.
Cost of subsequent treatment
For patients experiencing LR, a cost of subsequent surgery or subsequent radiotherapy was applied based on their respective rates observed in CheckMate 274.
Drug acquisition and administration costs associated with each 1 L mUC treatment were based on time-on-treatment data extracted from the publications of the pivotal trials identified in a systematic literature reviewCitation16. The proportion of patients receiving each subsequent treatment that was used to calculate the weighted cost of all subsequent treatment was calculated using the subsequent treatment shares observed in CheckMate 274.
Sensitivity analyses
Deterministic and probabilistic sensitivity analyses and scenario analyses were conducted to assess the impacts of uncertainty in model inputs, assumptions, chosen data, and structural choices on cost-effectiveness results.
In one-way deterministic sensitivity analyses, parameters were varied by their estimated or reported standard error where available, or ±20% of their base-case value when data suitable for calculating the standard error were not available, to generate the boundary high and low values around the point estimate of each parameter tested, except for annual discount rates, which were varied between 0 and 6%. For the probabilistic sensitivity analysis, parameters were simultaneously sampled from parametric distributions to generate estimates of the costs and health outcomes in each treatment arm. Parameter uncertainty was incorporated using normal, beta, and gamma distributions according to recommendations in the literatureCitation36 based on estimated or reported standard error, or ±10% of the parameter base-case value.
Scenario analyses
A secondary aim of this study was to examine the impact of alternative modeling approaches in cost-effectiveness of adjuvant nivolumabCitation12. Two scenario analyses were undertaken to quantify the impact of the modeling methodology on the results:
Merging LR and DR into a single, recurrent disease health state
Modeling costs and outcomes of subsequent treatments as one-off parameters, applied upon transition into the DR health state. This approach waives the need for tunnel states to track the time spent in DR state.
In addition to scenarios testing these methodological assumptions, scenario analyses were conducted to investigate the impact of alternative data assumptions for the analysis. These included linear decline in the proportion of recurrence events being a DFS event from year 1 to 5, time from LR to DR or death modeled with log-normal distribution (statistically best-fitting distribution and requiring time-varying hazards to be modeled via tunnel states), DFS cure timepoint assumption, and proportion of subsequent treatments based on real-world evidence.
Results
The results of the base-case analysis showed that adjuvant nivolumab therapy was associated with a 1.53-LY increase compared with surveillance (total LYs: 9.13 vs. 7.60). This difference was mostly because of the superior DFS profile of nivolumab, which either reduced or postponed recurrence and death events compared with surveillance (). A large proportion of total LYs were accrued in the DF health state for both nivolumab (86%) and surveillance (82%), and mean DFS was 1.64 LYs greater with nivolumab treatment compared with surveillance (7.88 vs. 6.24). Total QALYs were 5.9 for adjuvant nivolumab and 4.96 for surveillance, resulting in an incremental gain of 0.94 QALYs.
Table 1. Base-case results (costs and health outcomes, discounted).
Total costs and treatment-related costs were higher for adjuvant nivolumab than surveillance, but cost offsets were observed related to delays in recurrences and deaths (). The estimated total costs were $162 268 and $62 965 for adjuvant nivolumab and surveillance, respectively. Combined with the incremental gains in LYs and QALYs, the estimated incremental cost per LY gained (ICER) was $64 929, and incremental cost per QALY gained (ICUR) was $105 660 for adjuvant nivolumab versus surveillance.
Sensitivity analyses
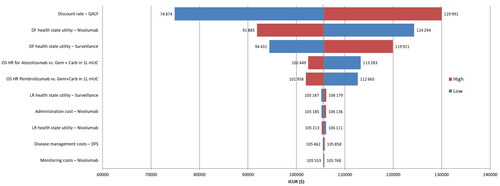
The tornado diagram summarizing the results of one-way deterministic sensitivity analyses for the 10 most influential parameters on the ICURs is shown in . Among all parameters, the discount rate used for QALYs had the largest impact on the results (29% decrease in ICUR with 0% discount rate and 23% increase in ICUR with 6% discount rate) followed by the utility value for the DFS health state. The remaining parameters that were changed in the one-way deterministic sensitivity analysis resulted in only marginal changes in ICUR (less than 1%).
Figure 4. Summary of one-way deterministic sensitivity analysis with respect to 10 most influential parameters of the model. Abbreviations. 1 L, first line; Carb, carboplatin; DF, disease free; DFS, disease-free survival; Gem, gemcitabine; ICUR, incremental cost-utility ratio; HR, hazard ratio; OS, overall survival; QALY, quality-adjusted life-year. aRange tested 0–6%; brange tested based on reported or estimated standard error; crange tested based on estimated ±20% base-case value.
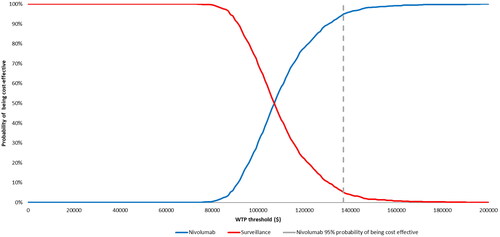
The cost-effectiveness acceptability curve obtained from the probabilistic sensitivity analysis is presented in . The sample average cost per QALY across all simulations in the probabilistic sensitivity analysis of $107,275 was similar to that in the base-case ICUR. The probabilistic sensitivity analysis confirmed the robustness of the model results, with nivolumab having 98% probability of being cost-effective at willingness-to-pay thresholds of $150,000 per QALYCitation13.
Figure 5. Cost-effectiveness acceptability curve. Abbreviation. WTP, willingness to pay.
Scenario analyses
As can be seen in , the majority of alternative scenarios tested had a limited impact on the results. The scenarios with the largest impact on ICUR were the three–health-state model scenario (ICUR, $95 709) and the scenario utilizing real-world evidence to inform distributions of subsequent treatments (ICUR, $133 854).
Table 2. Results from scenario analyses.
Discussion
This study investigated the cost-effectiveness of adjuvant nivolumab compared with surveillance in patients with high-risk MIUC after RR from a US perspective. The findings suggest that adjuvant nivolumab is a cost-effective treatment in patients with MIUC with a threshold of $150,000 per QALY and an estimated ICUR of $105 660 compared with surveillance. The probabilistic sensitivity analysis showed that nivolumab would have a 98% probability of being cost-effective at willingness-to-pay thresholds of $150,000 per QALY. Although adjuvant treatment with nivolumab increases the patient’s overall cost to the payer over a course of a lifetime compared with surveillance, it also leads to substantial improvement in DFS with a corresponding 1.64 LYs extension.
The current analysis also explored the alternative modeling options and examined the structural uncertainty in the ICURs due to methodology followed in the development phase of this economic modelCitation12. One of the key considerations for the model structure was the differentiation of LR and DR. By merging LR and DR into a single recurrent disease state, the model would take the conventional three-state structure, which is commonly employed in the cost-effectiveness assessments of oncological interventions. By splitting the recurrence state into LR and DR states, the resulting four-state structure better represented the nuances in the natural clinical progression of MIUCCitation17,Citation27,Citation28. However, the current analysis showed that differentiation of recurrences in the model as LR and DR did not have a major impact on the ICURs and the conclusion that nivolumab is a cost-effective adjuvant treatment option for high-risk MIUC.
A second key structural component of the model that was assessed in different forms was the estimation of costs and health outcomes of subsequent treatments with or without tunnel states. As shown in the scenario analysis results, modeling the DR as an absorbing state with one-off costs and health outcomes had almost identical ICUR as the base case that used tunnel states.
Strengths and limitations
As with all model analyses, the current analysis includes strengths and limitations. One of the key strengths of the current analysis is that the CheckMate 274 trial provides head-to-head data for comparison with surveillance and EQ-5D data to inform health-state utility values. Data on time on treatment for nivolumab from CheckMate 274 were almost fully mature at the time of model development, which limits uncertainty around nivolumab-related costs on the model results. With incorporation of external data from the EORTC 30994 trial to extrapolate DFS beyond the CheckMate 274 trial data and a conservative assumption that nivolumab follows the same long-term hazard as control until the cure timepoint, the uncertainty of long-term extrapolation was reduced.
A further strength of the analysis is that the modeling of subsequent treatment received in DR not only accounts for treatment costs but also survival, which makes the model capable of predicting post-DR survival for the individual subsequent treatment. The model is thereby flexible in that it will be able to incorporate future updates in 1 L mUC treatment options for patients in a rapidly changing treatment landscape. Similarly, modeling subsequent therapy based on tunnel states allows for alternative survival distributions to be tested and to account for time dependency of survival from the time of entering the health state.
Finally, a key strength of the current analysis was the exploration of the uncertainty in the results with respect to parameters through sensitivity and scenario analyses and with respect to changes in the structural features of the model.
A limitation of the current analysis is that data related to long-term survival from CheckMate 274 were not fully mature at time of model development. OS data were still unavailable at the time of this analysis, which required assumptions to be made around modeling of post recurrence survival. Similarly, long-term data were not available for post-LR and post-DR survival for patients with MIUC who have undergone RR. The data on time to subsequent event from DR from CheckMate 274 were immature, and thus data from the literature for the 1 L mUC setting were used as a proxy for post-DR survival in our model. By using survival data from the 1 L mUC literature as a proxy for survival in the DR state, it was not possible to account for the impact of prior RR and prior exposure to adjuvant treatment on the survival beyond DR. However, when longer-term follow-up data from CheckMate 274 become available, the model can be updated to validate the outcome of the current analysis.
Conclusion
To the knowledge of the authors, this is the first study quantifying the economic value of an adjuvant systemic treatment of MIUC versus RR followed by surveillance. The results of this analysis suggest that from a US healthcare perspective, adjuvant nivolumab is a cost-effective treatment option, with a willingness-to-pay threshold of $150,000 per QALY compared with surveillance in patients with high-risk MIUC after RR. The results of the analysis were robust to both changes in data and structural assumptions used in the model. Although 86% and 82% of total LYs were accrued in the DF health state for nivolumab and surveillance, respectively, modeling based on interim outcomes such as DFS, when data on OS are still not available, will always involve some uncertainty. Thus, future analyses should be conducted to investigate the predictive ability of the current structural and data assumptions with more mature data when available. Such analyses providing comparison and validation of the predictions from the four-state Markov model are thus left as a future research direction when the OS data from the trial become available.
Transparency
Author contributions
All authors contributed to the study design. ST, FK, and THB performed the analysis. ST and THB developed the first draft of the manuscript. All authors reviewed and contributed critical revisions to the manuscript. All authors agree to be held accountable for the manuscript content and approve the final version for publication.
Reviewer disclosures
Peer reviewers on this manuscript have no relevant financial or other relationships to disclose.
Previous presentation
A version of this analysis was previously presented at Virtual ISPOR, May 15–18, 2022.
Supplemental Material
Download MS Word (1.1 MB)Acknowledgements
Bristol Myers Squibb (Princeton, NJ, USA) and Ono Pharmaceutical Company Ltd. (Osaka, Japan). Editorial assistance was provided by Parexel, funded by Bristol Myers Squibb.
Declaration of financial/other interests
ST, MK, and MYP are employees of Bristol Myers Squibb (BMS); TP was an employee of BMS at the time of the study. THB, CK, and FK are employees of RTI Health Solutions, which received payment from Bristol Myers Squibb for contracted analyses. SP received personal payment from Bristol Myers Squibb for attendance at an advisory board meeting.
Data availability statement
Data are available upon reasonable request. Bristol Myers Squibb’s policy on data sharing may be found online at https://www.bms.com/researchers-and-partners/independent-research/data-sharing-request-process.html.
Correction Statement
This article was originally published with errors, which have now been corrected in the online version. Please see Correction (http://dx.doi.org/10.1080/13696998.2024.2363099)
Additional information
Funding
References
- Siegel RL, Miller KD, Fuchs HE, et al. Cancer statistics, 2022. CA Cancer J Clin. 2022;72(1):7–33. doi: 10.3322/caac.21708.
- Mossanen M, Gore JL. The burden of bladder cancer care: direct and indirect costs. Curr Opin Urol. 2014;24(5):487–491. doi: 10.1097/MOU.0000000000000078.
- Aly A, Johnson C, Doleh Y, et al. The real-world lifetime economic burden of urothelial carcinoma by stage at diagnosis. J Clin Pathw. 2020;6(4):51–60.
- Saginala K, Barsouk A, Aluru JS, et al. Epidemiology of bladder cancer. Med Sci. 2020;8(1):15. doi: 10.3390/medsci8010015.
- NCCN. NCCN clinical practice guidelines in oncology (NCCN guidelines) for bladder cancer. National Comprehensive Cancer Network; V.1; 2020. Available from: http://www.nccn.org/professionals/physician_gls/f_guidelines.asp.
- Witjes JA, Bruins HM, Cathomas R, et al. European Association of Urology guidelines on muscle-invasive and metastatic bladder cancer: summary of the 2020 guidelines. Eur Urol. 2021;79(1):82–104. doi: 10.1016/j.eururo.2020.03.055.
- Rouprêt M, Babjuk M, Burger M, et al. European Association of Urology guidelines on upper urinary tract urothelial carcinoma: 2020 update. Eur Urol. 2021;79(1):62–79. doi: 10.1016/j.eururo.2020.05.042.
- US Food and Drug Administration. FDA approves nivolumab for adjuvant treatment of urothelial carcinoma; 2021 [cited 2022 June]. Available from: https://www.fda.gov/drugs/resources-information-approved-drugs/fda-approves-nivolumab-adjuvant-treatment-urothelial-carcinoma.
- Bajorin DF, Witjes JA, Gschwend JE, et al. Adjuvant nivolumab versus placebo in muscle-invasive urothelial carcinoma. N Engl J Med. 2021;384(22):2102–2114. doi: 10.1056/NEJMoa2034442.
- Schnipper LE, Davidson NE, Wollins DS, et al. Updating the American Society of Clinical Oncology value framework: revisions and reflections in response to comments received. J Clin Oncol. 2016;34(24):2925–2934. doi: 10.1200/JCO.2016.68.2518.
- Dubois RW, Westrich K. As value assessment frameworks evolve, are they finally ready for prime time? Value Health. 2019;22(9):977–980. doi: 10.1016/j.jval.2019.06.002.
- Teitsson S, Brodtkorb T-H, Kurt M, et al. Challenges, considerations, and approaches for developing a cost-effectiveness model for the adjuvant treatment of muscle-invasive urothelial carcinoma: with a spotlight on nivolumab versus placebo. J Med Econ. 2024. doi: 10.1080/13696998.2024.2322394.
- Institute for Clinical Economic Review. ICER’s reference case for economic evaluations: principles and rationale; 2020 [cited 2023 Sep 29. Available from: https://icer.org/wp-content/uploads/2020/10/ICER_Reference_Case_013120.pdf.
- Surveillance, Epidemiology, and End Results (SEER). Cancer of the urinary bladder – cancer stat facts [cited 2023 Sep 29]. Available from: https://seer.cancer.gov/statfacts/html/urinb.html.
- Bellmunt J, von der Maase H, Mead GM, et al. Randomized phase III study comparing paclitaxel/cisplatin/gemcitabine and gemcitabine/cisplatin in patients with locally advanced or metastatic urothelial cancer without prior systemic therapy: EORTC intergroup study 30987. J Clin Oncol. 2012;30(10):1107–1113. doi: 10.1200/JCO.2011.38.6979.
- Jevdjevic M, Nickel K, Teitsson S, et al. CO153 survival analyses and indirect treatment comparisons (ITCS) in first-line metastatic urothelial carcinoma (1L MUC). Value Health. 2022;25(7):S333. doi: 10.1016/j.jval.2022.04.246.
- Sternberg CN, Skoneczna I, Kerst JM, et al. Immediate versus deferred chemotherapy after radical cystectomy in patients with pT3-pT4 or N + M0 urothelial carcinoma of the bladder (EORTC 30994): an intergroup, open-label, randomised phase 3 trial. Lancet Oncol. 2015;16(1):76–86. doi: 10.1016/S1470-2045(14)71160-X.
- IBM Watson Health. Micromedex RED BOOK (electronic version). Available from: https://www.micromedexsolutions.com/.
- Centers for Medicare and Medicaid Services. Cost reports; 2023 [cited 2023 Mar 21]. https://www.cms.gov/Research-Statistics-Data-and-Systems/Downloadable-Public-Use-Files/Cost-Reports.
- Cagiannos I, Morash C. Surveillance strategies after definitive therapy of invasive bladder cancer. Can Urol Assoc J. 2009;3(6 suppl 4):S237–S242. doi: 10.5489/cuaj.1205.
- Karakiewicz PI, Palapattu GS, Lotan Y, et al. Outcomes of radical cystectomy for transitional cell carcinoma of the bladder: a contemporary series from the Bladder Cancer Research Consortium. J Urol. 2006;176(6 Pt 1):2414–2422; discussion 2422. doi: 10.1016/j.juro.2006.08.004.
- Sternberg CN, Bellmunt J, Sonpavde G, et al. ICUD-EAU international consultation on bladder cancer 2012: chemotherapy for urothelial carcinoma—neoadjuvant and adjuvant settings. Eur Urol. 2013;63(1):58–66. doi: 10.1016/j.eururo.2012.08.010.
- Latimer NR. Survival analysis for economic evaluations alongside clinical trials–extrapolation with patient-level data: inconsistencies, limitations, and a practical guide. Med Decis Making. 2013;33(6):743–754. doi: 10.1177/0272989X12472398.
- Rutherford MJ, Lambert PC, National Institute for Health and Care Excellence Decision Support Unit., et al. NICE DSU technical support document 21: flexible methods for survival analysis. Decision Support Unit, University of Sheffield; 2020, 21. Available from: http://www.nicedsu.org.uk.
- Jackson C, Stevens J, Ren S, et al. Extrapolating survival from randomized trials using external data: a review of methods. Med Decis Making. 2017;37(4):377–390. doi: 10.1177/0272989X16639900.
- Galsky MD, Witjes JA, Gschwend JE, et al. Disease-free survival with longer follow-up from the phase 3 CheckMate 274 trial of adjuvant nivolumab in patients who underwent surgery for high-risk muscle-invasive urothelial carcinoma. Society for Urologic Oncology 22nd Annual Meeting, Orlando, FL, USA; 2021.
- Mitra AP, Quinn DI, Dorff TB, et al. Factors influencing post-recurrence survival in bladder cancer following radical cystectomy. BJU Int. 2012;109(6):846–854. doi: 10.1111/j.1464-410X.2011.10455.x.
- Ozbir S, Girgin C, Kara C, et al. Local and systemic recurrence patterns of urothelial cancer after radical cystectomy. Kaohsiung J Med Sci. 2014;30(10):504–509. doi: 10.1016/j.kjms.2014.03.011.
- Geynisman DM, Broughton E, Hao Y, et al. Real-world treatment patterns and clinical outcomes among patients with advanced urothelial carcinoma in the United States. Urol Oncol. 2022;40(5):195 e191–195 e111.
- De Santis M, Bellmunt J, Mead G, et al. Randomized phase II/III trial assessing gemcitabine/carboplatin and methotrexate/carboplatin/vinblastine in patients with advanced urothelial cancer who are unfit for cisplatin-based chemotherapy: EORTC study 30986. J Clin Oncol. 2012;30(2):191–199. doi: 10.1200/JCO.2011.37.3571.
- Guyot P, Ades AE, Ouwens MJ, et al. Enhanced secondary analysis of survival data: reconstructing the data from published Kaplan–Meier survival curves. BMC Med Res Methodol. 2012;12(1):9. doi: 10.1186/1471-2288-12-9.
- Witjes JA, Galsky MD, Gschwend JE, et al. Health-related quality of life with adjuvant nivolumab after radical resection for high-risk muscle-invasive urothelial carcinoma: results from the phase 3 CheckMate 274 trial. Eur Urol Oncol. 2022;5(5):553–563. doi: 10.1016/j.euo.2022.02.003.
- Centers for Medicare and Medicaid Services. Physician fee schedule; 2023 [cited 2023 Mar 21]. https://www.cms.gov/medicare/physician-fee-schedule/search.
- Bureau of Labor Statistics. U.S. city average; item: medical care; base period: 1982–84 = 100. Not Seasonally Adjusted; February 2023 [cited 2023 Mar 21]. Available from: http://data.bls.gov/cgi-bin/surveymost?cu.
- Perrin A, Sherman S, Pal S, et al. Lifetime cost of everolimus vs. axitinib in patients with advanced renal cell carcinoma who failed prior sunitinib therapy in the US. J Med Econ. 2015;18(3):200–209. doi: 10.3111/13696998.2014.985789.
- Briggs A, Claxton K, Sculpher MJ. Modelling methods for health economic evaluation. Oxford: Oxford University Press; 2006.