
Abstract
Aims
The increasing prevalence of end-stage renal disease (ESRD) in the United States (US) represents a considerable economic burden due to the high cost of dialysis treatment. This review examines data from real-world studies to identify cost drivers and explore areas where dialysis costs could be reduced.
Methods
We identified and synthesized evidence published from 2016-2023 reporting direct dialysis costs in adult US patients from a comprehensive literature search of MEDLINE, Embase, and grey literature sources (e.g. US Renal Data System reports).
Results
Most identified data related to Medicare expenditures. Overall Medicare spending in 2020 was $29B for hemodialysis and $2.8B for peritoneal dialysis (PD). Dialysis costs accounted for almost 80% of total Medicare expenditures on ESRD beneficiaries. Private insurance payers consistently pay more for dialysis; for example, per person per month spending by private insurers on outpatient dialysis was estimated at $10,149 compared with Medicare spending of $3,364. Dialysis costs were higher in specific high-risk patient groups (e.g. type 2 diabetes, hepatitis C). Spending on hemodialysis was higher than on PD, but the gap in spending between PD and hemodialysis is closing. Vascular access costs accounted for a substantial proportion of dialysis costs.
Limitations
Insufficient detail in the identified studies, especially related to outpatient costs, limits opportunities to identify key drivers. Differences between the studies in methods of measuring dialysis costs make generalization of these results difficult.
Conclusions
These findings indicate that prevention of or delay in progression to ESRD could have considerable cost savings for Medicare and private payers, particularly in patients with high-risk conditions such as type 2 diabetes. More efficient use of resources is needed, including low-cost medication, to improve clinical outcomes and lower overall costs, especially in high-risk groups. Widening access to PD where it is safe and appropriate may help to reduce dialysis costs.
PLAIN LANGUAGE SUMMARY
Previous papers have studied the cost of treating patients who need dialysis for kidney failure. We reviewed these costs and looked for patterns. Dialysis was the most expensive part of treatment for people with kidney disease who have Medicare. Dialysis with private insurance was much more expensive than with Medicare. People with diabetes experienced higher costs of dialysis than those without diabetes. Dialysis in a hospital costs more than dialysis at home. There are opportunities to reduce the cost of dialysis that should be explored further, such as more use of low-cost medication that can prevent the worsening of kidney disease and reduce the need for dialysis.
Introduction
Chronic kidney disease (CKD) affects an estimated 35.5 million AmericansCitation1. The number of individuals with end-stage renal disease (ESRD) reached 807,920 in 2020Citation2, while the prevalence of ESRD increased by 107% from 2000 to 2019Citation2. Although transplantation is the most effective treatment for ESRD, demand exceeds supply such that almost 70% of individuals with ESRD are treated with dialysis rather than a kidney transplant. Of the 2 main types of dialysis, hemodialysis may be performed in the hospital, in a dialysis facility, or at home, whereas peritoneal dialysis (PD) is typically performed at home; each modality is associated with different costs.
The financial cost of dialysis has increased steadily over recent years, despite the availability of new drug therapies for stage 3-4 CKD associated with type 2 diabetes (T2D), such as mineralocorticoid receptor antagonists. In 2020, dialysis-specific costs for Medicare Fee-for-Service (FFS) beneficiaries receiving maintenance dialysis stood at $9.9B, accounting for almost 80% of total expenditures for this populationCitation2. Notwithstanding a decrease in Medicare spending on ESRD in 2020, thought to be due to a COVID-related fall in the number of ESRD patients, adjusted dialysis-related costs increased by $3B from 2010-2020. However, related costs for laboratory, radiology, pharmacy, injectables, and ambulance services for ESRD patients remained the same or increased by small amountsCitation2. These categories of Medicare spending, as reported by the United States Renal Data System (USRDS), are described for ESRD patients but without clear differentiation between dialysis-related costs and other costs.
Factors that contribute to overall dialysis costs may include type of dialysis, choice of vascular access, vascular access complications, healthcare personnel cost, dialysis set-up cost, drug costs, and costs to patients and caregivers. To address this broad topic, a scoping review design was considered appropriate for the purpose of analyzing the extent to which published data from the medical literature, as well as non-research sources, such as policy documents, can explain the reasons for increases in dialysis costs. The objective of this literature review was to identify key cost drivers in the provision of dialysis treatment for adults in the US, characterize any knowledge gaps in this area, and explore potential areas for cost reduction.
Methods
We conducted a comprehensive literature search using MEDLINE and Embase to identify studies that reported direct costs of dialysis in US adult patients. To capture the most up-to-date evidence, the search was limited to studies published from 2016-2023. We did not produce a full protocol for the review, but all eligibility criteria and search strategies were decided a priori. Details of the search strategy are provided in Supplementary Table 1. There were no restrictions on the search in terms of interventions or comparators; any study reporting direct costs of dialysis treatment for adults in the US was eligible for inclusion. Eligible study designs were: observational studies; any type of economic evaluation (including cost-benefit analysis, cost-minimization analysis, cost-effectiveness analysis, cost-utility analysis, budget impact models); and systematic literature reviews and/or meta-analyses. In addition to bibliographic databases, we searched the USRDS for data not published in peer-reviewed literature.
Search results were screened by one member of the author team (either FS or KK), and all publications that met the inclusion criteria were selected for inclusion in the scoping review. All cost data from the included studies were extracted into tables according to categories that emerged during the screening and selection of studies for inclusion. Any data related to direct costs of dialysis were included; we did not include data on indirect costs such as productivity loss or transportation. Data were summarized narratively within these categories.
This study was not submitted for institutional review board approval since it is based entirely on secondary, unidentifiable data and therefore is not required to comply with human subject protection and consent requirements.
Results
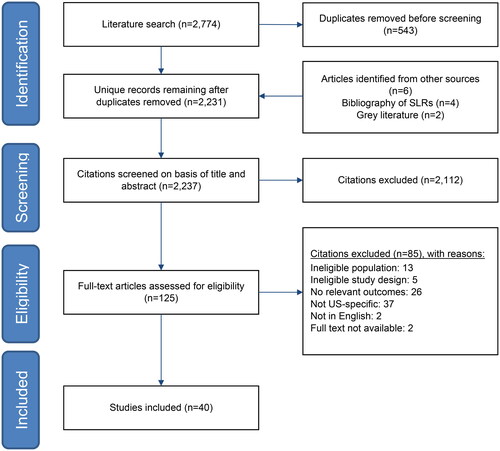
The bibliographic database searches identified 2,237 records, of which 125 were reviewed in full-text format, and 40 were included in the review (). Full details of the identified studies are in Supplementary Table 2. Types of cost data reported in the literature are heterogeneous and include: total annual Medicare expenditures for prevalent dialysis patientsCitation2; total dialysis costs for incident ESRD patientsCitation3; spending on emergency department (ED) visits related to hemodialysisCitation4,Citation5 and emergency dialysis for undocumented immigrantsCitation6–8; costs related to dialysis patients with diabetesCitation9,Citation10, with and without hepatitis C infectionCitation11, or undergoing hip arthroplastyCitation12 or parathyroidectomyCitation13; and comparisons between Medicare spending on dialysis and spending by private insurersCitation14–16 and between hemodialysis and PDCitation17–20.
Figure 1. PRISMA flow diagram.
Key: PRISMA = preferred reporting items for systematic reviews and meta-analyses.
Variation in dialysis costs according to payer
US residents of any age who meet certain work credit requirements are eligible for Medicare coverage for kidney dialysis; however, coverage does not begin until the fourth month of dialysis treatment, which means that payment for initiating dialysis must be covered either by private insurance or by self-payment. For patients who have private insurance, Medicare automatically becomes the primary payer after the first 30 months of dialysis treatment, but those first 30 months are paid for by private insuranceCitation21. Since 2011, the bundled ESRD Prospective Payment System (PPS) has been in effect, which stipulates that Medicare FFS payments be made on a consolidated per-treatment basis, (including drugs, laboratory services, supplies, and capital-related costs for maintenance dialysis) rather than billing separately for all the services associated with dialysis.
Published studies reveal differences between Medicare and private payers of dialysis. In period-prevalent ESRD patients with ≥1 Medicare claim in 2020, total Medicare expenditures were $29.0B and $2.7B for hemodialysis and PD, respectivelyCitation2. Medicare spending on dialysis increased from under $86,000 per person per year (PPPY) in 2009 to almost $94,000 in 2019Citation2. Commercial insurance companies’ expenditures on dialysis are consistently higher (). The median price paid by private insurers for a single dialysis session from 2012-2019 was $1,476 compared with the Medicare base price of $240Citation14. Per person per month (PPPM) spending by private payers on outpatient dialysis was estimated at $9,679Citation15 to $10,149Citation16 in 2015–2016Citation15 compared with Medicare PPPM spending of $3,364Citation16.
Table 1. Differences in spending on dialysis between FFS medicare and private insurance.
Dialysis spending by Medicare Advantage (MA) also tends to be higher than traditional Medicare spending. The median MA payment for a hemodialysis treatment was $300, 29% higher than the Medicare FFS payment that would be made under the bundled ESRD PPSCitation24.
Comparing the costs of dialysis-related ED visits between insured and uninsured patients reveals higher costs for insured patients. The mean cost of an ED visit for an acute hemodialysis indication in Texas in 2017 was $3,239/insured patient compared to $2,102/uninsured patientCitation4. while the national US average for an ED visit related to hemodialysis was $10,986/insured patient and $5,992/uninsured patientCitation5.
ii. Dialysis costs associated with other diseases
Dialysis costs are greater in patients with high-risk comorbidities. With respect to different causes of ESRD, PPPY dialysis spending in 2019 was $98,397 for diabetes-related ESRD, which was higher than dialysis spending on ESRD caused by hypertension ($87,697), glomerulonephritis ($86,086), cystic kidney disease ($81,638), or other urologic causes ($84,041). Annual medical costs for patients with diabetes receiving dialysis were double that of dialysis patients without diabetes ($24,450 and $12,082, respectively)Citation25. In an analysis of 8 states, total excess annual Medicaid spending on dialysis as a complication of diabetes (type 1 or 2) ranged from $2,523,969 (Iowa) to $115,704,560 (California), with the PPPY excess spending ranging from $23,569 (New York) to $51,470 (Connecticut) ()Citation9. The same study reported a mean ratio ranging from 2.3 (New York) to 4.1 (California) for PPPY spending on dialysis as a complication of diabetes compared to people with diabetes and no complicationsCitation9. PPPM spending in 2019 for the first 4 months of dialysis for people with T2D was estimated at $87,538, based on Optum Clinformatics claims data, compared to Medicare PPPM spending of $8,763 (regardless of diabetes status)Citation23.
Figure 2. PPPY Medicaid excess spending in diabetes-related hemodialysis across 8 states, 2008-2012 [Citation9].
Key: PPPY = per person per year.
![Figure 2. PPPY Medicaid excess spending in diabetes-related hemodialysis across 8 states, 2008-2012 [Citation9].Key: PPPY = per person per year.](/cms/asset/345e95a1-d4cc-4f3d-94be-1e6f82ffb255/ijme_a_2342210_f0002_c.jpg)
Regarding the impact of other diseases on the medical costs of dialysis, increased costs were reported for dialysis patients with pneumonia or hyperkalemiaCitation26–28. The cost of hip arthroplasty was higher for dialysis patients compared to nondialysis patients ($96,825 vs $66,859; p < 0.001)Citation12. There was a reduction in outpatient and prescription costs for dialysis patients after undergoing parathyroidectomy, but all other costs (including inpatient and physician costs) were over $25,000 higher compared to before parathyroidectomyCitation13. PPPY Medicare spending on dialysis patients with hepatitis C infection was approximately 20% higher on inpatient and outpatient costs compared with spending for dialysis patients without hepatitis C infectionCitation11. Mean PPPY Medicare expenditures for nonfrail and frail patients (measured with Fried frailty phenotype criteria) receiving dialysis were similar; the mean (95% CI) difference in expenditures was −7.0% (−14.9% to 1.7%)Citation29.
iii. Costs by dialysis modality
In studies comparing the costs of hemodialysis and PD, hemodialysis was consistently more expensive. PPPY Medicare spending in 2020 was $95,932 for hemodialysis and $81,525 for PDCitation2. In 2020, total Medicare spending on dialysis (excluding vascular access costs) was distributed as follows: $12.6B for outpatient hemodialysis, $8.8B for outpatient PD, $57 M for inpatient dialysis, and $2 M for home dialysisCitation2. While spending on PD remained lower than spending on hemodialysis between 2010 and 2020, the difference between the 2 modalities has narrowed; in 2010, costs for PD beneficiaries were 23% lower than for hemodialysis beneficiaries, whereas in 2020, PD costs were only 15% lower than hemodialysisCitation2. This may be partly explained by the decrease from 2010-2020 in prevalent ESRD beneficiaries receiving hemodialysis (64%-60%) and the increase in those receiving PD (6%-8%).
During 2008-2015, Medicare spending was higher for hemodialysis than for PD in terms of overall expenditures (11% higher), intravenous drugs (69% higher), dialysis access (12% higher), and rehabilitation costs (35% higher)Citation17. Another study investigating conversions from PD to hemodialysis during 2001-2017 found that 55% of Medicare beneficiaries discontinued PD and converted to hemodialysis, with an increase in total monthly costs from $4,597 PPPM at 12 months pre-conversion to $6,846 post-conversion. The cost of care for the final month pre-conversion and the first month post-conversion was $20,701 PPPM and $13,302 PPPM, respectivelyCitation18.
iv. Vascular access costs
Total annual Medicare expenditures on vascular access (including inpatient admissions, anesthesia, diagnostic imaging, and surgery) were estimated at approximately $2.8B in 2013Citation30 and $399 M for dialysis circuit maintenance procedures in 2018Citation31. In 2020, vascular access accounted for $531 M of Medicare spending on dialysis, and PPPY Medicare spending was $1,292Citation2.
Physician payments reported by specialty could not be compared between studies because different units of measure were employed. In 1 study, mean unadjusted payments per patency-year by physician specialty affiliation (cost source: Centers for Medicare & Medicaid Services, 2013-2014) were $174,000, $89,000, and $71,000 for surgeons, nephrologists, and radiologists, respectivelyCitation32. Results from another study included mean per-procedure payments for arteriovenous fistula (AVF) and arteriovenous graft (AVG) maintenance procedures for 2018 (cost source: Medicare) of $851, $1,163, and $776 for radiology, nephrology, and surgery, respectivelyCitation31.
Results of studies comparing AVF and AVG procedures indicated that AVG may have higher initial costs, mainly due to supply costs, but over time the costs associated with access procedures and complications were lower with AVF than with AVGCitation3,Citation33,Citation34. Likewise, the cost of a central venous catheter (CVC) was lower than that of AVGCitation33. However, in 1 study, the cost of CVC was found to be similar to or less than AVFCitation33, and the reverse was found in another studyCitation35. A failed AVF was twice the cost of a successful AVFCitation35. In 1 study that stratified patients according to the timing of AVF creation relative to when hemodialysis was started, the cost of primary patency loss at two-and-a-half years was approximately double the cost of AVFs that maintained primary patency in patients who initiated hemodialysis either with a mature AVF or with CVC without AVF at dialysis initiationCitation30.
Rates of hospitalization for vascular access complications with home hemodialysis and for catheter complications for PD patients decreased in the past decade, but Medicare spending on vascular access increased during the same time periodCitation2.
v. Medical costs
When comparing overall medical costs (hospitalization, office, and ED visits) in the 12 months before and after initiating hemodialysis, all-cause mean medical costs were $45,145 and $48,713 for pre- and post-hemodialysis, respectivelyCitation36. Another study found that after specific dialysis costs, nondialysis outpatient costs were the biggest driver of the difference in spending between pre-dialysis and post-dialysis initiation; the adjusted difference from before and after the first dialysis session was $1,847 PPPMCitation15.
Regarding outpatient costs for all ESRD patients (i.e. those receiving dialysis or not), 78% of those costs were attributed to outpatient dialysis. Total Medicare spending on outpatient costs for all dialysis in 2020 was $9.9B (equivalent to $37,817 PPPY)Citation2.
Discussion
The evidence presented here suggests that key drivers of dialysis costs in the US include higher fees charged by private providers of dialysis, vascular access management costs, outpatient costs, and costs associated with comorbidities. However, there is considerable uncertainty around what the true cost drivers are, and where costs could be reduced, since the published literature does not report costs consistently and in a manner suitable for comparison across studies. Total dialysis costs per person per year was the most common way to report costs in the studies identified by our review. While some studies reported total costs and subcategories of costs for specific populations, such as dialysis patients undergoing parathyroidectomyCitation13, our review highlights an important knowledge gap. Studies reporting a full breakdown of different types of costs, such as inpatient, outpatient, medical supplies, and prescription costs for incident and prevalent dialysis patients, would help to identify cost drivers with greater certainty.
While dialysis costs represent a considerable proportion of all Medicare expenditures for ESRD patients in the United States, the prices paid by private payers for dialysis are substantially higher than those paid by Medicare. The fact that there is a delay between starting dialysis treatment and when Medicare coverage takes effect means that private payers fill this gap, which appears to lead to dialysis providers charging higher fees. Since 36% of incident ESRD patients have non-Medicare coverageCitation2, this translates to payers incurring higher costs for a large proportion of new ESRD cases. Reducing the current 30-month delay for privately insured individuals to claim Medicare coverage for dialysis could be a potential area for cost reduction whereby dialysis providers have fewer opportunities to charge disproportionately high fees to payers. However, clarity about the costs of separate components of dialysis treatment would still be advantageous to avoid excessive total costs.
Because diabetes is a leading cause of CKDCitation1, and higher dialysis costs have been observed for patients who have diabetes and ESRDCitation9,Citation25, there appear to be unmet needs in this high-risk patient population. More effective management of patients with diabetes could reduce the risk of progression to ESRD and dialysis; the availability of new drug therapies for early stages of CKD in people with diabetes offers opportunities to improve clinical outcomes and reduce the number of people requiring expensive dialysis. More efficient use of resources through screening and treatment of CKD in patients with diabetes should be explored, which will help to prevent disease progression and lead to a lower cost burden on payers of dialysis.
Medicare spending on both hemodialysis and PD has been on an upward trend for more than a decadeCitation2,Citation37,Citation38. Before 2011, reimbursement to providers for PD was lower than in-center dialysis; however, in 2011, the expansion of the Medicare ESRD PPS aligned reimbursement for both treatment modalitiesCitation39. Despite the incentive for increased utilization of PD, uptake remained low in the United StatesCitation40. To try to tackle the rising cost of dialysis, the US Department of Health and Human Services introduced the Advancing American Kidney Health Initiative, aimed at increasing utilization of home dialysis and provision of kidney transplants for 80% of new ESRD patients by 2025Citation41,Citation42. Cost savings from increased utilization of PD have been realized in some studiesCitation43,Citation44. However, greater use of PD may be a false economy since there could be a higher cost in the long term if PD is used inappropriately for higher-risk patients who then require further intervention due to complications or who need to convert to hemodialysis.
Additional drivers of dialysis costs may be attributed to changes in the Medicare PPS. For example, increasing dialysis-related outpatient costs is likely due to calcimimetic drug costs having been moved from Medicare Part D to Part B and thereby becoming part of the bundled PPS for ESRD beneficiariesCitation38. Notwithstanding the objective of the PPS to reduce outpatient dialysis costs by disincentivizing the overuse of previously separately billable drugsCitation22,Citation45, it remains unclear from the existing evidence the extent to which this has been achieved. Finally, vascular access management accounts for a high proportion of dialysis-related costs; therefore, prevention of access-related complications may be a modifiable driver of costs and should be explored.
Limitations
While the evidence presented here is based on a comprehensive search of bibliographic databases and grey literature sources, the findings are limited by the availability of published data. The findings of this review are based on heterogeneous studies, which makes generalization of results difficult. While outpatient costs are clearly a substantial burden, insufficient granular detail in the data limits opportunities to identify key drivers.
Unlike a systematic review, our scoping review study design did not include a formal assessment of the methodological quality of the included studies; however, our interpretation of the evidence has been conducted with consideration of the individual studies’ strengths and limitations embedded in the scoping review process. Additionally, our chosen study design focuses on achieving an appropriate balance between breadth and depth of the topic area of dialysis costs, while a systematic review is more likely to aim for greater depth on a more specific aspect of the topic.
Conclusions
Most of the data presented here came from nationally representative sources and may be taken as a reliable estimate of the overall cost burden of dialysis. However, the identified studies reported dialysis costs in diverse ways and for a variety of patient groups. Large retrospective studies reporting up-to-date data on all categories of costs would help to clarify the true economic burden of dialysis. Notwithstanding the heterogeneous evidence, certain inferences can be made. Higher costs charged by dialysis providers to private insurance payers may be indicative of disproportionate market power in the private sector. Higher costs associated with diabetes patients who have ESRD suggest an unmet need in this population. Prevention of costly complications related to vascular access may also be a modifiable driver of dialysis costs.
Changes to dialysis reimbursement over the last decade mean that identifying the most expensive elements of dialysis treatment within the consolidated billing structure is increasingly complex. Nevertheless, there is a clear need for action to substantially reduce spending on dialysis by both government and private payers. Prevention of, or delay in progression to, ESRD and dialysis can be achieved with early, low-cost interventions, particularly in high-risk groups such as T2D, which will help to reduce demand for dialysis. Opportunities for cost reduction in areas such as vascular access and choice of dialysis modality should be further explored.
Transparency
Author contributions
Conception and design: YD, RS, BD, SK, FS, and KK. Literature searches, assessment of eligibility of studies for inclusion, extracted data: FS and KK. Data interpretation, drafting, revision, and final approval of manuscript: all authors. All authors agree to be accountable for all aspects of the work, which includes ensuring that questions related to the accuracy or integrity of any part of the work are appropriately investigated and resolved.
Reviewer disclosures
Peer reviewers on this manuscript have no relevant financial or other relationships to disclose.
Supplemental Material
Download MS Word (65.3 KB)Supplemental Material
Download MS Word (108 KB)Acknowledgements
The authors would like to thank Lori Justice and Kylie Matthews for their assistance in preparing early drafts of this manuscript.
Declaration of financial/other relationships
KK, BD, and FS report funding from Bayer to their employer, Cencora, to inform this research. RRS reports employment, support for attending meetings and/or travel, and stock or stock options from Bayer. YD reports employment, support for attending meetings and/or travel, and stock or stock options from Bayer. SK reports employment and support for attending meetings and/or travel from Bayer.
Data availability statement
The authors confirm that the data supporting the findings of this study are available within the article and/or its supplementary materials.
Additional information
Funding
References
- Centers for Disease Control and Prevention [internet]. Chronic kidney disease in the United States, 2023. Accessed June 2023. Available from: https://www.cdc.gov/kidneydisease/publications-resources/ckd-national-facts.html.
- United States Renal Data System [internet]. 2022 USRDS annual data report. 2022. Accessed June 2023. Available from: https://usrds-adr.niddk.nih.gov/2022.
- Nordyke RJ, Reichert H, Bylsma LC, et al. Costs attributable to arteriovenous fistula and arteriovenous graft placements in hemodialysis patients with medicare coverage. Am J Nephrol. 2019;50(4):320–328. doi: 10.1159/000502507.
- West J, Chan HK, Molony DA, et al. Insurance status and emergency department visits associated with hemodialysis in Texas. JAMA Netw Open. 2020;3(2):e1921447. doi: 10.1001/jamanetworkopen.2019.21447.
- West J, Chan HK, Wang H, et al. Emergency department visits for hemodialysis by insurance status in the United States. J Am Coll Emerg Physicians Open. 2022;3(2):e12698. doi: 10.1002/emp2.12698.
- Cervantes L, Rizzolo K, Tummalapalli SL, et al. Economic impact of a change in medicaid coverage policy for dialysis care of undocumented immigrants. J Am Soc Nephrol. 2023;34(7):1132–1134. doi: 10.1681/ASN.0000000000000139.
- Shafqat F, Das S, Wheatley MA, et al. The impact of "emergency-only" hemodialysis on hospital cost and resource utilization. West J Emerg Med. 2023;24(2):206–209. doi: 10.5811/westjem.2022.11.58360.
- Nguyen OK, Vazquez MA, Charles L, et al. Association of scheduled vs emergency-only dialysis with health outcomes and costs in undocumented immigrants with end-stage renal disease. JAMA Intern Med. 2019;179(2):175–183. doi: 10.1001/jamainternmed.2018.5866.
- Ng BP, Laxy M, Shrestha SS, et al. Prevalence and medical expenditures of diabetes-related complications among adult medicaid enrollees with diabetes in eight U.S. states. J Diabetes Complications. 2021;35(3):107814. doi: 10.1016/j.jdiacomp.2020.107814.
- Wang Y, Zhang P, Shao H, et al. Medical costs associated with diabetes complications in medicare beneficiaries aged 65 years or older with type 1 diabetes. Diabetes Care. 2022;46(1):149–155. doi: 10.2337/dc21-2151.
- Deshpande R, Stepanova M, Golabi P, et al. Prevalence, mortality and healthcare utilization among medicare beneficiaries with hepatitis C in haemodialysis units. J Viral Hepat. 2019;26(11):1293–1300. doi: 10.1111/jvh.13173.
- Khanna V, Sakthivelnathan V, Senthil T, et al. Dialysis patients undergoing total hip arthroplasty have higher rates of morbidity and mortality and incur greater healthcare costs: a national database study from 367,894 patients. Indian J Orthop. 2023;57(2):336–343. doi: 10.1007/s43465-022-00799-x.
- Danese MD, Fox KM, Duryea JL, et al. The rate, cost and outcomes of parathyroidectomy in the United States dialysis population from 2016-2018. BMC Nephrol. 2022;23(1):220. doi: 10.1186/s12882-022-02848-x.
- League RJ, Eliason P, McDevitt RC, et al. Variability in prices paid for hemodialysis by employer-sponsored insurance in the US from 2012 to 2019. JAMA Netw Open. 2022;5(2):e220562. doi: 10.1001/jamanetworkopen.2022.0562.
- League RJ, Eliason P, McDevitt RC, et al. Assessment of spending for patients initiating dialysis care. JAMA Netw Open. 2022;5(10):e2239131. doi: 10.1001/jamanetworkopen.2022.39131.
- Trish E, Fiedler M, Ning N, et al. Payment for dialysis services in the individual market. JAMA Intern Med. 2021;181(5):698–699. doi: 10.1001/jamainternmed.2020.7372.
- Kaplan JM, Niu J, Ho V, et al. A comparison of US medicare expenditures for hemodialysis and peritoneal dialysis. J Am Soc Nephrol. 2022;33(11):2059–2070. doi: 10.1681/ASN.2022020221.
- Weinhandl ED, Saffer TL, Aragon M. Hidden costs associated with conversion from peritoneal dialysis to hemodialysis. Kidney360. 2022;3(5):883–890. doi: 10.34067/KID.0007692021.
- Lin E, Lung KI, Chertow GM, et al. Challenging assumptions of outcomes and costs comparing peritoneal and hemodialysis. Value Health. 2021;24(11):1592–1602. doi: 10.1016/j.jval.2021.05.017.
- Yeung E, Bello AK, Levin A, et al. Current status of health systems financing and oversight for end-stage kidney disease care: a cross-sectional global survey. BMJ Open. 2021;11(7):e047245. doi: 10.1136/bmjopen-2020-047245.
- Centers for Medicare & Medicaid Services [internet]. End-stage renal disease (ESRD). 2023. Accessed June 2023. Available from: https://www.medicare.gov/basics/end-stage-renal-disease.
- Wetmore JB, Tzivelekis S, Collins AJ, et al. Effects of the prospective payment system on anemia management in maintenance dialysis patients: implications for cost and site of care. BMC Nephrol. 2016;17(1):53. doi: 10.1186/s12882-016-0267-x.
- Davis J, Robinson S, Murunga A, et al. PUK3 incident costs of dialysis initiation among medicare beneficiaries with advanced chronic kidney disease. Value Health. 2021;24(1):S234. doi: 10.1016/j.jval.2021.04.1171.
- Lin E, Ly B, Duffy E, et al. Medicare advantage plans pay large markups to consolidated dialysis organizations. Health Aff (Millwood). 2022;41(8):1107–1116. doi: 10.1377/hlthaff.2021.02009.
- Nichols GA, Ustyugova A, Déruaz-Luyet A, et al. Health care costs by type of expenditure across eGFR stages among patients with and without diabetes, cardiovascular disease, and heart failure. J Am Soc Nephrol. 2020;31(7):1594–1601. doi: 10.1681/ASN.2019121308.
- Mu F, Betts KA, Woolley JM, et al. Prevalence and economic burden of hyperkalemia in the United States medicare population. Curr Med Res Opin. 2020;36(8):1333–1341. doi: 10.1080/03007995.2020.1775072.
- Sibbel S, Sato R, Hunt A, et al. The clinical and economic burden of pneumonia in patients enrolled in medicare receiving dialysis: a retrospective, observational cohort study. BMC Nephrol. 2016;17(1):199. doi: 10.1186/s12882-016-0412-6.
- Betts KA, Woolley JM, Mu F, et al. The cost of hyperkalemia in the United States. Kidney Int Rep. 2018;3(2):385–393. doi: 10.1016/j.ekir.2017.11.003.
- Sy J, Streja E, Grimes B, et al. The marginal cost of frailty among medicare patients on hemodialysis. Kidney Int Rep. 2020;5(3):289–295. doi: 10.1016/j.ekir.2019.11.020.
- Thamer M, Lee TC, Wasse H, et al. Medicare costs associated with arteriovenous fistulas among US hemodialysis patients. Am J Kidney Dis. 2018;72(1):10–18. doi: 10.1053/j.ajkd.2018.01.034.
- Lindquester WS, Dhangana R, Warhadpande S. Bundled medicare payments: trends in utilization and physician payments for dialysis arteriovenous fistula and graft maintenance procedures from 2010 to 2018. AJR Am J Roentgenol. 2020;215(4):785–789. doi: 10.2214/AJR.19.22675.
- Trivedi PS, Jensen AM, Brown MA, et al. Cost analysis of dialysis access maintenance interventions across physician specialties in U.S. Medicare beneficiaries. Radiology. 2020;297(2):474–481. doi: 10.1148/radiol.2020192403.
- Wagner JK, Fish L, Weisbord SD, et al. Hemodialysis access cost comparisons among incident tunneled catheter patients. J Vasc Access. 2020;21(3):308–313. doi: 10.1177/1129729819874307.
- Al-Balas A, Lee T, Young CJ, et al. The clinical and economic effect of vascular access selection in patients initiating hemodialysis with a catheter. J Am Soc Nephrol. 2017;28(12):3679–3687. doi: 10.1681/ASN.2016060707.
- Al-Balas A, Shariff S, Lee T, et al. Clinical outcomes and economic impact of starting hemodialysis with a catheter after predialysis arteriovenous fistula creation. Am J Nephrol. 2019;50(3):221–227. doi: 10.1159/000502050.
- Liao M, Li Y, Kianifard F, et al. Cluster analysis and its application to healthcare claims data: a study of end-stage renal disease patients who initiated hemodialysis. BMC Nephrol. 2016;17(1):25. doi: 10.1186/s12882-016-0238-2.
- United States Renal Data System [internet]. 2019 USRDS annual data report. 2019. Available from: https://www.niddk.nih.gov/about-niddk/strategic-plans-reports/usrds/prior-data-reports/2019.
- United States Renal Data System [internet]. 2021 USRDS annual data report: epidemiology of kidney disease in the United States. 2021. Accessed December 2022. Available from: https://usrds-adr.niddk.nih.gov/2021.
- Hornberger J, Hirth RA. Financial implications of choice of dialysis type of the revised medicare payment system: an economic analysis. Am J Kidney Dis. 2012;60(2):280–287. doi: 10.1053/j.ajkd.2012.03.010.
- Flanagin EP, Chivate Y, Weiner DE. Home dialysis in the United States: a roadmap for increasing peritoneal dialysis utilization. Am J Kidney Dis. 2020;75(3):413–416. doi: 10.1053/j.ajkd.2019.10.013.
- US Department of Health and Human Services [internet]. Advancing American kidney health. Accessed September 2022. Available from: https://aspe.hhs.gov/sites/default/files/private/pdf/262046/AdvancingAmericanKidneyHealth.pdf.
- Baerman EA, Kaplan J, Shen JI, et al. Cost barriers to more widespread use of peritoneal dialysis in the United States. J Am Soc Nephrol. 2022;33(6):1063–1072. doi: 10.1681/asn.2021060854.
- Liu FX, Ghaffari A, Dhatt H, et al. Economic evaluation of urgent-start peritoneal dialysis versus urgent-start hemodialysis in the United States. Medicine (Baltimore). 2014;93(28):e293. doi: 10.1097/MD.0000000000000293.
- Neil N, Guest S, Wong L, et al. The financial implications for medicare of greater use of peritoneal dialysis. Clin Ther. 2009;31(4):880–888. doi: 10.1016/j.clinthera.2009.04.004.
- Centers for Medicare & Medicaid Services. Federal Register. Medicare Program; End-Stage Renal Disease Prospective Payment System; Final Rule and Proposed Rule: CMS-42 CFR Parts 410, 413 and 414. 2010. Accessed March 2024. Available from: http://www.gpo.gov/fdsys/pkg/FR-2010-08-12/pdf/2010-18466.pdf.