
 ?Mathematical formulae have been encoded as MathML and are displayed in this HTML version using MathJax in order to improve their display. Uncheck the box to turn MathJax off. This feature requires Javascript. Click on a formula to zoom.
ABSTRACT
Visuospatial neglect (VSN) is characterized by a lateralized attentional deficit in the visual domain. In addition, patients with VSN might have an impairment in the temporary storage of spatial information in working memory (spatial working memory; SWM) that, like VSN, could impair systematic searching behavior. Several studies have demonstrated either SWM impairments or impaired searching behavior in VSN patients. Here, we related SWM performance to search behavior in patients with and without VSN. We assessed SWM using a novel task in a group of 182 stroke patients (24 with VSN, 158 without) and 65 healthy controls. We related SWM performance to available stroke-related and cognitive data. Patients with VSN exhibited lower SWM performance than patients without VSN and healthy controls. Additional control analyses indicated that differences in SWM performance are specific to visuospatial processing, instead of e.g. verbal working memory or the general level of physical disability. Last, we related SWM performance to visual search performance on cancellation tasks, one where their cancellation markings remained visible and another one where their prior cancellations markings were invisible to the patient and therefore patients had to remember which targets they had canceled. SWM performance correlated with search organization. Together, these results from a large sample of stroke patients corroborate the findings of earlier studies, while excluding several alternative explanations: SWM impairment is a part of the neglect syndrome, and SWM impairments are related to search behavior.
Introduction
Visuospatial neglect (VSN) is a common disorder after brain damage, affecting around 20–50% of patients after a first-ever stroke (Appelros, Karlsson, Seiger, & Nydevik, Citation2002; Nijboer, Kollen, & Kwakkel, Citation2013). The core component of VSN is a lateralized attention deficit in the visual domain (Bisiach & Vallar, Citation1988; Kinsbourne, Citation1987), reflected in the observations that patients with VSN tend to copy only the right half of a figure (Ronchi, Posteraro, Fortis, Bricolo, & Vallar, Citation2009) or miss targets in the left half of a search array (Eglin, Robertson, & Knight, Citation1989). In addition, VSN is often accompanied by non-lateralized spatial processing impairments, such as spatial working memory deficits (SWM; Husain & Rorden, Citation2003; Striemer, Ferber, & Danckert, Citation2013). These latter processes are affected throughout the visual field, not only for the part that is affected by the lateralized attention deficit. VSN is therefore often defined as a syndrome in visuospatial processing, with both lateralized and non-lateralized symptoms (here, we focus on a deficit in SWM as the non-lateralized symptom).
Both the lateralized and non-lateralized impairments associated with VSN are thought to be reflected in disorganized visual search (Behrmann, Watt, Black, & Barton, Citation1997; Husain et al., Citation2001; Shimozaki et al., Citation2003; Wojciulik, Husain, Clarke, & Driver, Citation2001). Indeed, search behavior of patients with VSN is characterized by omission of one half of the search array, unstructured search paths and frequent revisits of already inspected items (Kristjánsson & Vuilleumier, Citation2010; Mannan et al., Citation2005; Ten Brink, van der Stigchel, Visser-Meily, & Nijboer, Citation2016). This is also reflected in performance on the commonly used cancellation task: patients with VSN show a tendency to cancel the same targets multiple times (Parton et al., Citation2006), analogous to re-fixations in eye-tracking data of these patients (Mannan et al., Citation2005; Paladini et al., Citation2019; Parton et al., Citation2006; Ptak, Schnider, Golay, & Müri, Citation2007). However, disorganized search seems to be unrelated to the lateralized attention deficit (Mark, Woods, Ball, Roth, & Mennemeier, Citation2004; Ten Brink, Visser-Meily, & Nijboer, Citation2018). Here, we investigated which components of disorganized search in patients with VSN are related to the lateralized attention deficit and which to a non-lateralized SWM impairment. First, we investigated the relation between VSN and performance on a novel SWM task. Then, we addressed several alternative explanations for a potential relationship between VSN and SWM deficits. Lastly, we explored the relationship between VSN, SWM and search performance.
SWM performance has been assessed before in patients with VSN (see ). The used experimental tasks consisted of variations of the Corsi task (Malhotra et al., Citation2005; Malhotra, Mannan, Driver, & Husain, Citation2004; Wansard et al., Citation2015, Citation2014), change detection tasks (Ferber & Danckert, Citation2006; Pisella, Berberovic, & Mattingley, Citation2004) and an N-back task (Ravizza, Behrmann, & Fiez, Citation2005). The tasks were designed to minimize potential interference of the lateralized attentional deficit, for example by presenting stimuli only on a vertical axis. Although SWM was measured with different tasks, all studies concluded that patients with VSN had lower SWM performances than controls. Such a difference in performance was not observed in non-spatial (e.g. feature-based) working memory tasks (Ferber & Danckert, Citation2006; Malhotra et al., Citation2005; Pisella et al., Citation2004; Ravizza et al., Citation2005).
Table 1. Literature overview. Studies that assessed spatial working memory (SWM) performance in patients with visuospatial neglect (VSN) directly. The total number of participants are split by patients with visuospatial neglect (VSN+), patients without visuospatial neglect (VSN-) and healthy control subjects. In the rightmost column a brief description of the SWM task is provided.
Here, we assessed SWM performance in a large convenience sample of stroke patients in a rehabilitation clinic and compared SWM performance between patients with and without VSN. We intentionally define VSN based on a single score: the difference in number of omissions between the left and right side of a cancellation task. The cancellation task is the most sensitive test to measure the attentional imbalance (Ferber & Karnath, Citation2001) which represents the core deficit in VSN (Heilman, Valenstein, & Watson, Citation2000; Husain & Rorden, Citation2003; Ten Brink et al., Citation2018). We believe that an important reason for the heterogeneity of VSN is that it is typically assessed with multiple tests. This could give rise to situations where some patients only show neglect on test A and B, whereas others show neglect on test C and D. Still, both groups would be qualified as having VSN. This classification increases the heterogeneity of the VSN group and potentially obscures characteristics that are only present in part of the VSN group (Azouvi et al., Citation2002; Buxbaum et al., Citation2004; Ferber & Karnath, Citation2001). To maximize the clarity of our definition of VSN – the lateralized attentional deficit – we only used the cancellation task for group classification (and thus our definition of VSN). We have added an explorative analysis in which we investigate whether the line bisection task, another common diagnostical test for VSN, can potentially account for the observed relationship between VSN (as defined by the omission difference score in the cancellation task) and SWM.
After investigating SWM performance between patients with and without VSN, we examined whether potential SWM impairments relate to generally impaired functional or cognitive abilities in patients with VSN. To this end, we related SWM performance with measures of motor functioning, functional independence, general cognitive functioning and specific cognitive domains using existing data from their physical and neuropsychological assessment. These analyses address the potential explanation that a relationship between VSN and SWM can simply be explained because patients with VSN suffer from an overall decline in functional and cognitive performance, resulting in a decreased performance on any kind of (neuropsychological) task irrespective of whether the task depends on visuospatial processing.
Finally, we measured visual search organization with a second cancellation task, where their prior cancellations markings were invisible to the patient and therefore patients had to remember which targets they had canceled. We derived four different measures of search organization from this task: lateralization of omissions, number of delayed revisits, best R and intersection rate (Dalmaijer, Van der Stigchel, Nijboer, Cornelissen, & Husain, Citation2015). We classified patients with a 2 × 2 classification: with or without VSN, and with or without an SWM impairment.
Methods
Participants
Patients were recruited after admission for in-patient rehabilitation to De Hoogstraat Rehabilitation center (Utrecht, the Netherlands). Patients in this study were patients who had been admitted to De Hoogstraat rehabilitation clinic after being hospitalized elsewhere. In the Netherlands, not all stroke patients are referred to a rehabilitation clinic. To be eligible for rehabilitation, patients need to meet several criteria upon discharge from the hospital (described in Van Der Stoep et al., Citation2013). To summarize these eligibility criteria: a patient is not able to return home yet but is expected to improve sufficiently with rehabilitation. Therefore, this population is relatively young and seriously, though relatively moderately, affected by their stroke. Stroke patients who arrived at De Hoogstraat were scheduled for the neglect screening (see Neglect screening). We aimed to keep our sample of patients as representative possible, so patients were only excluded when they did not comprehend task instructions or when no data was obtained for the cancellation task (due to for example fatigue). All patients who were able to perform the cancellation task were also able to perform the SWM task. We have no data on the number of patients who were excluded, because patients with, for example, severe impairments in language comprehension or severe fatigue were not scheduled for the neglect screening. We included 182 stroke patients. Of the 182 patients, 24 were included in the VSN+ group, 158 in the VSN- group. Possibly, the percentage of patients with VSN in this study is lower than typically observed because patients were not recruited in the acute phase on a stroke ward, but in a rehabilitation clinic, where patients are only referred to when they are considered to profit from rehabilitation and are relatively young and moderately impaired by their stroke. Additionally, 65 healthy control subjects were recruited to perform the novel SWM task. Control subjects were paid €10,- for their participation. See for an overview of the demographics of all participants, split by group.
Table 2. Demographics.
Data collection
Data collection procedures and procedures of neuropsychological tests are described in detail elsewhere (Ten Brink et al., Citation2018). Briefly, there were three moments of data collection. First, demographical data and diagnostical screening tests for a general level of functioning were administered upon admission by a rehabilitation physician. Later, an extensive neglect screening battery was conducted – the SWM task was included in this neglect screening. Patients were scheduled for the neglect screening as part of usual care after admission for in-patient rehabilitation to De Hoogstraat Rehabilitation center (Utrecht, the Netherlands). Last, a general neuropsychological assessment was performed. All data were provided anonymized to the authors. The procedures were in accordance with the Declaration of Helsinki.
Diagnostical screening
The diagnostical screening tests included the Montreal Cognitive Assessment (MoCA; in some patients the Mini-Mental State Examination was used, these scores were later converted to MoCA scores following Solomon et al., Citation2014), the “Stichting Afasie Nederland test” (SAN), the Motricity index (arm and leg), and the Barthel index. The MoCA is used to assess a general level of cognition (range = 0–30). The SAN is a Dutch language deficit test for aphasia (range = 1–7). The motricity indices reflect motor strength and coordinates in the legs and arms separately (range = 1–100). The Barthel index assess the level of independence in daily activities (range = 0–20). In all tests, higher scores reflect better performance.
Neglect screening
The second moment of data collection was approximately in the second week of admission to rehabilitation (Mdn = 21 days after stroke, Q1 = 16, Q3 = 30 days). Patients were screened for VSN using a computerized version of a shape cancellation task as part of an extended VSN screening (Van Der Stoep et al., Citation2013). The cancellation task was presented at 90 cm from the patient. Some patients had difficulties in performing the digital versions of the cancellation task. In these patients, a traditional pen-and-paper version of the cancellation task was administered. The neglect screening consisted of more tests then described here (among which a line bisection task). However, we only report the cancellation tasks here for the sake of clarity. All other tests are described by Ten Brink et al. (Citation2018).
Visual search
Most patients performed two versions of the cancellation task, one where their markings remained visible (used to assess VSN), and one where the markings were invisible to the patient but only registered digitally. The latter task was used to assess visual search in this study. Because not all patients were able to perform the digital version of the cancellation tasks, we do not have data for these patients on the cancellation task with invisible markings. We quantified search behavior with four measures: (1) the absolute difference between the number of omissions left and right, (2) the number of delayed revisits, i.e. re-cancellation of a target when at least one other target has been canceled in between, (3) best R, i.e. a correlation between the order of cancellation and position of canceled items (Mark et al., Citation2004), and (4) the intersection rate, i.e. the number of times the path of cancellation crosses itself divided by the total number of markings (Benjamins, Dalmaijer, Ten Brink, Nijboer, & Van der Stigchel, Citation2018; Dalmaijer et al., Citation2015). Note that the definition of delayed revisits makes a distinction between continuous perseverations (i.e. repetitive cancellations of the same target) and delayed, recurrent revisits (Gandola et al., Citation2013). We only considered delayed, recurrent revisits by including only those revisits where at least one other target had been canceled in between.
Neuropsychological assessment
The third moment of data collection was a broader neuropsychological assessment (Mdn = 7 days after the neglect screening, Q1 = 4, Q3 = 14 days). Not all tasks were administered in all patients, rather a selection was made by the neuropsychologist. Therefore, we do not have all neuropsychological data for all patients in our sample. We selected the WAIS Digit Span (verbal working memory), Rey auditory verbal learning test (RAVLT; verbal memory), Delis-Kaplan executive function system Tower test (D-KEFS Tower test; spatial planning, executive functioning) and the Rey-Osterrieth Copy Figure test (ROCFT, visuospatial perception and construction) for different subsamples from our total sample. These tests were selected as they reflect different cognitive functions, so the major cognitive domains are represented; and were assessed most frequently, resulting in a group of at least 5 patients per test. We used the raw test scores of each test: longest span length of the WAIS digit span forward (range = 3–8), longest span length of the WAIS digit span backward (range = 2–8), total number correct words of the RAVLT (range = 0–75), raw score of the ROCFT (range = 0–36) and raw score of the D-KEFS Tower test (range = 0–30). The analysis of these data is provided in the Supplementary Information.
Spatial working memory task
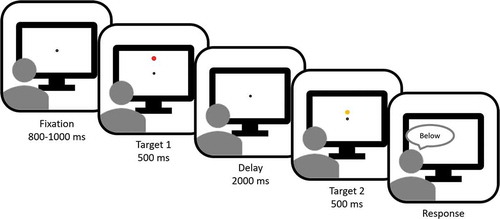
The trial sequence is depicted in . A trial started with a fixation point that was displayed for 800–1000 ms. Then Target 1 (T1) was presented for 500 ms. In half of the trials, T1 was presented above the fixation point, in the other half below. After the presentation of T1, the fixation point briefly (100 ms) expanded and contracted to reorient attention back to the fixation point. Target 2 (T2) was presented 2000 ms after the offset of T1, and vertically displaced with respect to the original location of T1. Participants verbally indicated whether T2 was presented above or below the original position of T1 by saying “higher” or “lower”. The response was recorded with a keypress on a standard keyboard by the experimenter. T1 and T2 were dots with the same radius (0.3°). T1 was red and T2 was yellow to make them clearly distinct. The background color was uniformly gray. T2 was always presented in the same vertical hemifield as T1 (e.g. when T1 was presented above the fixation point, so would T2). The difference in location between T1 and T2 was controlled with a staircase: Accelerated Stochastic Approximation (Kesten, Citation1958; Treutwein, Citation1995). In the first trial, the displacement size was 4.8°. In the first three trials, the displacement size on the next trial (dk+1) was given by
Figure 1. Trial sequence. Participants had to indicate whether Target 2 (yellow) was presented above or below the location of Target 1 (red). The distance between the locations of Target 1 and Target 2 was controlled by a staircase procedure, i.e. the distance was made smaller when the response on the previous trial was correct, and vice versa. In the delay between Target 1 and Target 2, the fixation point briefly expanded and contracted. Responses were given verbally and entered through a standard keyboard by the experimenter. Actual background color was grey, here depicted as white.
where dk is the displacement size used in the current trial, 3.6 is the staircase constant, k is the trial number, Zk is 1 when a correct response was provided in the current trial or 0 when an incorrect response was provided, and 0.8 is the desired accuracy level. On the remaining trials, the displacement size was adjusted slightly differently, taking into account the number of switches that had been made, i.e. the switch from a series of correct answers to an incorrect answer or vice versa:
where mswitch is the number of switch trials. T1 and T2 were never closer than 1.2° to either the screen edge or the fixation point. The staircase converges to a displacement size at which the proportion correct responses should be 0.8. This displacement size is the threshold. Ideally, the final threshold estimate is taken from the staircase estimates when the displacements reaches a predefined lower limit. However, this means that the duration of the task is undefined. We aimed to keep the task as brief as possible, so we used a low, fixed number of trials (n = 32). Because of this low trial number, we defined the threshold as the weighted average of the last 10 displacements (D),
where w is the weight vector, given by
Task instructions were verbally explained to the participant. Before the staircase procedure started participants practiced at least 4 trials. Total execution of the task lasted approximately 5 minutes.
Analysis
Classification of VSN
Patients were divided into two groups based on their performance on the cancellation task with visible markings. We took the absolute difference of omissions between the left and right side of the stimulus field. When, for example, more targets on the right side were omitted than on the left, there was an omission difference. When a patient obtained an absolute omission difference of two or more, this patient was included in the VSN+ group, otherwise in the VSN- group (Nijboer et al., Citation2013; Nijboer, van de Port, Schepers, Post, & Visser-Meily, Citation2013; Ten Brink et al., Citation2018; Van Der Stoep et al., Citation2013). We used this criterion because it is used in the rehabilitation clinic as a clinical sign of VSN. Changing the criterion to higher omission difference scores or combining the omission difference scores with the total number of omissions lowered the number of patients in the VSN+ group but did not change the inferences of the group analysis.
Classification of SWM impairment
A cutoff criterion for the SWM task was determined based on the 95th percentile of the data of the control subjects. We estimated the probability density function of SWM thresholds using kernel density estimation with a Gaussian kernel of width 0.1. This procedure yielded a cutoff threshold of 1.24°. Patients with SWM thresholds above this value were assigned to the SWM+ group, otherwise they were assigned to the SWM- group.
Statistical analysis – Differences in SWM between patients with and without VSN
For our analysis, we took the base 10 logarithm of these thresholds, because the threshold estimate is positively skewed (by definition). Distributions of the thresholds per group are depicted in . We analyzed the differences in thresholds between the three groups (i.e. control, VSN-, VSN+) with Bayesian linear models and Bayesian model averaging (Hoeting, Madigan, Raftery, & Volinsky, Citation1999; Rouder, Morey, Verhagen, Swagman, & Wagenmakers, Citation2016), using the generalTestBF function from the R-package “BayesFactor”, with default prior settings (Morey, Rouder, & Jamil, Citation2015). GeneralTestBF computes the Bayes Factor of a model with respect to an intercept only, null model. To estimate the evidence in favor of a specific factor included in the analysis, we sum the Bayes Factors (BF10) of all models that include that factor and divide it by the summed BF10 of all the models without. This number is then multiplied by the relative prior probability: the fraction of all models without the factor divided by the fraction of all models with the factor. To guide the interpretation of the Bayes Factor (BF10) we use the interpretations provided in , based on Jeffreys (Jeffreys, Citation1961) and Kass and Raferty (Kass & Raftery, Citation1995). It is important to note that the size of the BF10 is not the same as the effect size, e.g. a high BF10 does not reflect a large effect but rather strong evidence in favor of what could very well be a small effect. For the main analysis, we compared the thresholds between the three groups, while controlling for possible effects of age and gender. Hence, we construct seven models to explain the SWM threshold (1. group, 2. age, 3. sex, 4. group+age, 5. group+sex, 6. age+sex, 7. group+age+sex).
Table 3. Proposed interpretation of Bayes factors.
Statistical analysis – Effect of general disability on SWM performance
To exclude the possibility that the observed differences in SWM impairments result from a general disability, we examined whether the scores on the diagnostical screening tests influenced the SWM thresholds. As noted in , we did not have the data of the diagnostical screening tests for all patients who completed the SWM task. For simplicity, we treated the missing values as random and performed the following analyses only on the complete cases (i.e. patients for whom we have data on all 5 tests, the MoCA scores, Barthel indices, SAN, Motricity index arm and Motricity index leg: 96 VSN-, 13 VSN+). Similar to the SWM group analysis, we compared all 63 conceivable models with the combinations of the following 6 predictors: 1. group, 2. MoCA score, 3. Barthel index, 4. SAN score, 5. Motricity index leg, 6. Motricity index arm. All models were compared to the intercept only model. The observed SWM thresholds were the most likely under the model that included both group and MoCA score. In addition, we computed Bayes factors for the inclusion of each effect separately.
Statistical analysis – Relation between VSN, SWM and search behavior
After subjects were classified as having either a lateralized attention deficit (i.e. our definition of VSN), an impairment in SWM, both or neither, we analyzed the differences on four common measures of search behavior between these four groups. Search behavior was assessed with the cancellation task where markings were kept invisible from the patient. For each of the four measures of search behavior (see Methods, Visual search), we created a Bayesian linear models in which we included the 2 × 2 design of impairments (VSN+/SWM+, VSN+/SWM-, VSN-/SWM+, VSN-SWM-) and the MoCA score as a covariate, because this score also explains part of the difference between VSN groups as described in the Results section. An example of the model in Wilkinson’s notation is: revisits ~ VSNgroup + SWMgroup + VSNgroup:SWMgroup + MoCA.
Results
Differences in SWM between patients with and without VSN
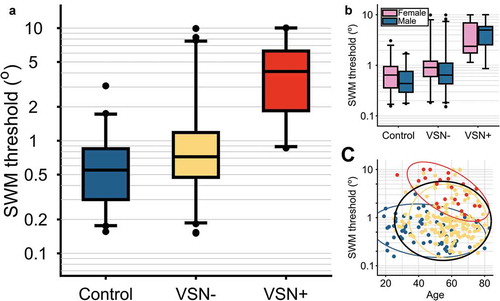
The data are strongly in favor of a difference in SWM threshold between the three groups (BF10 = 3.12 × 10¹⁴), with inconclusive evidence for an effect of age (BF10 = 0.934) or sex (BF10 = 0.374). Therefore, in the following analyses, we will further consider the model with only group as a predictor, but not with age or sex. See for a visualization of the SWM thresholds per group and per group separated for sex or age. We obtained the estimated median SWM thresholds for each group and their 95%-credible intervals (CrI). For the control group, the median threshold was 0.54° (CrI: 0.39–0.75). For the VSN- group this was substantially higher, with a median of 0.84° (CrI: 0.63–1.13), and even higher for the VSN+ group, with a median of 3.32 (CrI: 2.27–4.84). The results of this analysis were similar when we only included patients with right hemisphere lesions in the VSN- and VSN+ groups. Due to the low number of VSN+ patients with left hemisphere lesions (N = 4) we did not interpret the same analysis for left hemisphere patients. To summarize, the SWM threshold of VSN+ patients was higher than that of control subjects and VSN- patients. There was no clear difference between the average threshold of the control group and the VSN- patients.
Figure 2. Spatial working memory (SWM) thresholds. For the boxplots, the central horizontal lines indicate the median threshold per group. Boxes encompass the inter-quartile range, whiskers extend to 2.5th and 97.5th quantiles of the group data. Points are participant with scores outside these intervals. (a) Thresholds per group. There was strong evidence in favor of an effect of group on the SWM thresholds (BF10 = 3.12 × 10¹⁴). Moreover, the medians per group are different of the medians of the other groups, as indicated by non-overlapping 95% credible intervals. (b) Thresholds per group and split between males and females. There was no clear evidence for an effect of sex on the SWM thresholds (BF10 = 0.374). (c) Thresholds as a function of age. There was inconclusive evidence for an effect of age on the SWM thresholds (BF10 = 0.934). Ellipses represent area that holds 95% of the cases per group. Blue = control, yellow = VSN-, red = VSN+. Black ellipse represents 95% area across all cases.
A supplementary analysis indicated that the difference in SWM thresholds between the VSN- and VSN+ group is not explained by altitudinal neglect (Supplementary Information, A). To test whether the relation between VSN and SWM performance is specifically related to the cancellation test,, we analyzed the relationship between SWM thresholds and the size of the absolute omission difference on the cancellation task. In addition, we added the absolute average error on the line bisection task to the model to see whether this task would also be predictive of SWM thresholds (Supplementary Information, B). This analysis showed that performance on the cancellation task predicts the SWM thresholds, but performance on the line bisection task does not.
Explanatory effect of general disability on SWM performance
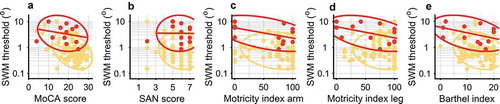
Next, we related SWM thresholds to scores on the diagnostical screening tests (). As shown in , the VSN+ group scores lower on the general cognitive screening task (MoCA) than the VSN- group. Moreover, the VSN+ group has a lower Barthel Index than the VSN- group. For the SAN and both Motricity indices there was no clear difference between the VSN- and VSN+ groups. When controlling for the effect of these tests, we still observed strong evidence for an effect of group on SWM (BF10 = 3.49 × 10⁴). In addition, we also observed strong evidence for an effect of the MoCA score (BF10 = 141) on the SWM thresholds, but inconclusive evidence for an effect of the SAN score (BF10 = 0.397), the Motricity Index arm (BF10 = 0.490), Motricity Index leg (BF10 = 0.530), or the Barthel Index (BF10 = 1.16). In sum, SWM thresholds were best predicted by a combination of the presence of VSN (VSN+ vs. VSN-) and general cognitive performance (MoCA score). The effect of MoCA score on the SWM threshold can be best described as an increase of 0.025 log units (CrI: 0.012–0.037) for every point lost on the MoCA. To conclude, even though the MoCA score was related to the performance on our SWM task, the presence of VSN had an additive effect, with increased SWM thresholds for patients with VSN.
Figure 3. Control analyses. Red represents the VSN+ group. Yellow represents the VSN- group. Note that in these analyses we only included a subset of patients for which we had the data (see ). Spatial working memory (SWM) thresholds as a function of (a) MoCA score (BF10 = 141), (b) SAN score, (Dutch aphasia test; BF10 = 0.397), (c) Motricity Index arm (BF10 = 0.490), and (d) Motricity Index leg (BF10 = 0.530), (e) Barthel index (BF10 = 1.16). When accounting for these relations, the VSN+ group still has a higher median SWM threshold than the VSN- group (BF10 = 3.49 × 10⁴). In sum, across patients, a lower MoCA score is related to a higher SWM threshold and the presence of VSN predicts an additional increase in SWM threshold, but none of the other measures for general disability was strongly related to SWM performance.
In another exploratory analysis, we related the SWM thresholds of the VSN- and VSN+ group to the performance on five tests from the neuropsychological assessment (WAIS digit span forward, WAIS digit span backward, RAVLT, R-OCFT, D-KEFS Tower). See Supplementary Information, C for the details of this analysis. The results of this analysis suggest that, although the VSN+ group scored worse on the SWM task than the VSN- group, this is not due to a general worse performance on any cognitive task. The VSN- and VSN+ groups only seem to differ on tasks with an explicit spatial component (i.e. R-OCFT, D-KEFS Tower) but not on other tasks (i.e. WAIS Digit Span forward or backward, RAVLT).
Relation between VSN, SWM and search behavior
Lastly, we investigated search behavior on the cancellation task without visible markings. shows the number of patients for whom we had access to both the MoCA score and data from the cancellation task without visible markings. We analyzed the four measures of search behavior (i.e. absolute omission difference score, delayed revisits, best R and intersection rate) with Bayesian linear models.
Table 4. Number of patients with a lateralized attention deficit (VSN) and an SWM impairment (SWM), for whom we also had access to the MoCA score.
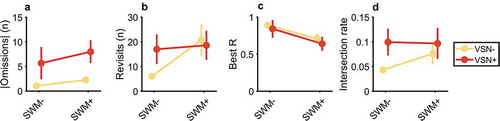
For the absolute difference between number of omissions left and right ()) there was strong evidence for a main effect of the lateralized attention deficit (BF10 = 4.31 × 10⁵), but inconclusive evidence against an effect of SWM (BF10 = 0.874) or an interaction (BF10 = 0.382). The median difference between VSN- and VSN+ group was 5.21 (CrI: 3.17–7.20). Conversely, there was substantial to strong evidence for an effect of SWM impairment on the number of delayed revisits (BF10 = 13.9, median difference = 11.7, CrI: 5.19–18.20) and best R (BF10 = 167, median difference = 0.17, CrI: 0.08–0.26), but inconclusive evidence against an effect of the lateralized attentional deficit (BF10 = 0.432, BF10 = 0.503, respectively) or the interaction between the two (BF10 = 0.822, BF10 = 0.374, respectively). For the intersection rate, evidence for or against any effect was inconclusive (0.6 < all BF10 < 1.80). Together, this pattern of results suggests that the number of delayed revisits and best R are related to SWM performance, whereas the number of lateralized omissions is related to the lateralized attentional deficit of VSN.
Figure 4. Effect of SWM deficit and VSN on search performance, as assessed with the cancellation task with invisible markings. SWM+ group consists of patients with an SWM threshold > 1.24°. Points represents mean, error bars 1 s.e.m. (a) Absolute difference between the number of omission on the left and right side of the search display. There is strong evidence for an effect of VSN on the number of omissions, but inconclusive evidence for an effect of the SWM deficit. (b) Number of delayed revisits. There is substantial evidence for an effect of the SWM deficit on the number of revisits, but inconclusive evidence for a main effect of VSN, or an interaction effect. (c) Best R. There is strong evidence for an effect of SWM, but inconclusive evidence for an effect of VSN or an interaction effect. (d) Intersection rate. There is inconclusive evidence for an effect of either SWM or VSN.
Lesion side
Problems in visual search have been observed more frequently in patients with right hemisphere damage than in patients with left hemisphere damage (Ten Brink et al., Citation2016). Therefore, we explored this lateralization in the current dataset by repeating the analysis from the paragraph VSN, SWM and search behavior, but then with “lesion side” instead of VSN. For this analysis we only included patients from the VSN- group with left or right hemisphere lesions (LH and RH lesions), and for whom we had data of the MoCA and cancellation task with invisible markings. Thus, we had 32 LH/SWM-, 4 LH/SWM+, 34 RH/SWM- and 9 RH/SWM+ patients.
For none of the four search measures (omission difference score, delayed revisits, best R, intersection rate) did the data provide suggestive evidence for a difference between patients with LH and RH lesions (BF10 = 1.16, BF10 = 0.385, BF10 = 0.439, BF10 = 0.273, respectively). However, there was strong evidence for an effect of SWM deficit on the number of revisits (BF10 = 269) and best R (BF10 = 172). The evidence was inconclusive with regards to an effect of SWM deficit on omission difference (BF10 = 0.983) or the intersection rate (BF10 = 2.77). Evidence for the interaction effect between lesion side and SWM deficit was inconclusive for all measures (0.34 < all BF10 < 0.56).
Discussion
We assessed SWM performance in 182 stroke patients and 65 healthy controls. 24 of the stroke patients demonstrated VSN on a cancellation task, 158 did not. On average, patients with VSN had lower SWM performance than patients without VSN and healthy controls. Moreover, the data suggest that the SWM impairment in VSN patients does not reflect a general functional or cognitive impairment but a specific impairment in visuospatial processing. SWM thresholds were related to performance on the ROCFT (visuospatial perception and construction), and to a lesser extent to the D-KEFS Tower test (spatial planning and executive functioning), but the SWM thresholds were not strongly related to performance on the WAIS digit span (verbal working memory) or RALVT (verbal learning and memory), similar to previous findings
(Malhotra et al., Citation2005, Citation2004; Ravizza et al., Citation2005). The relations between SWM performance and the ROCFT and the D-KEFS Tower test are perhaps unsurprising given that both the ROCFT and the D-KEFS Tower test are used to assess visuospatial processing (Ten Brink et al., Citation2016). Furthermore, the absence of a clear relationship between the WAIS digit span performance and SWM thresholds indicates that the SWM thresholds do not reflect a general level of working memory, but very specific visuospatial working memory processes. We warrant some caution with this last statement because our sample size for the neuropsychological tasks was relatively small for the VSN+ group, which could mean that we did not have sufficient power to observe small relations.
As said, SWM performance correlated with the absolute difference in left-right omissions on the cancellation task (our measure for VSN), but not with the performance on the line bisection task. A possible explanation for this is that VSN is best measured with the cancellation task (Ferber & Karnath, Citation2001). After establishing SWM impairments in patients with VSN, we further explored the relationship between SWM performance and search behavior. To this end, we classified patients with and without an SWM deficit (based on the 95th percentile of the SWM thresholds of the control group). Two measures of visual search organization were lower in the group of patients with an SWM deficit: the number of delayed revisits and best R (Mark et al., Citation2004). It is unclear from the current data whether these measures are even more affected in the presence of VSN. Interestingly, previous studies suggested that cancellation tasks with invisible markings (i.e. our task for visual search) are more sensitive in detecting VSN. The current data suggest that this can be explained by a lower SWM capacity in VSN patients: the invisibility of the markings requires more SWM capacity to keep track of all previous markings.
Disorganized visual search in VSN is also observed with behavioral tasks other than cancellation tasks (Kristjánsson & Vuilleumier, Citation2010; Mannan et al., Citation2005; Ptak et al., Citation2007). It could therefore be that disorganized search is a common exemplar of impaired SWM (Ten Brink et al., Citation2016), whereas the lateralized omission difference is representative of the lateralized attentional deficit – the core symptom of VSN. Indeed, problems in visual search seem to be different from the presence of VSN (Ten Brink et al., Citation2018). Here, we observed a relation between SWM performance and the number of revisits: low SWM thresholds correlates with higher number of revisits. Thus, although SWM seems to be impaired in most VSN patients, lower SWM performance also affects search performance in patients without VSN.
One consideration that we cannot fully exclude is the possibility that patients with SWM impairments have low level visual deficits, such as scotoma’s or low visual acuity somewhere along the vertical axis. When either Target 1 or Target 2 of the SWM task was presented in the impaired visual field, the patient would have missed one of the two targets, and would consequently have to guess the direction of the displacement. The final score would thus not reflect the ability to represent spatial information in working memory, but rather whether the patient had seen the two stimuli in the first place. However, although visual field impairments might explain the SWM threshold, it is unclear how this would explain the relation between search behavior and SWM thresholds. Visual search typically adapts fast after a visual field defect, within a few minutes after onset of simulated hemianopia, which likely parallels actual hemianopia (Simpson, Abegg, & Barton, Citation2011). The patients in this study were tested several weeks after stroke onset, making it likely that their visual search strategy has already adapted to any visual field defects.
Another limitation of the current dataset is that we did not monitor eye-movements. Although we designed the SWM task such that between the presentation of the two stimuli, attention would be attracted to the fixation point, it could be that different strategies were employed by different participants. For example, when a participant kept fixating the location of the first stimulus – despite the instruction to maintain fixation at the central fixation point – it would have been easier to make the spatial discrimination because the second stimulus would be presented closer to the fovea where visual acuity is higher.
To summarize, we showed that SWM performance can be assessed easily with a brief, staircased discrimination task in stroke patients in a clinical setting. Performance on this SWM task correlates with visual search behavior as assessed with a cancellation task with invisible markings. Although we could recommend using the same or a similar SWM task in the clinical assessment of VSN or in VSN research, we would prioritize two other possibilities. Given the relationship between SWM performance and search behavior, we think it would be most informative to combine a standard cancellation task with eye-tracking, because eye movements reflect search behavior directly. However, this option is only viable when eye-tracking does not increase test duration too extensively and is compatible with the patient’s physical status. The next best option is the cancellation task with invisible markings. As demonstrated here and elsewhere, a cancellation task without visible markings provides a better insight into the search behavior of a participant compared to a cancellation task with visible markings, which in turn is related to the SWM performance (Wojciulik, Rorden, Clarke, Husain, & Driver, Citation2004). The SWM discrimination task that we developed here is a direct measure of SWM performance, which could be a useful addition to neuropsychological assessments when a specific question concerning SWM is at hand. Moreover, the task is brief, easy to administer and could be implemented on any standard computer or tablet, which makes it suitable for clinical settings where testing time is limited.
The current results corroborate a series of findings of earlier experiments that demonstrated a relationship between VSN and SWM performance, where more severe VSN being related to lower SWM performance (Ferber & Danckert, Citation2006; Malhotra et al., Citation2005, Citation2004; Pisella et al., Citation2004; Ravizza et al., Citation2005; Wansard et al., Citation2015, Citation2014). Together, the previous studies and our current dataset suggest that (1) VSN is best regarded as a syndrome comprising both a lateralized attention impairment and a non-lateralized SWM impairment (Husain & Rorden, Citation2003) and (2) SWM impairments are associated with disorganized search (Husain et al., Citation2001; Wojciulik et al., Citation2001).
CEN-OA_19-135-File010.docx
Download MS Word (81 KB)Acknowledgments
We thank Marit Dorresteijn for assistance with the data collection
Disclosure statement
No potential conflict of interest was reported by the authors.
Supplementary material
Supplemental data for this article can be accessed here.
Additional information
Funding
Related Research Data
References
- Appelros, P., Karlsson, G. M., Seiger, Å., & Nydevik, I. (2002). Neglect and anosognosia after first-ever stroke: Incidence and relationship to disability. Journal of Rehabilitation Medicine, 34(5), 215–220.
- Azouvi, P., Samuel, C., Louis-Dreyfus, A., Bernati, T., Bartolomeo, P., Beis, J. M., … Rousseaux, M. (2002). Sensitivity of clinical and behavioural tests of spatial neglect after right hemisphere stroke. Journal of Neurology, Neurosurgery and Psychiatry, 73, 160–166.
- Behrmann, M., Watt, S., Black, S. E., & Barton, J. J. (1997). Impaired visual search in patients with unilateral neglect: An oculographic analysis. Neuropsychologia, 35(11), 1445–1458. Retrieved from http://www.ncbi.nlm.nih.gov/pubmed/9352522
- Benjamins, J. S., Dalmaijer, E. S., Ten Brink, A. F., Nijboer, T. C. W., & Van der Stigchel, S. (2018). Multi-target visual search organisation across the lifespan: Cancellation task performance in a large and demographical stratified sample of healthy adults. Aging, Neuropsychology, and Cognition. doi:10.1101/307520
- Bisiach, E., & Vallar, G. (1988). Hemineglect in humans. In G. Rizzolatti (Ed.), Handbook of neuropsychology (1st ed., pp. 195–222). New York, NY: Elsevier Science.
- Buxbaum, L. J., Ferraro, M. K., Veramonti, T., Farne, A., Whyte, J., Ladavas, E., … Coslett, H. B. (2004). Hemispatial neglect: Subtypes, neuroanatomy, and disability. Neurology, 62(5), 749–756.
- Dalmaijer, E. S., Van der Stigchel, S., Nijboer, T. C. W., Cornelissen, T. H. W., & Husain, M. (2015). CancellationTools: All-in-one software for administration and analysis of cancellation tasks. Behavior Research Methods, 47(4), 1065–1075.
- Eglin, M., Robertson, L. C., & Knight, R. T. (1989). Visual search performance in the neglect syndrome. Journal of Cognitive Neuroscience, 1(4), 372–385.
- Ferber, S., & Danckert, J. (2006). Lost in space - The fate of memory representations for non-neglected stimuli. Neuropsychologia, 44(2), 320–325.
- Ferber, S., & Karnath, H.-O. (2001). How to assess spatial neglect - line bisection or cancellation tasks? Journal of Clinical and Experimental Neuropsychology, 23(5), 599–607.
- Gandola, M., Toraldo, A., Invernizzi, P., Corrado, L., Sberna, M., Santilli, I., … Paulesu, E. (2013). How many forms of perseveration? Evidence from cancellation tasks in right hemisphere patients. Neuropsychologia, 51(14), 2960–2975.
- Heilman, K. M., Valenstein, E., & Watson, R. T. (2000). Neglect and related disorders. Seminars in Neurology, 20(4), 463–470.
- Hoeting, J. A., Madigan, D., Raftery, A. E., & Volinsky, C. T. (1999). Bayesian model averaging: A tutorial. Statistical Science, 14(4), 382–417.
- Husain, M., Mannan, S. K., Hodgson, T. L., Wojciulik, E., Driver, J., & Kennard, C. (2001). Impaired spatial working memory across saccades contributes to abnormal search in parietal neglect. Brain, 124, 941–952. Retrieved from http://www.ncbi.nlm.nih.gov/pubmed/11335696
- Husain, M., & Rorden, C. (2003). Non-spatially lateralized mechanisms in hemispatial neglect. Nature Reviews Neuroscience, 4, 26–36.
- Jeffreys, H. (1961). Theory of probability (3rd ed.). Oxford: Oxford University Press.
- Kass, R. E., & Raftery, A. E. (1995). Bayes factors. Journal of American Statistical Association, 90(430), 773–795.
- Kesten, H. (1958). Accelerated stochastic approximation. The Annals of Mathematical Statistics, 90(430), 773–795.
- Kinsbourne, M. (1987). Mechanisms of unilateral neglect. In M. Jeannerod (Ed.), Advances in psychology (pp. 69–86). doi:10.1016/S0166-4115(08)61709-4
- Kristjánsson, Á., & Vuilleumier, P. (2010). Disruption of spatial memory in visual search in the left visual field in patients with hemispatial neglect. Vision Research, 50(14), 1426–1435.
- Malhotra, P., Jäger, H. R., Parton, A., Greenwood, R., Playford, E. D., Brown, M. M., … Husain, M. (2005). Spatial working memory capacity in unilateral neglect. Brain, 128, 424–435.
- Malhotra, P., Mannan, S., Driver, J., & Husain, M. (2004). Impaired spatial working memory: One component of the visual neglect syndrome. Cortex, 40, 667–676.
- Mannan, S. K., Mort, D. J., Hodgson, T. L., Driver, J., Kennard, C., & Husain, M. (2005). Revisiting previously searched locations in visual neglect: Role of right parietal and frontal lesions in misjudging old locations as new. Journal of Cognitive Neuroscience, 17(2), 340–354.
- Mark, V. W., Woods, A. J., Ball, K. K., Roth, D. L., & Mennemeier, M. (2004). Disorganized search on cancellation is not a consequence of neglect. Neurology, 63, 78–84.
- Morey, R. D., Rouder, J. N., & Jamil, T. (2015). BayesFactor: Computations of Bayes factors for common designs.R package, version 0.9.12-4.2
- Nijboer, T. C. W., Kollen, B. J., & Kwakkel, G. (2013). Time course of visuospatial neglect early after stroke: A longitudinal cohort study. Cortex, 49(8), 2021–2027.
- Nijboer, T. C. W., van de Port, I., Schepers, V., Post, M., & Visser-Meily, J. M. A. (2013). Predicting functional outcome after stroke: The influence of neglect on basic activities in daily living. Frontiers in Human Neuroscience, 7, 1–6.
- Paladini, R. E., Wyss, P., Kaufmann, B. C., Urwyler, P., Nef, T., Cazzoli, D., … Müri, R. M. (2019). Re-fixation and perseveration patterns in neglect patients during free visual exploration. European Journal of Neuroscience, 49(10), 1244–1253.
- Parton, A., Malhotra, P., Nachev, P., Ames, D., Ball, J., Chataway, J., & Husain, M. (2006). Space re-exploration in hemispatial neglect. Neuroreport, 17(8), 833–836.
- Pisella, L., Berberovic, N., & Mattingley, J. B. (2004). Impaired working memory for location but not for colour or shape in visual neglect: A comparison of parietal and non-parietal lesions. Cortex, 40(2), 379–390.
- Ptak, R., Schnider, A., Golay, L., & Müri, R. (2007). A non-spatial bias favouring fixated stimuli revealed in patients with spatial neglect. Brain, 130(12), 3211–3222.
- Ravizza, S. M., Behrmann, M., & Fiez, J. A. (2005). Right parietal contributions to verbal working memory: Spatial or executive? Neuropsychologia, 43(14), 2057–2067.
- Ronchi, R., Posteraro, L., Fortis, P., Bricolo, E., & Vallar, G. (2009). Perseveration in left spatial neglect: Drawing and cancellation tasks. Cortex, 45(3), 300–312.
- Rouder, J. N., Morey, R. D., Verhagen, J., Swagman, A. R., & Wagenmakers, E.-J. (2016). Bayesian analysis of factorial designs. Psychological Methods. doi:10.1037/met0000057
- Shimozaki, S. S., Hayhoe, M. M., Zelinsky, G. J., Weinstein, A., Merigan, W. H., & Ballard, D. H. (2003). Effect of parietal lobe lesions on saccade targeting and spatial memory in a naturalistic visual search task. Neuropsychologia, 41(10), 1365–1386.
- Simpson, S. A., Abegg, M., & Barton, J. J. (2011). Rapid adaptation of visual search in simulated hemianopia. Cerebral Cortex, 21(7), 1593–1601.
- Solomon, T. M., DeBros, G. B., Budson, A. E., Mirkovic, N., Murphy, C. A., & Solomon, P. R. (2014). Correlational analysis of 5 commonly used measures of cognitive functioning and mental status: An update. American Journal of Alzheimer’s Disease and Other Dementias, 29(8), 718–722.
- Striemer, C. L., Ferber, S., & Danckert, J. (2013). Spatial working memory deficits represent a core challenge for rehabilitating neglect. Frontiers in Human Neuroscience, 7, 1–11.
- Ten Brink, A. F., Biesbroek, M. J., Kuijf, H. J., Van der Stigchel, S., Oort, Q., Visser-Meily, J. M. A., & Nijboer, T. C. W. (2016). The right hemisphere is dominant in organization of visual search-A study in stroke patients. Behavioural Brain Research, 304, 71–79.
- Ten Brink, A. F., van der Stigchel, S., Visser-Meily, J. M. A., & Nijboer, T. C. W. (2016). You never know where you are going until you know where you have been: Disorganized search after stroke. Journal of Neuropsychology, 10(2), 256–275.
- Ten Brink, A. F., Visser-Meily, J. M. A., & Nijboer, T. C. W. (2018). What does it take to search organized? The cognitive correlates of search organization during cancellation after stroke. Journal of the International Neuropsychological Society, 24(5), 424–436.
- Treutwein, B. (1995). Minireview: Adaptive psychophysical procedures. Vision Research, 35(12), 2503–2522.
- Van Der Stoep, N., Visser-Meily, J. M. A., Kappelle, L. J., De Kort, P. L. M., Huisman, K. D., Eijsackers, A. L. H., … Nijboer, T. C. W. (2013). Exploring near and far regions of space: Distance-specific visuospatial neglect after stroke. Journal of Clinical and Experimental Neuropsychology, 35(8), 799–811.
- Wansard, M., Bartolomeo, P., Bastin, C., Segovia, F., Gillet, S., Duret, C., & Meulemans, T. (2015). Support for distinct subcomponents of spatial working memory: A double dissociation between spatial–Simultaneous and spatial–Sequential performance in unilateral neglect. Cognitive Neuropsychology, 32(1), 14–28.
- Wansard, M., Meulemans, T., Gillet, S., Segovia, F., Bastin, C., Toba, M. N., & Bartolomeo, P. (2014). Visual neglect: Is there a relationship between impaired spatial working memory and re-cancellation? Experimental Brain Research, 232(10), 3333–3343.
- Wojciulik, E., Husain, M., Clarke, K., & Driver, J. (2001). Spatial working memory deficit in unilateral neglect. Neuropsychologia, 39(4), 390–396.
- Wojciulik, E., Rorden, C., Clarke, K., Husain, M., & Driver, J. (2004). Group study of an “undercover” test for visuospatial neglect: Invisible cancellation can reveal more neglect than standard cancellation. Journal of Neurology, Neurosurgery and Psychiatry, 75(9), 1356–1358.