
 ?Mathematical formulae have been encoded as MathML and are displayed in this HTML version using MathJax in order to improve their display. Uncheck the box to turn MathJax off. This feature requires Javascript. Click on a formula to zoom.
ABSTRACT
Introduction
Numerous tests of visuo-spatial neglect (VSN) have been developed. In this study, we propose a clustering of VSN tests by making a distinction between static tests with low levels of cognitive demand (i.e. tests without movement or time-restrictions, such as paper-and-pencil tests) and dynamic tests with high levels of cognitive demand (i.e. tests incorporating movement and time-restrictions, such as virtual reality tests). The concepts of static and dynamic tests have not been systematically investigated so far. Here, we investigated (1) whether we would find dissociations between patients showing VSN on test within the static cluster but not on tests within the dynamic cluster, and vice versa; (2) whether differences in demographic or clinical characteristics could be identified between these groups of patients; and (3) whether the underlying factor structure would correspond to our proposed distinction between static and dynamic clusters of tests.
Method
Sixty-one patients with VSN completed three static tests (shape cancellation, line bisection, letter cancellation) and three dynamic tests (Catherine Bergego Scale, Mobility Assessment Course, simulated driving test).
Results
Thirteen percent of patients showed VSN on tests within the static cluster, 33% on tests within the dynamic cluster, and 54% on tests within both clusters. Patients with VSN on the dynamic tests (alone or in addition to static tests) had poorer motor function, poorer walking abilities and were more dependent in daily life than patients showing VSN on the static cluster alone. The underlying factor structure corresponded to our proposed conceptual distinction between static and dynamic clusters of tests.
Conclusions
Static and dynamic tests compose different clusters and double dissociations are shown between clusters. Future research involving data-driven approaches might result in a better understanding on how different tests of VSN relate to each other, and, more importantly, a better understanding of VSN and its phenotypes.
Introduction
Patients with visuo-spatial neglect (VSN) fail to attend stimuli presented at the contralesional side of space (Buxbaum et al., Citation2004; Heilman et al., Citation2000). These patients manifest symptoms such as bumping into doorframes, eating food from only one side of their plate, and ignoring people who are located at their contralesional side (Corbetta, Citation2014). VSN is known to negatively affect rehabilitation outcomes, such as functional recovery (Nijboer et al., Citation2013), motor recovery (Nijboer, Kollen et al., Citation2014), and reintegration into the community (Chen et al., Citation2015). In general, patients with VSN require more help and ongoing assistance from caregivers, which increases caregivers’ burden and stress levels (Bosma et al., Citation2019; Chen et al., Citation2017). Given its negative effect, early detection of VSN is crucial to start appropriate treatment.
A clinical assessment is needed to objectify the presence and severity of VSN (Azouvi et al., Citation2006). VSN is usually assessed with neuropsychological paper-and-pencil tests, such as cancellation, line bisection, and copying tests. Previous research has reported a lack of ecological validity, since the level of cognitive demand in paper-and-pencil tests does not resemble the high level of cognitive demand of daily life (Azouvi, Citation2017; Tsirlin et al., Citation2009). Cognitive demand refers to the level of cognitive resources that are required to execute a task, which varies as a function of task complexity (Tsaparli, Citation2014). Task complexity can be directly related to task features that increase information load, information diversity, or rate of information change (Campbell, Citation1988; Liu & Li, Citation2012). For more complex tasks, patients are required to invest more cognitive resources during task performance. In paper-and-pencil tests, there are no changing stimuli, external distractions, or time-restrictions, which emphasizes the “static” nature and the low level of cognitive demand in these tests (Pedroli et al., Citation2015; Ten Brink et al., Citation2018).
To improve ecological validity, dynamic tests have been developed to relate to the level of cognitive demand of daily life (Blini et al., Citation2016; Bonato, Citation2012; Bonato et al., Citation2010). In this study, we consider tests to be “dynamic” when stimuli change as a patient moves through an environment, when performance is time-bound, and/or when a patient is required to multitask (Bonato, Citation2012; Spreij et al., Citation2020; Ten Brink et al., Citation2018). When patients are moving, there is more attentional competition between stimuli at the ipsilesional versus the contralesional side of space than in a motionless situation (Bonato, Citation2012). There is little time to attend to objects as stimuli are on the retina for a short amount of time, and there is strong competition between objects that draw attention. Patients with VSN will, consequently, have more difficulties disengaging attention from the ipsilesional side to attend the contralesional side (Rengachary et al., Citation2009; Ten Brink et al., Citation2018). Observational scales, such as the Catherine Bergego Scale (CBS), can be considered dynamic, as they provide a systematic evaluation of VSN behavior during activities of daily living (ADL) in a real-life setting (Azouvi et al., Citation2003; Ten Brink et al., Citation2013). An example of an objective quantified test is the Mobility Assessment Couse (MAC), where participants navigate through a hallway while searching for targets (Grech et al., Citation2017; Ten Brink et al., Citation2018; Verlander et al., Citation2000). An additional advantage of the MAC is that patients are required to perform several operations at once (navigating and searching), which makes a test like the MAC even more demanding than for example, a cancellation test, where searching for targets is the only required operation (Blini et al., Citation2016; Bonato et al., Citation2010). Multitasking may lead to competition for cognitive resources (Künstler et al., Citation2018; Rengachary et al., Citation2009; Schaefer, Citation2014; Ten Brink et al., Citation2018), and performance will suffer when attentional abilities are weakened (Bonato, Citation2012, Citation2015; Bonato et al., Citation2010). Finally, Virtual Reality has been used to assess VSN in a controlled environment that simulates daily life situations (Pallavicini et al., Citation2015; Tsirlin et al., Citation2009). For example, we have used a simulated driving test to assess VSN (Spreij et al., Citation2020).
Numerous tests of VSN have been developed, varying in level of cognitive demand. In this study, we propose making a distinction between static tests, with low levels of cognitive demand, and dynamic tests, with high levels of cognitive demand. It is not simply the case that dynamic tests are more challenging than static tests, as extensive research has showed dissociations between performances on static versus dynamic tests (Azouvi, Citation2002; Azouvi et al., Citation2006; Grattan & Woodbury, Citation2017; Hamilton et al., Citation2008). For example, patients may show VSN on the MAC or a Virtual Reality test, but not on a cancellation test, and vice versa (Azouvi et al., Citation2006; Grech et al., Citation2017; Peskine et al., Citation2011; Spreij et al., Citation2020; Ten Brink et al., Citation2018). These dissociations suggest a conceptual distinction between static and dynamic tests – two concepts that are often used by clinicians and researchers to describe VSN assessments (e.g., Deouell et al., Citation2005; Smit et al., Citation2013; Spreij et al., Citation2020; Ten Brink et al., Citation2018; Toglia & Cermak, Citation2009). However, these concepts have not been systematically investigated in a large cohort of VSN patients with multiple tests. To gain a better understanding in this matter, we propose a clustering of VSN tests by making a distinction between static tests and dynamic tests. We hypothesized to find dissociations between patients showing VSN on tests within the static cluster but not on tests within the dynamic cluster, and vice versa. We evaluated whether differences in demographic or clinical characteristics could be identified between these groups of patients. Finally, we hypothesized that in case tests from the same cluster were part of the same concept (static versus dynamic), the underlying factor structure would correspond to our proposed distinction between static and dynamic clusters of tests.
Materials and methods
Participants
A total of 70 stroke patients were included in a randomized control trial, investigating prism adaptation in rehabilitation (#NTR3278; approved by the Medical Ethical Committee of the University Medical Center Utrecht and De Hoogstraat Rehabilitation Center, #12-183/O) (Ten Brink et al., Citation2015). Inclusion criteria for the randomized controlled trial were: (1) clinically diagnosed stroke (confirmed by a MRI or CT scan); (2) indication of VSN based on the performance on the shape cancellation, line bisection and/or CBS; (3) age between 18 and 85 years old; and (4) sufficient comprehension and communication (evaluated by a neuropsychologist). Exclusion criteria were: (1) interfering psychiatric disorders and/or substance abuse; (2) expected discharge <4 weeks; and (3) physically or mentally unable to participate (evaluated by a rehabilitation physician). Written informed consent was obtained from all patients. The experiment was performed in accordance with the Declaration of Helsinki.
In order to compute z-scores of the patients’ test performances, we recruited healthy controls (for the shape cancellation, line bisection, letter cancellation, MAC and simulated driving test) and stroke patients without VSN (for the CBS) as control groups. We used stroke patients without VSN as control group for the CBS, since the comparison between patients with and without VSN provides information on the role of VSN on ADL. The inclusion criteria for the healthy controls were (1) aged between 18–80 years old; and (2) no history of neurological and/or psychiatric disorders. The inclusion criteria for the stroke patients without VSN were: (1) clinical diagnosed stroke (confirmed by a MRI or CT scan); (2) aged between 18 and 80 years old; and (3) no indication of VSN based on the shape cancellation and/or CBS.
Tests and outcome measures
The baseline measurement of the randomized control trial consisted of three static tests (shape cancellation, line bisection, letter cancellation) and three dynamic tests (CBS, MAC, simulated driving test). The test session lasted ±60 minutes in total.
Static VSN tests
The static tests (shape cancellation, line bisection, letter cancellation) were administered using a 22-inch interactive WACOM (PL2200) tablet screen (1920 × 1080), with a screen size of 477.64 mm × 268.11 mm (Smit et al., Citation2013). The tablet screen was oriented horizontally and slightly tilted with an angle of 18 degrees. Participants were seated in front of the tablet screen at a distance of approximately 30 cm. They had to respond to the stimuli by drawing on the screen with a digital stylus. DiagnoseIS (developed by Metrisquare, the Netherlands) was used to program the static tests.
Shape Cancellation. The digitized shape cancellation consisted of 56 targets (small shapes) and 75 distractors in different sizes (shapes, letters, and words). Two targets in the center were marked by the researcher as part of the instruction. Patients were instructed to designate the remaining 54 targets (27 left, 27 right) and tell the examiner when they had completed the test. No time limit was given. The asymmetry score was calculated (number of missed targets on the right – number of missed targets on the left). As left-sided VSN would result in a negative value and right-sided VSN in a positive value, the absolute value was used in order to be able to compare patients with left- and right-sided VSN. The range of the absolute asymmetry score was between 0 (equal number of missed targets on the left and right side) and 27 (27 missed targets on one side and 0 missed targets on the other side). We used the average asymmetry score (0.32) and standard deviation (0.57) of 22 healthy controls to compute z-scores.
Line Bisection. The digitized line bisection test was based on the Behavioral Inattention Test (Wilson et al., Citation1987), where each patient was presented with three horizontal lines (320 mm each; 1 mm thick) that were displayed in a staircase fashion. This subtest of the BIT was administered twice. Patients were instructed to mark the midpoint of each line. We measured the deviations from the true midpoint (deviations to left scored as negative; deviations to the right as positive). Next, the average deviation of the six lines was calculated and computed to an absolute score. The maximum deviation was 160 mm (320 mm deviated by 2). We used the average deviation (4.82 mm) and standard deviation (4.05 mm) of 22 healthy controls to compute z-scores.
Letter cancellation
The digitized letter cancellation consisted of 5 rows of 34 letters (170 letters in total) (Smit et al., Citation2013). Participants were instructed to cancel the target letters “E” and “R” (20 left, 20 right), which were randomly placed between the distractor letters. The asymmetry score was calculated (number of missed targets on the right – number of missed targets on the left). As left-sided VSN would result in a negative value and right-sided VSN in a positive value, the absolute value was used. The range of the absolute asymmetry score was between 0 (equal number of missed targets on the left and right side) and 20 (20 missed targets on one side and 0 missed targets on the other side). We used the average asymmetry score (0.36) and standard deviation (0.66) of 22 healthy controls to compute z-scores.
Dynamic VSN tests
Catherine Bergego Scale. The CBS is an observation scale to assess VSN behavior during ADL (Azouvi, Citation2002). The nursing staff observed and rated behavior during 10 activities (e.g., dressing or eating), providing a score of 0 (no VSN) to 3 (severe VSN) per item. Items that were missing (e.g., due to the inability to independently perform an activity or when a situation was not observed) were considered invalid. The total score was the sum of the valid item scores, divided by the number of valid items, multiplied by 10 (resulting in a total score ranging from 0 [no VSN] to 30 [severe VSN]). To compute z-scores, we used the average score (1.03) and standard deviation (2.08) of 58 stroke patients without VSN.
Mobility assessment course
The MAC is a visual search test that is conducted in a corridor (A. F. Ten Brink et al., Citation2018). Participants were instructed to follow 5 directional indicators and find 24 targets (yellow squares, 10 cm × 10 cm) attached to the wall (12 left, 12 right). We corrected for targets that were invisible (i.e., targets obstructed by an object or person), by dividing the number of omissions by the number of visible targets, and multiply this by the total number of targets. The asymmetry score was calculated (number of missed targets on the right – number of missed targets on the left). As left-sided VSN would result in a negative value and right-sided VSN in a positive value, the absolute value was used. The range of the absolute asymmetry score was between 0 (equal number of missed targets on the left and right side) and 12 (12 missed targets on one side and 0 missed targets on the other side). We used the average asymmetry score (0.89) and standard deviation (0.80) of 31 healthy controls to compute z-scores.
Simulated driving test
The simulated driving test (Spreij et al., Citation2020) consisted of a straight road without intersections or oncoming traffic projected on a large screen (2.13 m × 3.18 m). A steering wheel was fixed on a table at a distance of 90 cm from the projection screen. Participants were instructed to maintain their starting position (the center of the right lane) by using the steering wheel. Participants needed to adjust their position as they were “blown” of track due to “side wind” manipulations from both directions. The total test took 2 minutes. Outcome measures consisted of the average position on the road for every 15 seconds (resulting in 8 values in total). The total range of position was between −600 (the left verge) and up to 200 (the right verge), with 0 indicating the center of the right lane. We computed the absolute average deviation from 0, based on the 8 values. We used the average deviation (27.03) and standard deviation (26.70) of 36 healthy controls to compute z-scores.
Demographic and clinical characteristics
We collected data on sex, age, and level of education from the medical files. Level of education was assessed by using a Dutch classification system (Verhage, Citation1965) that consists of 7 levels, with 1 being the lowest (less than primary school) and 7 being the highest (academic degree). These levels were converted into three categories for analysis: low (Verhage 1–4), average (Verhage 5), and high (Verhage 6–7). This Dutch classification system is the most commonly used system in the Netherlands and is similar to the International Standard Classification of Education (UNESCO, Citation1997).
We extracted stroke type (ischemic, hemorrhage, or cerebral ischemia after subarachnoid hemorrhage), lesion side (left, right, both), and number of days post-stroke onset from the medical files. VSN has been associated with slower and poorer recovery patterns of motor impairment (Nijboer, Kollen et al., Citation2014; Katz et al., Citation1999), as well as limitations in ADL (Bosma et al., Citation2019; Nijboer et al., Citation2013; Katz et al., Citation1999), postural imbalance (Nijboer, Ten Brink et al., Citation2014; Van Nes et al., Citation2009), and walking disabilities (Nijboer et al., Citation2013). We extracted the scores on several clinical variables that were administered at admission to test the association between motor impairment and VSN. Independence during ADL was measured with the Barthel Index (Collin et al., Citation1988). Motor strength of upper and lower extremities was measured with the Motricity Index (Collin & Wade, Citation1990). Independence during walking was measured with the Functional Ambulation Classification (Holden et al., Citation1984). Communication skills were measured with the Stichting Afasie Nederland test (Deelman et al., Citation1981).
We extracted scores on cognitive tests from the medical files, which were administered as part of a neuropsychological assessment as care as usual. Global cognitive functioning was measured with the Montreal Cognitive Assessment (MoCA) (Nasreddine et al., Citation2005) or the Mini Mental State Examination (MMSE) (Folstein et al., Citation1975). In order to create one score for global cognitive functioning, the MMSE score was converted into a MoCA score by using the following formula: MoCA = (1.124 × MMSE) – 8.165 (Solomon et al., Citation2014). In addition, memory function was measured with the Rey Auditory Verbal Learning Test (Rey, Citation1941), and executive functions were measured with the Tower Test (Delis et al., Citation2007).
Statistical analyses
Categorizing patients based on their performances on VSN tests
We translated the raw scores of each test into standardized z-scores using the following formulae: . The average score and standard deviation were based on the performance of healthy controls (shape cancellation, line bisection, letter cancellation, MAC and simulated driving test) or stroke patients without VSN (CBS). We averaged the z-scores of the static tests (shape cancellation, line bisection, letter cancellation) and the z-scores of the dynamic tests (CBS, MAC, simulated driving) to compute scores per cluster. We considered an average z-score of above 2 to be indicative for VSN. An average z-score of multiple tests provides the most reliable indication of a deficit, as each test is taken equally into account (Evans, Citation1996). Based on the average z-scores, patients were categorized as: (1) patients showing VSN on tests within the static cluster and not within the dynamic cluster; (2) patients showing VSN on tests within the dynamic cluster and not within the static cluster; and (3) patients showing VSN on tests within both the static and dynamic cluster. We provided the percentage of patients per group. Patients were excluded when (1) data was missing on more than one static or dynamic test; and (2) they did not show VSN in both clusters (defined as an average z-score below 2 on tests within the static and dynamic cluster) during the baseline measurement (approximately two weeks after the VSN screening).
Comparison of demographic and clinical characteristics between the groups
We compared demographic and clinical characteristics between the three groups using non-parametric tests (Kruskal–Wallis non-parametric ANOVA and post-hoc Mann–Whitney U tests for continuous variables, and Chi-square test for categorical variables). Effect sizes were calculated for the Mann–Whitney U tests by using Pearson’s correlation coefficient (r). While the Bonferroni correction is the best-known method to counteract the problem for multiple comparisons, this correction results quickly in disregarding significant observations (Rothman, Citation1990; Simes, Citation1986). Therefore, a Benjamini-Hochberg correction was applied, which is considered the best approach in exploratory research (Benjamini & Hochberg, Citation1995; Thissen et al., Citation2002). The false discovery rate was set at.1 (Appendix 1a, b).
Factor structure underlying performances on VSN tests: Static and dynamic clusters
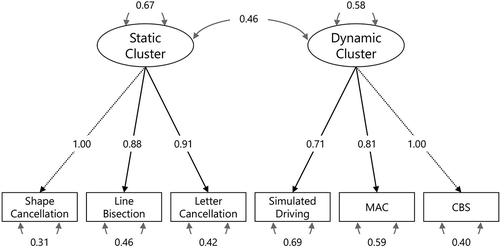
A Confirmatory Factor Analysis (CFA) was performed, using the lavaan R package (Rosseel, Citation2012), to confirm whether the underlying factor structure would correspond to our proposed distinction between static and dynamic clusters of tests. CFA explicitly tests a priori hypotheses about relations between observed variables (e.g., test scores) and an underlying factor structure (Jackson et al., Citation2009). We hypothesized that in case tests from the same cluster were part of the same concept (static versus dynamic), the data would be more consistent with a two-factor model than with an one-factor model. In an one-factor model, we assumed that there was one general factor underlying all test scores. In a two-factor model, we hypothesized that there were two factors underlying the test scores, namely the shape cancellation asymmetry score (absolute), line bisection averaged deviation score (absolute) and the letter cancellation asymmetry score (absolute) loading on the static cluster factor, and the CBS total score, MAC asymmetry score (absolute), and the average position on the road during simulated driving (absolute) loading on the dynamic cluster factor.
After estimating the two models, we performed a likelihood ratio test to compare how consistent each of these models are with the observed data. We also computed a Chi-square goodness-of-fit test (χ2) to test the consistency of the data with the proposed models. Four further fit indices were used to evaluate the models: Root Mean Square Error of Approximation (RMSEA), Standardized Root Mean Square Residual (SRMR), Comparative Fit Index (CFI), and the Tucker-Lewis index (TLI). A RMSEA and SRMR of ≤ .08 are usually considered adequate fit, and a CFI and TLI of ≥ .95 are considered good fit (Hooper et al., Citation2008). We used Full Information Maximum Likelihood (FIML) for missing data, which estimates the missing values based on the data.
Results
For the current study, 9 patients were excluded based on the following criteria: (1) no data on more than one static test or more than one dynamic test (n = 1); (2) the average z-score on tests within the static and dynamic cluster was below 2, which was indicative for no VSN (n = 8). In total, 61 patients were included.
Categorizing patients based on their performances on VSN tests
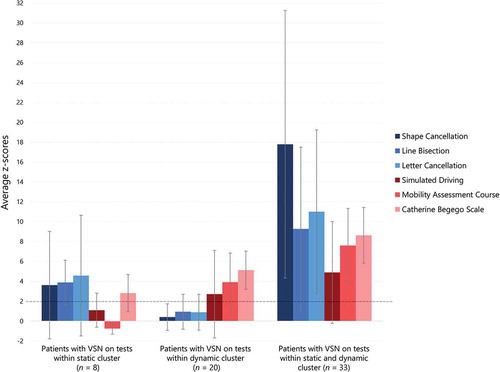
Based on the performances on tests within the static cluster and dynamic cluster, we found that 13% of patients (n = 8) showed VSN on tests within the static cluster alone, 33% of patients (n = 20) showed VSN on tests within the dynamic cluster alone, and 54% of the patients (n = 33) showed VSN on tests within both the static and dynamic cluster. The z-scores for each individual test are presented per group in . The average z-scores per cluster are presented in .
Table 1. Demographic and clinical characteristics split per group.
Figure 1. On the x-axis the three groups are depicted: (1) patients with visuo-spatial neglect (VSN) on tests within the static cluster alone; (2) patients with VSN on tests within the dynamic cluster alone; and (3) patients with VSN on tests from both the static and dynamic cluster. On the y-axis the average z-scores on each individual VSN test (shape cancellation, line bisection, letter cancellation, CBS, MAC, simulated driving test) is depicted. An average z-score above two (indicated by the dotted line) was used as an indication for VSN. The error bars represent the variability (SD).
Comparison of demographic and clinical characteristics between the groups
There were no significant differences in sex, age, level of education, stroke type, lesion side, number of days post-stroke onset, global cognitive functioning, memory function or executive functions between the three groups (). We found significant differences in motor strength in upper and lower extremities, independence during ADL, and independence during walking between the three groups. Patients who showed VSN on tests within the dynamic cluster had less strength in both the upper (Appendix 1b; U = 8.00, z = − 2.69, p = .007, r = − .49) and lower extremities (U = 11.50, z = − 2.45, p = .014, r = − .45) compared to patients who showed VSN on tests within the static cluster only. Patients who showed VSN on tests within both the static and dynamic cluster had also less strength in the upper (U = 10.00, z = − 3.12, p = .002, r = − .49) and lower extremities (U = 12.00, z = − 2.94, p = .003, r = − .46) compared to patients who showed VSN on tests within the static cluster only, but not compared to patients who showed VSN on tests within the dynamic cluster only. Furthermore, patients who showed VSN on tests within the dynamic cluster were more dependent in ADL (U = 15.00, z = − 2.68, p = .007, r = − .49) compared to patients who showed VSN on tests within the static cluster. Patients who showed VSN on tests within both the static and dynamic cluster were also more dependent in ADL (U = 25.00, z = − 2.68, p = .007, r = − .42) than patients who showed VSN on the static cluster only, but not compared to patients who showed VSN on tests within the dynamic cluster only. Finally, patients who showed VSN on tests within the dynamic cluster were more dependent during walking (U = 39.00, z = − 2.12, p = .034, r = − .39) than patients who showed VSN on tests within the static cluster. Patients who showed VSN on tests within both the static and dynamic cluster were more dependent during walking (U = 57.50, z = − 2.42, p = .015, r = − .38) compared to patients who showed VSN on tests within the static cluster only, but not compared to patients who showed VSN on tests within the dynamic cluster only.
To summarize, patients who showed VSN on tests within the dynamic cluster (alone or in combination with the static cluster) had poorer motor function (upper and lower extremities), were more dependent in ADL, and more dependent during walking compared to patients who showed VSN on the static cluster only.
Factor structure underlying performances on VSN tests: Static and dynamic clusters
Results of the CFA showed that the static-dynamic factor model was significantly more consistent with the data than the general factor model (χ2(1) = 7.06, p = .008), which indicates that the underlying factor structure corresponds well to our proposed conceptual distinction between a static cluster of tests (shape cancellation, line bisection, letter cancellation) and a dynamic cluster of tests (CBS, MAC, simulated driving). All fit indices indicated excellent fit for the static-dynamic factor model: RMSEA .025 and SRMR .043 (smaller than .08), and CFI .997 and TLI .994 (larger than 0.95). The reliability of the static-dynamic factor model was considered high, since there were strong factor loadings (> .7) and the explained variances were > .3 for all tests. There was a moderate relation between the static and dynamic factors (estimated at .46, 95%CI [0.29, 0.63]), which is expected since all tests measured VSN. See for a graphical representation of the static-dynamic factor model.
Figure 2. A graphical representation of the static-dynamic factor model, supporting our proposed distinction between static and dynamic cluster of tests.
Discussion
In this study, we propose a clustering of VSN tests by making a distinction between static tests with low levels of cognitive demand and dynamic tests with high levels of cognitive demand. We investigated (1) whether we would find dissociations between patients showing VSN on test within the static cluster but not on tests within the dynamic cluster, and vice versa; (2) whether differences in demographic or clinical characteristics could be identified between these groups of patients; and (3) whether the underlying factor structure would correspond to our proposed distinction between static and dynamic clusters of tests.
Indeed, there were dissociations between patients who showed VSN on tests within the static cluster but not on tests within the dynamic cluster, and vice versa. The majority of the patients, namely 54%, showed VSN on tests within both clusters, 33% only on tests within the dynamic cluster, and 13% only on tests within the static cluster. In addition, confirmatory factor analyses showed that the underlying factor structure corresponds to our proposed conceptual distinction between static and dynamic clusters of tests. Our results indicated coherence among tests within the same cluster (static and dynamic), which might suggest that these manifestations represent different phenotypes of VSN. How can we explain these dissociations? Patients showing VSN on dynamic tests while performing well on static tests seems intuitive, because of the underlying assumption that attentional resources are limited. In the dynamic tests, changing surroundings and/or multitasking may lead to competition for cognitive resources (Künstler et al., Citation2018; Rengachary et al., Citation2009; Schaefer, Citation2014; Ten Brink et al., Citation2018), and performance will suffer when attentional abilities are weakened (Bonato, Citation2012, Citation2015; Bonato et al., Citation2010). The subset of patients who showed VSN on static tests only might be harder to explain. Possibly, these patients benefit from the dynamic nature of more ecological-valid tests, due to motivation or multisensory stimulation (Tinga et al., Citation2015). Another explanation might be a phenomenon known as stochastic resonance (Moss et al., Citation2004; Söderlund & Sikström, Citation2008). Hence, where some patients are disturbed by noise (external distractors) during cognitive tasks, others benefit from noise as it increases the level of arousal or general responsivity (Manly et al., Citation2002; Söderlund et al., Citation2007). Previous research in children propose a framework where attentional abilities are found to be the key factor to explain such differences (Söderlund et al., Citation2010, Citation2007). More attentive children are disturbed by noise, whereas inattentive children benefit from noise. The possibility that attention can be improved by the careful addition or reduction of external stimuli might be of great clinical significance. A similar framework for patients with VSN might have great impact in determining the appropriate rehabilitation approach.
We did not find differences in demographic or stroke characteristics between patients showing VSN on tests of different clusters. As for clinical characteristic, motor function (i.e., strength in upper and lower extremities, walking abilities, ADL dependence) was the only distinct factors between the patient groups, and was more impaired in patients who showed VSN on tests within the dynamic cluster (with or without VSN on test within the static cluster). Tests within the dynamic cluster do have stronger motor components compared to the paper-and-pencil tests within the static cluster, especially when it comes to motor strength. Even though motor impairment could hamper performance on a cancellation test, it is likely to have a larger impact on dressing (CBS) or moving through a corridor (MAC). Motor tasks require more attention when motor functions are impaired, which will likely compromise the simultaneous execution of a different task (e.g., detecting stimuli on the contralesional side of space) (Schaefer, Citation2014). For example, it is likely that attention for relevant stimuli while walking is lower for people who have motor impairment, as not falling or bumping has a higher priority. Our findings must be interpreted with caution given the small sample size of the group showing VSN on tests within the static cluster alone (n = 8). In addition, their z-score on the CBS was 2.82 (above the cutoff of 2, ), while their average z-score for the dynamic cluster was 1.06 (below the cutoff of 2, ) when taken the MAC and simulated driving test into account. This indicates that this group did not purely show VSN on static tests alone. However, we used the average z-scores as this is similar to clinical practice, where a cognitive deficit is never diagnosed based on the performance on one single test but instead, the complete picture of test results and observations is taken into account.
Strengths and limitations
A strength of this study is the large cohort of patients with VSN from whom we collected within-subject performances on an extensive selection of tests, including paper-and-pencil tests, an observational scale, a quantified test in a real-life environment, and a virtual reality test. A limitation of this study is the relatively selective sample of patients, namely patients who were admitted for inpatient rehabilitation care. In the Netherlands, patients are admitted to inpatient rehabilitation when a safe discharge to home is not achievable from the hospital within 5 days. Patients should, however, be vital enough to participate in multidisciplinary therapy. In general, this patient population is relatively young and moderately impaired. For this reason, the current results might not generalize to an older and/or more severely impaired population. Furthermore, our sample of patients received inpatient rehabilitation including VSN treatment (one hour visual scanning training per week combined with ongoing feedback of nurses, occupational and physical therapists to enhance attention to the neglected side). Since the test session was conducted two weeks after admission, (spontaneous) recovery or successfully applied compensation strategies might have affected test performances.
Note, that the number and position of lines used in a line bisection task vary between studies. The line bisection test in our study was based on the Behavioral Inattention Test (Wilson et al., Citation1987). Participants were asked twice to bisect three lines that were presented in a staircase fashion across the screen (from lower left to the upper right). Previous research has shown differences in visuospatial attention in the left versus the right hemispace (Kesayan et al., Citation2018; Ochando & Zago, Citation2018), as well as the upper versus the lower hemispace (Suavansri et al., Citation2012). In our study, we used the overall magnitude of the attentional bias (the average deviation of the six lines) without analyzing the performances per line. Furthermore, most patients used their dominant hand (85% dextral) to perform the static tests on the tablet, yet four patients (all dextral) used their non-dominant hand as their stroke affected their dominant hand. Previous studies on pseudoneglect in neurologically healthy participants showed that handedness affected bisection errors, with dextral participants deviating slightly further to the left than sinistral participants (Jewell & McCourt, Citation2000). Leftward bisection errors are even more substantial when dextral subjects use their left (non-dominant) hand (MacLeod & Turnbull, Citation1999; Ochando & Zago, Citation2018). However, effects of pseudoneglect in neurologically healthy participants are much smaller than effects of VSN after stroke and, therefore, we do not expect that the hand used to bisect affected our results.
Clinical implications
We already know from extensive research and clinical insights that VSN is not easily assessed nor that designing a VSN test battery is an easy job, due to its heterogenic nature, complex manifestations, and fluctuations over time and tests. Several reviews have been published discussing the assessment of VSN (Bowen et al., Citation1999; Menon & Korner-Bitensky, Citation2005; Plummer et al., Citation2003), its ecological validity (Azouvi, Citation2017), and the added value of computer-based testing (Schendel & Robertson, Citation2003) and Virtual Reality (Ogourtsova et al., Citation2017; Pedroli et al., Citation2015; Tsirlin et al., Citation2009). Consensus has only been reached on the fact that the assessment of VSN should always consist of several tests, as several tests are more likely to detect VSN. This study suggests the same, and again stresses the importance to include tests varying in levels of cognitive demand in order to capture VSN after stroke. Even though dynamic tests seem more challenging to be administered in patients with motor problems, it seems, based on our results, of great importance to test those patients in a dynamic manner. In patients with comorbidity, clinicians should administer VSN tests that specifically challenge the weakened abilities (e.g., motor, cognitive). Such tests would offer a more sensitive assessment of VSN in patients showing well-compensated or “recovered” VSN on static paper-and-pencil tests.
Future research
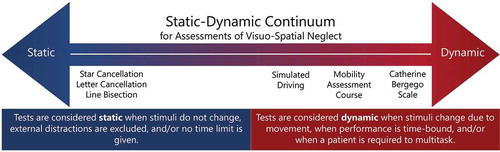
We defined cognitive demand as the level of cognitive resources that are required to execute a task, varying as a function of task complexity (Tsaparli, Citation2014). Task complexity can be directly related to task features that increase information load, information diversity, or rate of information change, which determines the required cognitive demands (Campbell, Citation1988; Liu & Li, Citation2012). Furthermore, it is useful to distinguish between the objective and subjective task complexity, where the latter is defined as a function of the interaction between the task and task performer characteristics (e.g., knowledge, skills) (Liu & Li, Citation2012). In this study, we did not directly investigate objective or subjective task complexity and the related cognitive demand. By using an experimental paradigm, future research should focus on investigating cognitive demand by applying a staircase procedure to determine a threshold level of individual cognitive demand per test. This would provide more insight in the subtle difference between static and dynamic tests regarding the level of cognitive demand. The concepts of static and dynamic tests might then better be represented on a static-dynamic continuum with on one side static tests and on the other side dynamic tests with increasing levels of cognitive demand ().
Figure 3. A hypothetical static-dynamic continuum of assessments of VSN with on the one side static tests with low levels of cognitive demands and on the other side dynamic tests with increasing levels of cognitive demand. Examples of tests used in the current study are shown on the continuum.
Furthermore, it might be useful to cluster tests of VSN based on other underlying concepts than the level of cognitive demand (e.g., clinical subtypes, involved cognitive processes). For instance, VSN is known as a heterogeneous syndrome involving different clinical subtypes that vary in modality (visual, auditory, or tactile), frame of reference (egocentric or allocentric) and region of space (personal, peripersonal or extrapersonal) (Corbetta, Citation2014; Rode et al., Citation2016; Van der Stoep et al., Citation2013). Another well-known theoretical distinction of VSN is the perceptual-attentional VSN (patients fail to attend contralesional stimuli) or action-intention VSN (patients who are aware of contralesional stimuli, but fail to act on these stimuli) (Bartolomeo et al., Citation1998). Each test targets a different clinical subtype, such as cancellation tests targeting peripersonal VSN and the CBS targeting peripersonal, extrapersonal as well as personal VSN (Azouvi et al., Citation2003; Menon & Korner-Bitensky, Citation2005; Ten Brink et al., Citation2016). Other underlying concepts might be the different types of cognitive processes that are involved during a test. For instance, line bisection requires patients to estimate the size of an object, regardless of their location in reference to the individual (allocentric processes), while cancellation tasks requires visual search within a display of various stimuli (egocentric processes) (Ferber & Karnath, Citation2001; Van der Stigchel & Nijboer, Citation2017). Furthermore, stimuli on the contralesional side might not be perceived when stimuli are presented simultaneously on the ipsilesional side (i.e., extinction, suppression/reciprocal inhibition hypothesis) (Heilman et al., Citation1984), which might be more often the case in dynamic tests due to more environmental distractors. Hence, the cognitive processes that are involved in our selection of static and dynamic tests differ between tests. Thus, even though we made clusters based on whether a test was static or dynamic, tests of VSN can also be clustered based on clinical subtypes or underlying cognitive processes that are involved while performing the tests. In a larger cohort of patients with VSN and by including more VSN tests, data-driven machine learning analyses might reveal which tests would cluster together. Data-driven analyses allow a generation of new hypotheses. This would aid clinicians to gain a better understanding on how different tests of VSN relate to each other, and more importantly, a better understanding of VSN and its phenotypes. The choice of treatment could be based on this knowledge.
Finally, damage in several distinct brain regions has consistently been associated with VSN, such as several cortical and subcortical regions of the right hemisphere, including the middle and superior temporal gyrus, inferior parietal lobule, intraparietal sulcus, precuneus, middle occipital gyrus, caudate nucleus, and posterior insula, as well as in the white matter pathway corresponding to the posterior part of the superior longitudinal fasciculus (Molenberghs et al., Citation2012). Different brain regions have been associated with impairments in different tests (Karnath & Rorden, Citation2012), and similarly, specific clinical subtypes of the VSN syndrome (Molenberghs et al., Citation2012). Future research could address whether damage in distinct brain regions might underly manifestations of VSN on static or dynamic tests.
Conclusions
In this study, we investigated the conceptual distinction between static and dynamic tests in a large cohort of patients with VSN. We found that manifestations of VSN may vary between patients, and in a given patient, according to the type of test that was used (static versus dynamic). Moreover, patients showing VSN on tests within the dynamic cluster had poorer motor function, poorer walking abilities and were more ADL dependent than patients showing VSN on the static cluster. Confirmatory factor analyses showed that the underlying factor structure corresponds to our proposed conceptual distinction between static and dynamic clusters of tests. As some patients show VSN on static tests but not on dynamic tests, and vice versa, we advise to include static paper-and-pencil tests as well as dynamic tests as part of a VSN battery in usual care. Future research involving experimental and data-driven approaches might result in a better understanding on how different tests of VSN relate to each other, and more importantly, a better understanding of VSN and its phenotypes.
Acknowledgments
We would like to thank Merel Pieters, Marit Dorresteijn, Roemi Wikarta, Sanne Loosschilder, Inge Meeuwissen, and Irene Bonthond for their help in collecting the data. We thank Erik-Jan van Kesteren for his contribution to the confirmatory factor analyses.
Disclosure of interest
The authors report no conflict of interest.
Disclosure statement
No potential conflict of interest was reported by the author(s).
Additional information
Funding
References
- Azouvi, P. (2002). Sensitivity of clinical and behavioural tests of spatial neglect after right hemisphere stroke. Journal of Neurology, Neurosurgery & Psychiatry, 73(2), 160–166. https://doi.org/10.1136/jnnp.73.2.160
- Azouvi, P. (2017). The ecological assessment of unilateral neglect. Annals of Physical and Rehabilitation Medicine, 60(3), 186–190. https://doi.org/10.1016/j.rehab.2015.12.005
- Azouvi, P., Bartolomeo, P., Beis, J.-M., Perennou, D., Pradat-Diehl, P., & Rousseaux, M. (2006). A battery of tests for the quantitative assessment of unilateral neglect. Restorative Neurology and Neuroscience, 24(4–6), 273–285.
- Azouvi, P., Olivier, S., De Montety, G., Samuel, C., Louis-Dreyfus, A., & Tesio, L. (2003). Behavioral assessment of unilateral neglect: Study of the psychometric properties of the Catherine Bergego Scale. Archives of Physical Medicine and Rehabilitation, 84(1), 51–57. https://doi.org/10.1053/apmr.2003.50062
- Bartolomeo, P., D’Erme, P., Perri, R., & Gainotti, G. (1998). Perception and action in hemispatial neglect. Neuropsychologia, 36(3), 227–237. https://doi.org/10.1016/S0028-3932(97)00104-8
- Benjamini, Y., & Hochberg, Y. (1995). Controlling the false discovery rate - A practical and powerful approach to multiple testing. Journal of the Royal Statistical Society Series B (Methological), 57(1), 289–300. https://doi.org/10.2307/2346101
- Blini, E., Romeo, Z., Spironelli, C., Pitteri, M., Meneghello, F., Bonato, M., & Zorzi, M. (2016). Multi-tasking uncovers right spatial neglect and extinction in chronic left-hemisphere stroke patients. Neuropsychologia, 92(November 2016), 147–157. https://doi.org/10.1016/j.neuropsychologia.2016.02.028
- Bonato, M. (2012). Neglect and extinction depend greatly on task demands: A review. Frontiers in Human Neuroscience, 6(July), 1–13. https://doi.org/10.3389/fnhum.2012.00195
- Bonato, M. (2015). Unveiling residual, spontaneous recovery from subtle hemispatial neglect three years after stroke. Frontiers in Human Neuroscience, 9(July), 1–9. https://doi.org/10.3389/fnhum.2015.00413
- Bonato, M., Priftis, K., Marenzi, R., Umiltà, C., & Zorzi, M. (2010). Increased attentional demands impair contralesional space awareness following stroke. Neuropsychologia, 48(13), 3934–3940. https://doi.org/10.1016/j.neuropsychologia.2010.08.022
- Bosma, M. S., Nijboer, T. C. W., Caljouw, M. A. A., & Achterberg, W. P. (2019). Impact of visuospatial neglect post-stroke on daily activities, participation and informal caregiver burden: A systematic review. Annals of Physical and Rehabilitation Medicine, 63(4), 344–358. https://doi.org/10.1016/j.rehab.2019.05.006
- Bowen, A., McKenna, K., & Tallis, R. C. (1999). Reasons for variability in the reported rate of occurrence of unilateral spatial neglect after stroke. Stroke, 30(6), 1196–1202. https://doi.org/10.1161/01.STR.30.6.1196
- Buxbaum, L. J., Ferraro, M. K., Veramonti, T., Farne, A., Whyte, J., Ladavas, E., Frassinetti, F., & Coslett, H. B. (2004). Hemispatial neglect: Subtypes, neuroanatomy, and disability. Neurology, 62(5), 749–756. https://doi.org/10.1212/01.WNL.0000113730.73031.F4
- Campbell, D. J. (1988). Task complexity: A review and analysis. Academy of Management Review, 13(1), 40–52. https://doi.org/10.5465/amr.1988.4306775
- Chen, P., Fyffe, D., & Hreha, K. (2017). Informal caregivers’ burden and stress in caring for stroke survivors with spatial neglect: An exploratory mixed-method study. Topics in Stroke Rehabilitation, 24(1), 24–33. https://doi.org/10.1080/10749357.2016.1186373
- Chen, P., Hreha, K., Kong, Y., & Barrett, A. M. (2015). Impact of spatial neglect in stroke rehabilitation: Evidence from the Setting of an inpatient rehabilitation facility. Archives of Physical Medicine and Rehabilitation, 96(8), 1458–1466. https://doi.org/10.1002/aur.1474.Replication
- Collin, C., & Wade, D. (1990). Assessing motor impairment after stroke : A pilot reliability study. Journal of Neurology, Neurosurgery & Psychiatry, 53, 576–579. https://doi.org/10.1136/jnnp.53.7.576
- Collin, C., Wade, D. T., Davies, S., & Horne, V. (1988). The Barthel ADL index: A reliability study. International Disability Studies, 10(2), 61–63. https://doi.org/10.3109/09638288809164103
- Corbetta, M. (2014). Hemispatial neglect: Clinic, pathogenesis, and treatment. Seminars in Neurology, 34(5), 514–523. https://doi.org/10.1055/s-0034-1396005
- Deelman, B., Koning-Haanstra, M., Liebrand, W., & Van den Burg, W. (1981). Stichting Afasie Nederland - de SAN-test. Swets & Zeitlinger.
- Delis, D. C., Kaplan, E., & Kramer, J. H. (2007). Tower test. Studie Image.
- Deouell, L. Y., Sacher, Y., & Soroker, N. (2005). Assessment of spatial attention after brain damage with a dynamic reaction time test. Journal of the International Neuropsychological Society : JINS, 11(6), 697–707. https://doi.org/10.1017/S1355617705050824
- Evans, L. D. (1996). A two-score composite program. Behavior Research Methods, 28(2), 209–213. https://doi.org/10.3758/BF03204767
- Ferber, S., & Karnath, H.-O. (2001). How to assess Spatial neglect - Line bisection or cancellation tasks? Journal of Clinical and Experimental Neuropsychology, 23(5), 599–607. https://doi.org/10.1076/jcen.23.5.599.1243
- Folstein, M. F., Folstein, S. E., & McHugh, P. R. (1975). “Mini-mental state”. A practical method for grading the cognitive state of patients for the clinician. Journal of Psychiatric Research, 12(3), 189–198. https://doi.org/10.1016/0022-3956(75)90026-6
- Grattan, E. S., & Woodbury, M. L. (2017). Do neglect assessments detect neglect differently? American Journal of Occupational Therapy, 71(3), 3. https://doi.org/10.5014/ajot.2017.025015
- Grech, M., Stuart, T., Williams, L., Chen, C., & Loetscher, T. (2017). The mobility assessment course for the diagnosis of spatial neglect: Taking a step forward? Frontiers in Neurology, 8, 1–8. https://doi.org/10.3389/fneur.2017.00563
- Hamilton, R. H., Coslett, H. B., Buxbaum, L. J., Whyte, J., & Ferraro, M. K. (2008). Inconsistency of performance on neglect subtype tests following acute right hemisphere stroke. Journal of the International Neuropsychological Society : JINS, 14(1), 23–32. https://doi.org/10.1017/S1355617708080077
- Heilman, K. M., Valenstein, E., & Watson, R. T. (1984). Neglect and related disorders. Seminars in Neurology, 4(2), 209–2019. https://doi.org/10.1055/s-2000-13179
- Heilman, K. M., Valenstein, E., & Watson, R. T. (2000). Neglect and related disorders. Seminars in Neurology, 20(4), 463–470. https://doi.org/10.1055/s-2000-13179
- Holden, M. K., Gill, K. M., Magliozzi, M. R., Nathan, J., & Piehl-baker, L. (1984). Clinical gait assessment in the neurologically impaired. Reliability and meaningfulness. Physical Therapy, 64(1), 35–40. https://doi.org/10.1093/ptj/64.1.35
- Hooper, D., Coughlan, J., Mullen, M. R., Mullen, J., Hooper, D., Coughlan, J., & Mullen, M. R. (2008). Structural equation modelling : Guidelines for determining model fit structural equation modelling : Guidelines for determining model fit. Electronic Journal of Business Research Methods, 6(1), 53–60. https://doi.org/10.21427/D7CF7R
- Jackson, D. L., Gillaspy, J. A., & Purc-Stephenson, R. (2009). Reporting practices in confirmatory factor analysis: An Overview and some recommendations. Psychological Methods, 14(1), 6–23. https://doi.org/10.1037/a0014694
- Jewell, G., & McCourt, M. E. (2000). Pseudoneglect: A review and meta-analysis of performance factors in line bisection tasks. Neuropsychologia, 38(1), 93–110. https://doi.org/10.1016/S0028-3932(99)00045-7
- Karnath, H. O., & Rorden, C. (2012). The anatomy of spatial neglect. Neuropsychologia, 50(6), 1010–1017. https://doi.org/10.1016/j.neuropsychologia.2011.06.027
- Katz, N., Hartman-Maeir, A., Ring, H., & Soroker, N. (1999). Functional disability and rehabilitation outcome in right hemisphere damaged patients with and without unilateral spatial neglect. Archives of Physical Medicine and Rehabilitation, 80(4), 379–384. https://doi.org/10.1016/S0003-9993(99)90273-3
- Kesayan, T., Gasoyan, H., & Heilman, K. M. (2018). Left hemispatial neglect with a splenial lesion. Neurocase, 1–7. https://doi.org/10.1080/13554794.2018.1539501
- Künstler, E. C. S., Finke, K., Günther, A., Klingner, C., Witte, O., & Bublak, P. (2018). Motor-cognitive dual-task performance: Effects of a concurrent motor task on distinct components of visual processing capacity. Psychological Research, 82, 177–185. https://doi.org/10.1007/s00426-017-0951-x
- Liu, P., & Li, Z. (2012). Task complexity: A review and conceptualization framework. International Journal of Industrial Ergonomics, 42(6), 553–568. https://doi.org/10.1016/j.ergon.2012.09.001
- MacLeod, M. S., & Turnbull, O. H. (1999). Motor and perceptual factors in pseudoneglect. Neuropsychologia, 37(6), 707–713. https://doi.org/10.1016/S0028-3932(98)00115-8
- Manly, T., Hawkins, K., Evans, J., Woldt, K., & Robertson, I. H. (2002). Rehabilitation of executive function: Facilitation of effective goal management on complex tasks using periodic auditory alerts. Neuropsychologia, 40(3), 271–281. https://doi.org/10.1016/S0028-3932(01)00094-X
- Menon, A., & Korner-Bitensky, N. (2005). Evaluating unilateral spatial neglect post stroke: Working your way through the maze of assessment choices. Topics in Stroke Rehabilitation, 11(3), 41–66. https://doi.org/10.1310/kqwl-3hql-4knm-5f4u
- Molenberghs, P., Sale, M. V., & Mattingley, J. B. (2012). Is there a critical lesion site for unilateral spatial neglect? A meta-analysis using activation likelihood estimation. Frontiers in Human Neuroscience, 6, 1–10. https://doi.org/10.3389/fnhum.2012.00078
- Moss, F., Ward, L. M., & Sannita, W. G. (2004). Stochastic resonance and sensory information processing: A tutorial and review of application. Clinical Neurophysiology, 115(2), 267–281. https://doi.org/10.1016/j.clinph.2003.09.014
- Nasreddine, Z. S., Philips, N. A., Bedirian, V., Charbonneau, S., Whitehead, V., Collin, I., … Chertkow, H. (2005). The Montreal cognitive assessment, MoCA : A brief screening tool for mild cognitive impairment. Journal of the American Geriatrics Society, 53(4), 695–699. https://doi.org/10.1111/j.1532-5415.2005.53221.x
- Nijboer, T. C. W., Kollen, B., & Kwakkel, G. (2014). The impact of recovery of visuo-spatial neglect on motor recovery of the upper paretic limb after stroke. PLoS ONE, 9(6), 1–8. https://doi.org/10.1371/journal.pone.0100584
- Nijboer, T. C. W., Ten Brink, A. F., Van der Stoep, N., & Visser-Meily, J. M. A. (2014). Neglecting posture: Differences in balance impairments between peripersonal and extrapersonal neglect. Neuroreport, 25(17), 1381–1385. https://doi.org/10.1097/WNR.0000000000000277
- Nijboer, T. C. W., van de Port, I., Schepers, V., Post, M., & Visser-Meily, A. (2013). Predicting functional outcome after stroke: The Influence of neglect on basic activities in daily living. Frontiers in Human Neuroscience, 7, 1–6. https://doi.org/10.3389/fnhum.2013.00182
- Ochando, A., & Zago, L. (2018). What are the contributions of handedness, sighting dominance, hand used to bisect, and visuospatial line processing to the behavioral line bisection bias? Frontiers in Psychology, 9, 1–8. https://doi.org/10.3389/fpsyg.2018.01688
- Ogourtsova, T., Souza Silva, W., Archambault, P. S., & Lamontagne, A. (2017). Virtual reality treatment and assessments for post-stroke unilateral spatial neglect: A systematic literature review. Neuropsychological Rehabilitation, 27(3), 409–454. https://doi.org/10.1080/09602011.2015.1113187
- Pallavicini, F., Pedroli, E., Serino, S., Dell’Isola, A., Cipresso, P., Cisari, C., & Riva, G. (2015). Assessing unilateral spatial neglect using advanced technologies: The potentiality of mobile virtual reality. Technology and Health Care, 23(6), 795–807. https://doi.org/10.3233/THC-151039
- Pedroli, E., Serino, S., Cipresso, P., Pallavicini, F., & Riva, G. (2015). Assessment and rehabilitation of neglect using virtual reality: A systematic review. Frontiers in Behavioral Neuroscience, 9, 115. https://doi.org/10.3389/fnbeh.2015.00226
- Peskine, A., Rosso, C., Box, N., Galland, A., Caron, E., Rautureau, G., Jouvent, R., & Pradat-Diehl, P. (2011). Virtual reality assessment for visuospatial neglect: Importance of a dynamic task. Journal of Neurology, Neurosurgery and Psychiatry, 82(12), 1405–1407. https://doi.org/10.1136/jnnp.2010.214437
- Plummer, P., Morris, M. E., & Dunai, J. (2003). Assessment of unilateral neglect. Physical Therapy, 83(8), 732–740. https://doi.org/10.1093/ptj/83.8.732
- Rengachary, J., d’Avossa, G., Sapir, A., Shulman, G. L., & Corbetta, M. (2009). Is the Posner reaction time test more accurate than clinical tests in detecting left neglect in acute and chronic stroke? Archives of Physical Medicine and Rehabilitation, 90(12), 2081–2088. https://doi.org/10.1016/j.apmr.2009.07.014
- Rey, A. (1941). L’examen psychologique dans les cas d’encephopathie traumatique (The psychological examination of cases of traumatic encephalopathy), Archives de Psychologie, 28, 286–340. Corwin, J. and Bylsma, F.W., (Trans.). (1993) The Clinical Neuropsychologist, 7, 4–9. https://doi.org/10.1080/13854049308401883
- Rode, G., Pagliari, C., Huchon, L., Rossetti, Y., & Pisella, L. (2016). Semiology of neglect: An update. Annals of Physical and Rehabilitation Medicine, 60(3), 177–185. https://doi.org/10.1016/j.rehab.2016.03.003
- Rosseel, Y. (2012). lavaan: An R package for structural equation modeling. Journal of Statistical Software, 48(2), 1–36. https://doi.org/10.18637/jss.v048.i02
- Rothman, K. J. (1990). No adjustments are needed for multiple comparisons. Epidemiology, 1(1), 43–46. https://doi.org/10.1097/00001648-199001000-00010
- Schaefer, S. (2014). The ecological approach to cognitive-motor dual-tasking: Findings on the effects of expertise and age. Frontiers in Psychology, 5, 1–9. https://doi.org/10.3389/fpsyg.2014.01167
- Schendel, K. L., & Robertson, L. C. (2003). Using reaction time to assess patients with unilateral neglect and extinction. Journal of Clinical and Experimental Neuropsychology, 24(7), 941–950. https://doi.org/10.1076/jcen.24.7.941.8390
- Simes, R. J. (1986). An improved bonferroni procedure for multiple tests of significance. Biometrika, 73(3), 751–754. https://doi.org/10.1093/biomet/73.3.751
- Smit, M., Van der Stigchel, S., Visser-Meily, J. M. A., Kouwenhoven, M., Eijsackers, A., & Nijboer, T. C. W. (2013). The feasibility of computer-based prism adaptation to ameliorate neglect in sub-acute stroke patients admitted to a rehabilitation center. Frontiers in Human Neuroscience, 7, 353. https://doi.org/10.3389/fnhum.2013.00353
- Söderlund, G. B. W., & Sikström, S. (2008). Positive effects of noise on cognitive performance: Explaining the moderate brain arousal model. Proceedings from ICBEN, International Comission on the Biological Effects of Noise.
- Söderlund, G. B. W., Sikström, S., Loftesnes, J. M., & Sonuga-Barke, E. J. (2010). The effects of background white noise on memory performance in inattentive school children. Behavioral and Brain Functions, 6, 1–10. https://doi.org/10.1186/1744-9081-6-55
- Söderlund, G. B. W., Sikström, S., & Smart, A. (2007). Listen to the noise: Noise is beneficial for cognitive performance in ADHD. Journal of Child Psychology and Psychiatry and Allied Disciplines, 48(8), 840–847. https://doi.org/10.1111/j.1469-7610.2007.01749.x
- Solomon, T. M., DeBros, G. B., Budson, A. E., Mirokovic, N., Murphy, C. A., & Solomon, P. R. (2014). Correlational analysis of 5 commonly used measures of cognitive functioning and mental status: An update. American Journal of Alzheimer’s Disease and Other Dementias, 29(8), 718–722. https://doi.org/10.1177/1533317514534761
- Spreij, L. A., Ten Brink, A. F., Visser-Meily, J. M. A., & Nijboer, T. C. W. (2020). Simulated driving: The added value of dynamic testing in the assessment of visuo-spatial neglect after stroke. Journal of Neuropsychology, 14, 28–45. https://doi.org/10.1111/jnp.12172
- SpreSpreij, L. A., Ten Brink, A. F., Visser-Meily, J. M. A., & Nijboer, T. C. W. (2020). Simulated driving: the added value of dynamic testing in the assessment of visuo-spatial neglect after stroke. Journal of Neuropsychology, 14(1), 28–45. https://doi.org/10.1111/jnp.12172
- Suavansri, K., Falchook, A. D., Williamson, J. B., & Heilman, K. M. (2012). Right up there: Hemispatial and hand asymmetries of altitudinal pseudoneglect. Brain and Cognition, 79(3), 216–220. https://doi.org/10.1016/j.bandc.2012.03.003
- Ten Brink, A. F., Nijboer, T. C. W., Van Beekum, L., Van Dijk, J., Peeters, R., Post, M., & Visser-Meily, J. M. A. (2013). De Nederlandse Catherine Bergego schaal: Een bruikbaar en valide instrument in de CVA-zorg. Wetenschappelijk Tijdschrift Voor Ergotherapie, 6(3), 27–36.
- Ten Brink, A. F., Verwer, J. H., Biesbroek, J. M., Visser-Meily, J. M. A., & Nijboer, T. C. W. (2016). Differences between left and right sided neglect revisited: A large cohort study across multiple domains. Journal of Clinical and Experimental Neuropsychology, 39(7), 707–723. https://doi.org/10.1080/13803395.2016.1262333
- Ten Brink, A. F., Visser-Meily, J. M. A., & Nijboer, T. C. W. (2015). Study protocol of ‘ prism adaptation in rehabilitation ’ : A randomized controlled trial in stroke patients with neglect. BMC Neurology, 15(5), 1–5. https://doi.org/10.1186/s12883-015-0263-y
- Ten Brink, A. F., Visser-Meily, J. M. A., & Nijboer, T. C. W. (2018). Dynamic assessment of visual neglect: The mobility assessment course as a qualitative diagnostic tool. Journal of Clinical and Experimental Neuropsychology, 40(2), 161–172. https://doi.org/10.1080/13803395.2017.1324562
- Thissen, D., Steinberg, L., & Kuang, D. (2002). Quick and easy implementation of the Benjamini-Hochberg procedure for controlling the false positive rate in multiple comparisons. Journal of Educational and Behavioral Statistics, 27(1), 77–83. https://doi.org/10.3102/10769986027001077
- Tinga, A. M., Visser-Meily, J. M. A., Van der Smagt, M. J., van der Stichel, S., Van Ee, R., & Nijboer, T. C. W. (2015). Multisensory stimulation to improve low- and higher-level sensory deficits after stroke : A systematic review. Neuropsychological Rehabilitation, 26, 73–91. https://doi.org/10.1007/s11065-015-9301-1
- Toglia, J., & Cermak, S. A. (2009). Dynamic assessment and prediction of learning potential in clients with unilateral neglect. American Journal of Occupational Therapy, 63(5), 569–579. https://doi.org/10.5014/ajot.63.5.569
- Tsaparli, G. (2014). Cognitive demand. In R. Gunstone (Ed.), Encyclopedia of science education. Springer. https://link.springer.com/referenceworkentry/10.1007%2F978-94-007-6165-0_40-20#howtocite
- Tsirlin, I., Dupierrix, E., Chokron, S., Coquillart, S., & Ohlmann, T. (2009). Uses of virtual reality for diagnosis, rehabilitation and study of unilateral spatial neglect: Review and analysis. Cyberpsychology and Behavior, 12(2), 175–181. https://doi.org/10.1089/cpb.2008.0208
- UNESCO. (1997). International standard classification of education (ISCED). www.uis.unesco.org
- Van der Stigchel, S., & Nijboer, T. C. W. (2017). Temporal order judgements as a sensitive measure of the spatial bias in patients with visuospatial neglect. Journal of Neuropsychology, 12(3), 427–441. https://doi.org/10.1111/jnp.12118
- Van der Stoep, N., Visser-Meily, J. M. A., Kappelle, L. J., de Kort, P. L. M., Huisman, K. D., Eijsackers, A. L. H., … Nijboer, T. C. W. (2013). Exploring near and far regions of space: Distance-specific visuospatial neglect after stroke. Journal of Clinical and Experimental Neuropsychology, 35(8), 799–811. https://doi.org/10.1080/13803395.2013.824555
- Van Nes, I. J. W., Van Der Linden, S., Hendricks, H. T., Van Kuijk, A. A., Rulkens, M., Verhagen, W. I. M., & Geurts, A. C. H. (2009). Is visuospatial hemineglect really a determinant of postural control following stroke? An acute-phase study. Neurorehabilitation and Neural Repair, 23(6), 609–614. https://doi.org/10.1177/1545968308328731
- Verhage, F. (1965). Intelligence and age in a Dutch sample. Human Development, 8(4), 238–245. https://doi.org/10.1159/000270308
- Verlander, D., Hayes, A., McInnes, J. K., Liddle, R. J., Liddle, G. W., Clarke, G. E., … Walsh, P. G. (2000). Assessment of clients with visual spatial disorders: A pilot study. Visual Impairment Research, 2(3), 129–142. https://doi.org/10.1076/vimr.2.3.129.4422
- Wilson, B., Cockburn, J., & Halligan, P. W. (1987). Development of behavioural test of visuo-spatial neglect. Archives of Physical Medicine and Rehabilitation, 68(2), 98–102. https://pubmed.ncbi.nlm.nih.gov/3813864/
Appendix 1. Benjamini-Hochberg Method
The Benjamini–Hochberg method consists of several steps: (1) put the individual p-values in order, from smallest to largest; (2) assign ranks to the p-values; (3) calculate each individual p-value’s Benjamini-Hochberg critical value, using the formula (i/m)Q, where: i = the individual p-value’s rank, m = total number of tests, Q = the false discovery rate (in our case.1); (4) compare the original p-values to the Benjamini-Hochberg critical values. Find the largest p-value that is less or equal to the critical value. All the p-values above are also significant.
Appendix 1a. Benjamini-Hochberg correction that is applied to the multiple comparisons of demographic and clinical characteristics between the groups.
Appendix 1b.
Benjamini-Hochberg correction that is applied to the post-hoc Mann Whitney U tests for comparing the significant clinical characteristics (Motricity index upper and lower, Barthel index, Functional ambulation categories) between the groups.