
ABSTRACT
Introduction
Impairments in visual search are a common symptom in visuospatial neglect (VSN). The severity of the lateralized attention bias in visual search tasks can vary depending on the number of distractors: the more distractors, the more targets are missed. However, little is known about how the number of targets affect search performance in VSN. The aim of the current study was to examine the effect of the number of targets on hit rate in VSN.
Methods
We included 23 stroke patients with right-brain damage and VSN, 55 with right-brain damage without VSN, and 49 with left-brain damage without VSN, all admitted for inpatient rehabilitation. In a visual search task, patients had to find and tap targets, presented along with non-targets. The location and number of targets varied from trial to trial, allowing the evaluation of the effects of number and location of targets on hit rate.
Results
VSN patients detected a lower percentage of targets when more targets were present. For patients with right-brain damage without VSN, adding targets only reduced the hit rate of the most contralesional target. No effect of number of targets on hit rate was seen in patients with left-brain damage. Additionally, VSN patients found less contralesional targets than ipsilesional targets, made more delayed revisits, and had an initial rightward bias when compared to the other groups. There were no differences in search time, search consistency, or immediate revisits between groups. There was a moderate positive relation between the hit rate asymmetry score in our search task and conventional paper-and-pencil VSN tasks, and neglect behavior in daily life.
Conclusions
In VSN patients, a higher number of targets reduces the hit rate. The reduced hit rate in visual search evoked by additional targets should be taken into account when assessing visual search in VSN.
Introduction
Visuospatial neglect (VSN) is a frequent post-stroke disorder in lateralized attention. Patients with VSN are impaired in exploring and initiating actions directed toward stimuli on the contralesional side, and favor exploration of the ipsilesional side (Appelros et al., Citation2002; Buxbaum et al., Citation2004; Gainotti et al., Citation1991; Heilman & Abell, Citation1980). The lateralized attention bias is more common and more severe after a stroke in the right than in the left hemisphere (Chen et al., Citation2015; Gainotti et al., Citation1972; Ten Brink et al., Citation2017). While most recovery takes place within 3 months post-stroke onset, 40% of patients with VSN in the subacute phase still shows VSN 1 year after post-stroke onset (Nijboer et al., Citation2013).
Disrupted visual search is a common symptom in VSN. Being able to perform complex daily activities such as driving or spatial orientation is dependent on the quality of visual search (Shinoda et al., Citation2001). Tasks to assess visual search performance are, therefore, highly relevant. The severity of the lateralized attention bias in visual search tasks can vary depending on the nature of the used stimuli, such as the type (e.g., letters or symbols), their configuration (e.g., structured or random), and their saliency (Aglioti et al., Citation1997; Sarri et al., Citation2009; Weintraub & Mesulam, Citation1988). An important feature is the presence of distractors, which, especially at the ipsilesional side, aggravates the spatial attention bias in patients with VSN (Emerson et al., Citation2019; Gainotti et al., Citation2009; Harvey et al., Citation2002; Keller et al., Citation2015). The more distractors are present, the slower the search and the fewer targets are found (Eglin et al., Citation1989; Husain & Kennard, Citation1997). However, it is often not considered that targets themselves can impair performance, and the number of targets could, therefore, influence search performance in a similar or even more pronounced way as distractors do. The aim of the current study was to systematically investigate the effect of the number of targets on hit rate in patients with VSN.
Only relatively few studies have evaluated whether and how the number of targets affect search performance in VSN. In a case study of a patient with left-sided VSN, presenting more targets led to a higher absolute number of canceled targets, but a lower overall percentage of canceled targets (Chatterjee et al., Citation1992b; see also Kartsounis & Findley, Citation1994). The VSN was not confined to a fixed proportion of external space, given that a smaller area of the stimulus sheet was canceled when more targets were presented (Chatterjee et al., Citation1992b). These findings were not replicated by Husain and Kennard (Citation1997), in two patients with left-sided VSN. Chatterjee et al. (Citation1999) tested seven left-sided VSN patients and found that these patients were more likely to cancel targets on arrays with fewer targets, regardless of their spatial location. A larger study in which 39 left- and right-sided VSN patients had to indicate whether there were more stimuli at the left or right side, performance was worse with a higher number of stimuli (Nijboer & Van der Stigchel, Citation2019). Two studies showed that varying the density of the targets (i.e., the space in between targets) while keeping the total number of targets constant did not affect hit rate in patients with VSN (Chatterjee et al., Citation1992a; Pia et al., Citation2013). Overall, these results suggest that for visual search tasks, a higher number of targets results in a lower hit rate in patients with VSN, which cannot be explained by target density.
The negative effect of a high number of targets on hit rate in VSN could be explained by a combination of an initial lateral bias, a directional bias in the competition for selection, and disturbances of spatial working memory. In general, attention is automatically guided to search targets (Wolfe, Citation1994). Due to the initial lateral bias, attention will predominantly be allocated toward targets at the ipsilesional side compared to targets at the contralesional side. Moreover, there is a bias in competition such that ipsilesional items win over contralesional ones for selection (Husain, Citation2019). This is similar to a disengaging deficit; patients will have difficulties disengaging their attention from these ipsilesional targets to engage the contralesional targets (Losier & Klein, Citation2001; Morrow & Ratcliff, Citation1988; Posner et al., Citation1982). Furthermore, a deficit in retaining locations already searched could lead to reexamination of the ipsilesional targets, as being searched for the first time, and could cause patients with VSN to never find targets on the contralesional side, even with unlimited viewing time (Husain, Citation2019; Husain et al., Citation2001). Following this, increasing the number of ipsilesional targets will disproportionally affect the likelihood of finding contralesional targets, while this effect is not expected the other way around.
We first studied the effect of the number of targets on overall hit rate, while keeping the total number of stimuli (i.e., targets and distractors) constant. Second, we assessed the effect of the number of targets on the likelihood of finding the most ipsilesional and contralesional peripheral target (the reference target). We expected to find a reduction of hit rate for the most contralesional target when adding targets ipsilesional from it.
The current task also allowed us to assess other important attentional parameters that have been related to VSN in previous studies on visual search. More specifically, we assessed overall hit rate, search time, search consistency (i.e., defined as searching consistently from left to right, from top to bottom, or vice versa), the number of immediate revisits, and the number of delayed revisits. Patients with right-brain damage were expected to search in a less consistent manner compared to patients with left-brain damage, with least organized search in right-brain damage patients with, compared to without VSN (Rabuffetti et al., Citation2012; Ten Brink et al., Citation2016, Citation2016; Weintraub & Mesulam, Citation1988). Next, we assessed whether there was an initial spatial bias toward the left or right, as reflected by the starting point and search time for a single target (e.g., Butler et al., Citation2004; Jalas et al., Citation2002). Furthermore, we evaluated the likelihood of finding targets with respect to their horizontal position, while keeping the number and location of targets and distractors constant. In patients with VSN, we expected to find a decrease in hit rate for targets that were located more toward the ipsilesional than the contralesional side, both within the ipsilesional and contralesional hemispace. Finally, we studied the relation between performance on our visual search task and conventional paper-and-pencil neuropsychological tasks for VSN (i.e., shape cancellation and line bisection), and neglect behavior in daily life, as observed with the Catherine Bergego Scale.
Materials and methods
Participants
Stroke patients were included from a patient population admitted for inpatient rehabilitation to rehabilitation center De Hoogstraat in Utrecht, between May 2019 and January 2020. All stroke patients were screened for VSN as part of standard care, within 2 weeks after admission. The visual search task was part of this VSN screening. Inclusion criteria were clinical diagnosis of symptomatic unilateral stroke (left or right ischemic, intracerebral, or subarachnoid hemorrhagic lesion), between 18 and 85 years of age, sufficient comprehension and communication to perform the tasks, available data on the visual search task, and available data on at least two tasks for VSN (i.e., shape cancellation task, line bisection task, and/or Catherine Bergego Scale).
A subset of patients was recruited as part of an intervention study that took place in rehabilitation centers De Hoogstraat and De Parkgraaf in Utrecht (Elshout et al., Citation2019). Additional inclusion criteria for the intervention study were signs of VSN on at least one of the VSN tasks (i.e., shape cancellation task, line bisection task, and/or Catherine Bergego Scale), sufficient motivation to participate, and written informed consent. Exclusion criteria were interfering disorders, expected discharge <4 weeks, and mentally or physically unable to participate. The neuropsychologist and rehabilitation physician were consulted regarding these exclusion criteria. For this subset of patients, we used data of the visual search task and VSN tasks that were assessed at baseline. The intervention study was approved by the ethical committee of the University Medical Center Utrecht (NL64626.041.18).
Data of all patients, either collected as part of the VSN screening or as part of the baseline measurement for the intervention study, were pooled. Groups were created based on lesion side (i.e., left-brain damage [LBD] or right-brain damage [RBD]) and the presence (+) or absence (-) of VSN on two or more of three VSN tasks (i.e., shape cancellation task, line bisection task, and/or Catherine Bergego Scale; described below). In total, 129 stroke patients were included, of whom 49 had left-brain damage without VSN (LBD-), 2 had left-brain damage with VSN (LBD+), 55 had right-brain damage without VSN (RBD-), and 23 had right-brain damage with VSN (RBD+). As the LBD+ group consisted of only two patients, this group was excluded from analysis, leaving 127 stroke patients.
Due to the nature of this research, participants of this study did not agree for their data to be shared publicly, so supporting data are not available.
Demographic and stroke-related characteristics
The following data were obtained on admission to the rehabilitation center: age, sex, type of stroke (i.e., ischemic, intracerebral hemorrhagic, or subarachnoid hemorrhagic), lesioned hemisphere (i.e., left or right), days post-stroke at the time of admission to rehabilitation, level of independence during daily life activities as measured with the Barthel Index (Collin et al., Citation1988), strength in both upper and lower extremities as measured with the Motricity Index (Collin & Wade, Citation1990), and global cognitive functioning as measured with the Montreal Cognitive Assessment (Nasreddine et al., Citation2005).
Shape cancellation task
The computerized shape cancellation task consisted of 54 small targets (0.6° × 0.6°), 52 large distractors, and 23 words and letters (widths ranging from 0.95° to 2.1° and heights ranging from 0.45° to 0.95°). The stimulus presentation was approximately 18.5° wide and 11° high. Patients were seated 120 cm in front of a monitor and used a computer mouse. They were instructed to click all targets and tell the examiner when they had completed the task. No time limit was given. The absolute difference in the number of omissions at the left versus right side was computed (i.e., omission difference score).
The threshold for VSN was based on the performance of 28 healthy individuals. The average omission difference score plus three standard deviations was 1.05, resulting in a threshold of ≥2 for VSN (Van der Stoep et al., Citation2013).
Line bisection task
The line bisection task was based on the task of McIntosh et al. (Citation2005). We used 32 horizontal line stimuli (1 mm thick, black), presented one by one on a white background. There were eight repetitions of four unique lines, created by crossing two left endpoint positions (−11.42° and −5.72° from the horizontal midline of the screen) with two right endpoint positions (5.72° and 11.42° from the horizontal midline of the screen). Patients were seated 30 cm from the monitor and asked to indicate the midpoint of each line by a click with the computer mouse. Per line type, we computed the average deviation in mm from the actual midpoint.
The normal range of deviations was based on the performance of 30 healthy individuals. The average deviation per line plus two standard deviations was −2.33 to 1.94 mm for line 1, −3.21 to 2.74 mm for line 2, −3.61 to 2.91 mm for line 3, and −4.29 to 2.77 mm for line 4. A deviation above threshold (i.e., outside normal range) on ≥2 lines was used as a threshold for VSN.
Catherine Bergego Scale
The Catherine Bergego Scale is an observation scale for neglect in activities of daily living (Azouvi et al., Citation2003; Ten Brink et al., Citation2013). It assesses performance in personal (body parts, body surface), peripersonal (within reaching distance), and extrapersonal space (beyond reaching distance), as well as in perceptual, representational, and motor domains. For 10 items, presence and severity of neglect were scored by the nurse, resulting in a total score of 0 (never/no neglect) to 30 (always/severe neglect). Nurses were instructed to only score behavior due to neglect and not due to other deficits (e.g., motor and/or sensory deficits). A score of ≥6 was used as a threshold for neglect (Ten Brink et al., Citation2013).
Visual search task
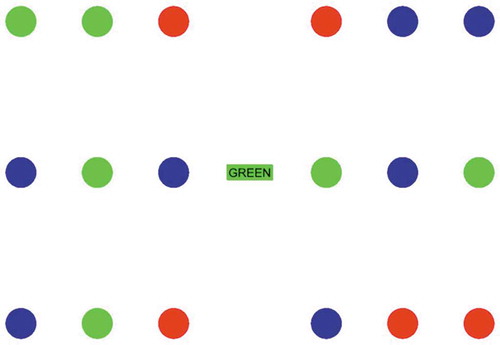
The newly designed visual search task was performed on an HP Envy laptop with a 13.3-inch (34.5 x 19.5 cm) touch screen. The distance from patients to screen was approximately 40 cm. Two grids of 3 × 3 dots of 2° appeared: one on the ipsilesional side and one on the contralesional side with 5° in between (). Each column of three dots was separated by 5° which resulted in target locations at 5°, 10°, and 15° from the center. The entire stimulus field was 30° wide and 20° high. The dots were red, blue, or green, and colors were distributed differently across grids and trials. In the center of the screen, a red, blue, or green filled rectangle (width 3° x height 1°) indicated the target color. We changed the target color across trials to reduce repetition of context and priming, which could lead to improved performance (e.g., faster search) over trials (Saevarsson et al., Citation2008). In addition, previous studies showed that adding a cognitive operation to a task, even if it is minor such as identifying a shape, will make the task more sensitive to a bias in spatial attention (Bartolomeo, Citation1997; Blini et al., Citation2016; Bonato, Citation2015; Bonato et al., Citation2013; van Kessel et al., Citation2013). Patients were instructed to tap all dots (in both grids) of the cued color, and tap the central rectangle to indicate that they were finished. A black square (2.5° x 2.5°) appeared and stayed on any touched location on the screen, regardless of whether it was a target, distractor, or space in between. There was no time limit. The x- and y-coordinates of the touched locations and their time points were recorded.
Figure 1. Template of the visual search task. Patients were cued with a color (i.e., the central rectangle) and instructed to tap all dots of the same color, and not tap the other dots. Patients were instructed to tap the central rectangle to indicate when they were finished. There was no time limit
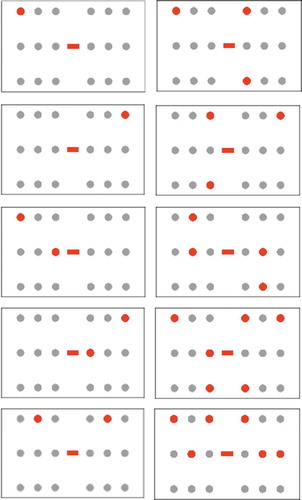
Conditions differed regarding the number and location of targets. Per condition, at least three repetitions were presented, in which the target row varied between repetitions. Hereby, a potential effect of target row was excluded, which was no factor of interest in the current study. The task consisted of 18 conditions (54 trials in total) for the first 60 patients; however, we reduced this to 12 conditions (36 trials in total) for the other 67 patients to decrease task demand. For conditions with an equal number of targets at the left and right stimulus field, the three repetitions consisted either of three symmetrical configurations; or one symmetrical configuration and two nonsymmetrical configurations that were mirrored versions of each other. For conditions with an unequal number of targets at the left and right stimulus field, there was always a mirrored version of the entire condition (i.e., mirrored versions of the three repetitions). In this way, the configurations were balanced for the left and right side. Between the two task versions, there were 10 overlapping conditions, depicted in . To answer specific research questions, per analysis a different selection of these conditions was used. We did not compare all possible factors (i.e., number of targets, side of targets, target column) in one model as not all possible combinations of these factors were reflected in the different conditions. The number of trials had to be kept low due to limited testability of patients.
Figure 2. Example trials for each of the 10 conditions that were part of the 36-trial and 54-trial tasks, which were used for the current study. The targets are depicted in red, the distractors in gray. For each condition, there were three trials in which the target rows varied between trials
Statistical analyses
As several assumptions for parametric testing were violated, we used non-parametric tests for all analyses. For group comparisons, we used Kruskal-Wallis tests and, in case of significant differences between groups, post-hoc Mann-Whitney tests. For within-group comparisons, we conducted one or more Friedman Test for each group. In case of significant differences between conditions, we performed posthoc Wilcoxon signed-rank tests. As the analyses could not be conducted in one statistical model, the level of significance for the main models was set at an alpha of 0.01 instead of 0.05 to reduce the probability of a Type I error. For all posthoc comparisons, we used the Holm-Bonferroni method to correct for multiple posthoc comparisons, using an alpha of 0.05 (Holm, Citation1978). Effect sizes were computed with the Pearson correlation coefficient using the following formula: r = Z/√N (Rosenthal, Citation1994). For Chi-square tests, Cramer’s V was reported. Effect sizes of >.10 were considered to reflect a small, >.30 a medium, and >.50 a large effect (Field, Citation2013).
Demographic and stroke-related characteristics
Demographic and stroke-related characteristics were compared between groups (LBD-, RBD-, RBD+) using Kruskal-Wallis tests and Chi-square tests.
Overall hit rate, search speed, search consistency, and revisits
First, Kruskal-Wallis tests were performed to compare groups regarding the percentage of hits (i.e., for ipsilesional and contralesional targets, and the asymmetry between these percentages) and trial duration in seconds (i.e., from the start of stimulus presentation until participants tapped the central square to indicate the end of the trial), averaged over all trials (either 36 or 54, including all conditions). We also computed and compared the ‘center of cancellation’ by assigning different weights to tapped (i.e., canceled) targets based on their location (Rorden & Karnath, Citation2010). The different weights ranged from −1 (contralesional outer column), −0.66 (contralesional middle column), −0.33 (contralesional inner column), 0.33 (ipsilesional inner column), 0.66 (ipsilesional middle column), to 1 (ipsilesional outer column). Thus, a positive center of cancellation indicated more canceled targets toward the ipsilesional side, a negative center of cancelation toward the contralesional side, and a center of cancellation of zero indicated no bias.
To measure search consistency, we computed best r. Best r reflects how consistent (i.e., either from left to right, from top to bottom, or vice versa) the search was performed (Dalmaijer et al., Citation2014). For all conditions with three targets or more, we calculated the Pearson correlation coefficient (r) from the linear regression of the x- or y-values of all tapped targets relative to the order in which they were tapped. The highest absolute correlation of these two (i.e., best r) was selected to represent the degree to which calculations were pursued orthogonally. Best r ranges from 0 (inconsistent search) to 1 (consistent search). Best r was compared between groups using Kruskal-Wallis tests.
Finally, for all conditions we computed the average number of immediate revisits (i.e., targets that were tapped repeatedly, without tapping another target in between), and for all conditions with two targets or more we computed the average number of delayed revisits (i.e., targets that were tapped again, after tapping at least one other target in between). We only included tapped target stimuli (i.e., distractors that were tapped repeatedly were not included in the number of revisits). Groups were compared regarding immediate and delayed revisits using Kruskal-Wallis tests.
Initial spatial bias
Then, we assessed whether there was an initial spatial bias toward the left or right side of the search array, as reflected by the starting point and the time needed to find a single left or right target. As opposed to the other analyses, performance was not assessed with respect to the side of the brain damage (i.e., contralesional and ipsilesional side), as the left and right side are not comparable regarding the initial spatial bias. In neurologically healthy individuals, a preference to start at the left side is often reported (e.g., pseudoneglect).
First, the percentages of trials in which the starting point (i.e., the first tapped target) was on the left side were evaluated. We included all conditions with one or more target(s) at each side and used Kruskal-Wallis tests to compare groups regarding the percentage of trials in which the starting point was on the left side. In addition to this crude left/right comparison, we computed the ‘center of starting points’ by assigning different weights to tapped (i.e., canceled) first targets based on their location in a similar way as for the center of cancellation (Bonato et al., Citation2012). The only difference with the weights used for the center of cancellation was that they were computed with respect to the left and right side (e.g., assigning −1 for a target in the most leftward column, and 1 for a target in the most rightward column), instead of the contralesional and ipsilesional side. Kruskal-Wallis tests were used to compare groups regarding the center of starting points.
Second, the time that was needed to find either a single target at the left side, or a single target at the right side was computed and compared between groups using Kruskal-Wallis tests. The dependent variable was the time needed to find the target. We included the condition with a single target on the left side, and the condition with a single target on the right side.
Effect of target column on hit rate
Next, hit rate as a function of target column was assessed. The condition in which all columns contained one target (i.e., three targets ipsilesional and three targets contralesional) was included. We performed a Friedman Test for each group (LBD-, RBD-, RBD+) and side (ipsilesional, contralesional), with target column (1, 2, 3; from most ipsilesional to most contralesional) as within subjects’ factor. The dependent variable was the percentage of hits. We expected to find an effect for patients with VSN, with least targets found in columns that were located more toward the contralesional side compared to the ipsilesional side.
Effect of number of targets on overall hit rate
To address our main question, the effect of number of targets on overall hit rate was assessed, without dissociating between the ipsilesional and contralesional side. All conditions with more than one target that were part of both the 36- and 54-trial versions of the task were included, which were conditions with two, three, four, and six targets in total (). No dissociation was made between the two conditions with six targets in total. For each group (LBD-, RBD-, RBD+), a Friedman Test with the total number of targets (2, 3, 4, and 6) as within-subjects’ factor was performed. The dependent variable was the overall percentage of hits. We expected that patients with VSN would obtain a lower hit rate when more targets were present.
Effect of number of targets on hit rate of the most peripheral target
As the hit rate and the effect of additional targets are thought to be dependent on target column, the effect of the number of additional targets on the hit rate of a single target in either the most ipsilesional or contralesional column was evaluated. Conditions with either no additional targets, 1 additional target (located at the same side), two additional targets (located at the opposite side), or five additional targets (two located at the same side, three located at the opposite side) were included (). No dissociation was made between the two conditions with five additional targets. Note that for all conditions, there were never additional targets in the same column as that of our reference target, so that the additional targets were always located either contralesional or ipsilesional from the reference target. For each group (LBD-, RBD-, RBD+) and side (most ipsilesional target, most contralesional target) a Friedman Test with the number of additional targets (0, 1, 2, 5) as within-subjects’ factor was conducted. The dependent variable was the percentage of hits for the reference target.
Relation with conventional neuropsychological VSN tasks and neglect behavior in daily life
Finally, the relations between the overall performance on the visual search task with performance on conventional neuropsychological paper-and-pencil tasks for VSN, and neglect behavior in daily life were evaluated. Spearman correlations between the asymmetry in percentage of hits and the omission difference score on the shape cancellation task, the average deviation on the line bisection task, and the Catherine Bergego Scale total score were computed, including all patients with available data on the given task. Spearman’s rho was interpreted as small (>.1), moderate (>.3), large (>.5), or very large (>.7) (Dancey & Reidy, Citation2004).
Results
Demographic and stroke-related characteristics
Demographic and stroke-related characteristics, and scores on the VSN tasks are depicted in , split per group. Groups did not differ regarding age, sex, stroke type, level of independence during daily life activities (Barthel Index), and strength in both upper and lower extremities (Motricity Index). Patients in the RBD+ group were admitted to the rehabilitation center later post-stroke compared to patients in the LBD- group, U = 224, r = −0.48, and RBD-group, U = 413.5, r = −0.27. The LBD-group and RBD-group did not significantly differ regarding the time post-stroke, U = 1128, r = −0.14. Furthermore, patients in the RBD+ group had lower global cognitive functioning (Montreal Cognitive Assessment) than patients in the RBD-group, U = 251, r = −0.40. The LBD-group did not significantly differ from the RBD-group, U = 781.5, r = −0.15, or the RBD+ group, U = 364.5, r = −0.19, regarding global cognitive functioning. Finally, as expected due to the group categorization, patients in the RBD+ group obtained higher scores on the neglect tasks than patients in the LBD-group (shape cancellation: U = 96, r = −0.75; line bisection: U = 85, r = −0.68; Catherine Bergego Scale: U = 68, r = −0.63) and RBD-group (shape cancellation: U = 125, r = −0.70; line bisection: U = 140, r = −0.61; Catherine Bergego Scale: U = 133.5, r = −0.53), who did not differ from each other (shape cancellation: U = 1224, r = −0.09; line bisection: U = 1192, r = −0.08; Catherine Bergego Scale: U = 854.5, r = 0).
Table 1. Demographic and stroke-related characteristics, median (interquartile range) or percentage, split for 49 patients with left-brain damage without visuospatial neglect (LBD-), 55 right-brain damage without visuospatial neglect (RBD-), and 23 right-brain damage with visuospatial neglect (RBD+).a.
Overall hit rate, search speed, search consistency, and revisits
In , the percentage of hits (i.e., ipsilesional, contralesional, and asymmetry), center of cancellation, trial duration, search consistency (best r), number of immediate revisits, and number of delayed revisits are depicted.
Table 2. Overall hit rate, search speed (i.e., trial duration), search consistency (i.e., best r), revisits (i.e., immediate and delayed), and initial spatial bias (i.e., starting point, center of starting points, search time for a single left and right target) at the visual search task. Medians (interquartile range) split for 49 patients with left-brain damage without visuospatial neglect (LBD-), 55 right-brain damage without visuospatial neglect (RBD-), and 23 right-brain damage with visuospatial neglect (RBD+)
Compared to patients in the LBD- and RBD-groups, patients in the RBD+ group missed more targets at their ipsilesional side (LBD-: U = 308, r = −0.40; RBD-: U = 381, r = −0.34), their contralesional side (LBD-: U = 81, r = −0.71; RBD-: U = 138.5, r = −0.63), obtained a larger asymmetry score (LBD-: U = 114, r = −0.66; RBD-: U = 156.5, r = −0.60), and a larger center of cancellation (LBD-: U = 75, r = −0.71; RBD-: U = 120, r = −0.65; and ). There was no difference between patients in the LBD- and RBD-groups regarding the percentage of hits at the ipsilesional side, U = 1312, r = −0.03, contralesional side, U = 1261.5, r = −0.06, asymmetry score, U = 1328.5, r = −0.01, or center of cancellation, U = 1251, r = −0.07.
Figure 3. Boxplots depicting the percentage of hits for targets at the ipsilesional (ipsi) and contralesional side (contra), averaged over all conditions. The thick line in the middle is the median. The top and bottom box lines show the first and third quartiles. The whiskers show the maximum and minimum values, with the exceptions of outliers. Individual scores are depicted by gray circles. Data is split for patients with left-brain damage without visuospatial neglect (LBD-), right-brain damage without visuospatial neglect (RBD-), and right-brain damage with visuospatial neglect (RBD+)
The groups did not differ regarding average trial duration or search consistency (best r). Finally, there was no significant difference in the number of immediate revisits between groups, whereas patients in the RBD+ group made more delayed revisits than patients in the LBD-group, U = 391.5, r = −0.34, and RBD-group, U = 432, r = −0.36. There was no difference in the number of delayed revisits between the LBD- and RBD-groups, U = 1330.5, r = −0.02.
Initial spatial bias
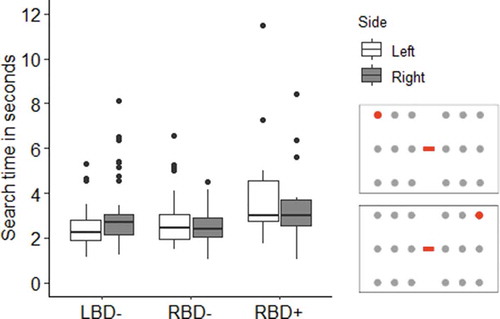
The initial spatial bias was evaluated with respect to the left or right side of the stimulus field. There was a difference regarding the starting point between the three groups. Results were similar for the two different outcome measures; the percentage of trials in which the starting point was on the left side and the center of starting points (). The LBD-group started more often at their left side than the RBD-group (starting point % left: U = 652, r = −0.44; center of starting points: U = 640, r = −0.45) and the RBD+ group (starting point % left: U = 126, r = −0.62; center of starting points: U = 120.5, r = −0.63). The RBD-group started more often at their left side than the RBD+ group (starting point % left: U = 382, r = −0.31; center of starting points: U = 378.5, r = −0.32). There was no difference between groups in search time for a single left versus single right target ( and ).
Figure 4. Boxplots depicting the search time in seconds to find a single left or right target. The thick line in the middle is the median. The top and bottom box lines show the first and third quartiles. The whiskers show the maximum and minimum values, with the exceptions of outliers, which are depicted by black dots. Data is split for patients with left-brain damage without visuospatial neglect (LBD-), right-brain damage without visuospatial neglect (RBD-), and right-brain damage with visuospatial neglect (RBD+). Only patients who had found this target at least once for each side, and for whom data on timing was present, were included. This was the case for 48 LBD- patients, 53 RBD- patients, and 14 RBD+ patients. The figure on the right shows a representation of example conditions of trials that were included for the analysis. The targets are depicted in red, the distractors in gray
Effect of target column on hit rate
The hit rates for eachtarget per column are depicted in . For patients in the LBD-group, the hit rate did not differ between targets in different columns at the ipsilesional side, χ2(2) = 2.00, p =.368, r = 0.05, or at the contralesional side, χ2(2) = 2.80, p = .247, r = 0.10.
Figure 5. Boxplots depicting the median percentage of hits for the condition with one target per column. Hit percentage is presented for targets at the ipsilesional (Ipsi) and contralesional side (Contra), split per column. Columns 1, 2, and 3 refer to columns at the most ipsilesional side to the most contralesional side. The thick line in the middle is the median. The top and bottom box lines show the first and third quartiles. The whiskers show the maximum and minimum values, with the exceptions of outliers. Individual scores are depicted by gray circles. Data is split for patients with left-brain damage without visuospatial neglect (LBD-), right-brain damage without visuospatial neglect (RBD-), and right-brain damage with visuospatial neglect (RBD+). The figure on the right shows a representation of example conditions of trials that were included for the analysis. The targets are depicted in red, the distractors in gray
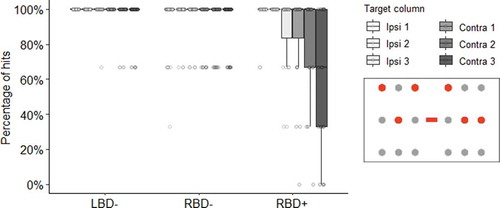
Similarly, in the RBD-group, no difference in hit rate was seen between targets in different columns at the ipsilesional side, χ2(2) = 3.50, p = .174, r = 0.13, or at the contralesional side, χ2(2) = 0, p = 1.00, r = −0.54.
For patients in the RBD+ group, there was no difference in hit rate for targets in different columns at the ipsilesional side, χ2(2) = 8.00, p = .018, r = 0.61. The hit rate differed between targets in different columns at the contralesional side, χ2(2) = 21.78, p < .001, r = 0.73. The hit rate was lower for targets in column 3 versus column 2, Z = −3.13, p = .002, r = −0.65, and for targets in column 3 versus column 1, Z = −3.21, p = .001, r = −0.67, both large effect sizes. There was no difference in hit rate between targets in column 1 versus column 2, Z = −1.41, p = .157, r = −0.29.
Effect of number of targets on overall hit rate
To test our main hypothesis that patients in the RBD+ group would find a lower percentage of targets when more targets were present, we evaluated the effect of number of targets on overall hit rate without dissociating between the ipsilesional and contralesional side. shows the overall percentage of hits per total number of targets, split per group.
Figure 6. The percentage of hits for conditions with 2, 3, 4 or 6 targets. The thick line in the middle is the median. The top and bottom box lines show the first and third quartiles. The whiskers show the maximum and minimum values, with the exceptions of outliers. Individual scores are depicted by gray circles. Data is split for patients with left-brain damage without visuospatial neglect (LBD-), right-brain damage without visuospatial neglect (RBD-), and right-brain damage with visuospatial neglect (RBD+). The figure on the right shows a representation of example conditions of trials that were included for the analysis. The targets are depicted in red, the distractors in gray
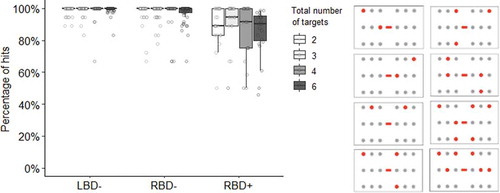
In the LBD-group, there was no effect of the number of targets on overall hit rate, χ2(2) = 7.29, p = .063, r = 0.22.
In the RBD-group, there was no effect of number of targets on overall hit rate, χ2(2) = 10.44, p = .015, r = 0.29.
In the RBD+ group, the overall hit rate was affected by the number of targets, χ2(2) = 11.93, p = .008, r = 0.50. There was a significant lower hit rate in conditions with six versus three targets, Z = −2.74, p = .006, r = −0.57, with a large effect size. The overall hit rate did not differ for conditions with two versus three targets, Z = −0.74, p = .462, r = −0.15, two versus four targets, Z = −1.03, p = .305, r = −0.21, two versus six targets, Z = −2.43, p = .015, r = −0.51, three versus four targets, Z = −1.27, p = .204, r = −0.26, and four versus six targets, Z = −0.89, p = .372, r = −0.19.
Effect of number of targets on hit rate of the most peripheral target
Here, we present results on the effect of number of targets on hit rate of the most peripheral (ipsilesional or contralesional) target. The hit rates for the most ipsilesional and contralesional target per group are depicted in .
Figure 7. The percentage of hits for conditions with one target in the most peripheral column, and 0, 1, 2, or 5 additional targets in the other columns. Hit percentage is presented for the reference target in the most ipsilesional and most contralesional column, split per number of additional targets (0, 1, 2, or 5). The thick line in the middle is the median. The top and bottom box lines show the first and third quartiles. The whiskers show the maximum and minimum values, with the exceptions of outliers. Individual scores are depicted by gray circles. Data is split for patients with left-brain damage without visuospatial neglect (LBD-), right-brain damage without visuospatial neglect (RBD-), and right-brain damage with visuospatial neglect (RBD+). The figure on the right shows a representation of example conditions of trials that were included for the analysis. The reference target is depicted in dark red, the additional targets in red, and the distractors in gray
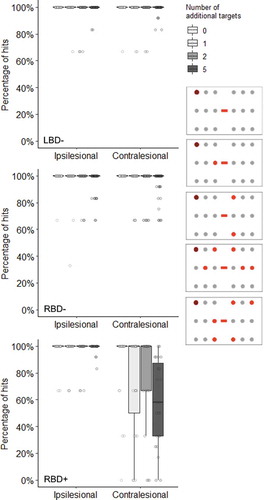
In the LBD-group, there was no effect of number of targets on the hit rate for the most ipsilesional target, χ2(2) = 4.09, p = .252, r = 0.10, or the most contralesional target, χ2(2) = 3.60, p = .308, r = 0.07.
In the RBD-group, there was no effect of number of targets on the hit rate for the most ipsilesional target, χ2(2) = 6.85, p = .077, r = 0.19. There was an effect of number of targets on the hit rate for the most contralesional target, χ2(2) = 14.45, p = .002, r = 0.39. Post-hoc tests comparing all possible pairs of conditions showed that the hit rate for the most contralesional target was lower when there were two extra targets versus no extra targets, Z = −2.83, p = .005, r = −0.38, or five extra targets versus no extra targets, Z = −3.10, p = .002, r = −0.42, both medium effect sizes. There was no difference in the hit rate for the most contralesional target between conditions with no versus one extra target, Z = −2.24, p = .025, r = −0.30, one versus two extra targets, Z = −1.00, p = .317, r = −0.13, one versus five extra targets, Z = −0.74, p = .459, r = −0.10, and two versus five extra targets, Z = −0.32, p = .753, r = −0.04.
In the RBD+ group, there was no effect of number of targets on the hit rate for the most ipsilesional target, χ2(2) = 0.41, p = .938, r = −0.32. There was an effect of number of targets on the hit rate for the most contralesional target, χ2(2) = 24.13, p < .001, r = 0.73. Post-hoc tests comparing all possible pairs of conditions showed that the hit rate for the most contralesional target was lower when there were five versus no extra targets, Z = −3.37, p = .001, r = −0.70, and when there were five versus two extra targets, Z = −2.84, p = .004, r = −0.59, both large effects. There was no difference in the hit rate for the most contralesional target between conditions with no versus one extra target, Z = −1.63, p = .104, r = −0.34, no versus two extra targets, Z = −1.07, p = .286, r = −0.22, one versus two extra targets, Z = −1.51, p = .132, r = −0.31, and one versus five extra targets, Z = 1.74, p = .082, r = −0.36.
These results suggest that additional targets reduce the hit rate of the most contralesional target in patients with right-brain damage, with or without VSN, whereas this is not the case for patients with left-brain damage.
Relation with conventional neuropsychological VSN tasks and neglect behavior in daily life
Finally, we assessed the relation between our visual search task and conventional VSN tasks, and neglect behavior in daily life. There were moderate positive relations between the asymmetry in percentage of hits and the omission difference score at the shape cancellation task, r = .45, p < .001, the deviation at the line bisection task, r = .45, p < .001, and the total score of the Catherine Bergego Scale, r = .42, p < .001.
Discussion
The aim of this study was to investigate whether the number of targets affect visual search in patients with VSN. In our experiment, we administered a visual search task in which the locations and number of targets varied from trial to trial.
Our main hypothesis was that patients with VSN would find a lower percentage of targets when more targets were present, in contrast to patients without VSN. Adding targets indeed decreased hit rate in patients with VSN, with large effects on the overall hit rate and the most contralesional target, but no effect on the most ipsilesional target. In other words, the likelihood of finding the most contralesional target was reduced by the presence and number of additional targets located ipsilesional relative to that target. For patients with right-brain damage without VSN, the presence of additional targets also negatively affected hit rate for the most contralesional target, which was a medium effect. This was not seen for the overall hit rate or the most ipsilesional target. Possibly, this is due to a general spatial working memory deficit due to right hemispherical damage (Chechlacz et al., Citation2014; Malhotra et al., Citation2005), and a small leftward attention bias for some patients who had right-brain damage but did not meet the threshold to be classified as having VSN.
The effect of additional targets on hit rate, especially on hit rate for the most contralesional target, can be explained by an attentional competition between targets in which ipsilesional items win over contralesional ones. This includes visual extinction, in which patients fail to be aware of a contralesional target when there is a simultaneous competing ipsilesional target is presented, and/or a disengaging deficit in which patients have difficulties disengaging their attention from additional ipsilesional targets to engage the most contralesional target (Husain, Citation2019; Losier & Klein, Citation2001; Morrow & Ratcliff, Citation1988; Posner et al., Citation1982).
There were two crucial differences between our study and previous case studies (Chatterjee et al., Citation1992a, Citation1992b; Husain & Kennard, Citation1997; Kartsounis & Findley, Citation1994), and the study with seven patients (Chatterjee et al., Citation1999) in which the effect of number of target on search performance in VSN was evaluated. First, in previous studies, the number of targets was always equally distributed across the search array. In the current study, we specifically assessed the effect of adding targets at the ipsilesional or contralesional side on hit rate for either the most peripheral contralesional or the most peripheral ipsilesional target. This allowed us to show that the negative effect of adding targets on hit rate was largest for the most contralesional target in patients with right-brain damage. Second, in contrast with previous studies, we kept the total number of stimuli constant. Thus, in conditions with less targets, there were automatically more distractors. By keeping the number of stimuli consistent across conditions, we could specifically investigate the effect of additional targets on top of any effect of distractors. Therefore, we can conclude that adding targets to a search array will have a larger negative effect on search performance in VSN than adding the same number of distractors would have.
We also evaluated other attention-related parameters that have previously been associated with VSN. First, we verified whether the likelihood of finding targets would reduce as a function of horizontal position, while keeping the number of targets constant. As expected, patients with VSN missed more targets at their contralesional side than at their ipsilesional side, in contrast to the groups without VSN. More specifically, in patients with VSN, targets that were located in the most contralesional column were found less often than targets that were located in other columns. Even though comparisons between other columns were not statistically significant, there was a pattern for a reduced likelihood of finding targets in columns that were located more toward the contralesional side, both within the ipsilesional and contralesional hemifield. There are several explanations for this outcome which is typically seen in patients with VSN. First, it can be explained by a gradient in spatial attention in patients with VSN. According to the orientational bias model of attention of Kinsbourne (Citation1987), VSN is a directional, not a hemispace, phenomenon. The attentional bias in left-sided VSN is not only confined to the side of stimulation (i.e., the left or right hemispace), but is confounded with the relative location of the stimuli (i.e., one being to the right or left of the other). In visual search tasks, there is ample evidence for Kinsbourne’s hypothesis of VSN as a directional bias. In left-sided VSN patients, the attentional deficit typically follows a left-right gradient, with a gradual increase of detected targets and/or detection speed of targets from left to right across the stimulus page (Butler et al., Citation2004; De Renzi et al., Citation1989; Halligan et al., Citation1992; Hildebrandt et al., Citation1999; Mark & Heilman, Citation1997; Marshall & Halligan, Citation1989; Small et al., Citation1994). Second, it could be explained by object-based neglect for the two separate grids. There is a distinction between spatial-based neglect (i.e., a bias with respect to the body, egocentric) and object-based neglect (i.e., a bias with respect to an object or area, allocentric). These forms of neglect can vary between patients (Mizuno et al., Citation2016; Ota et al., Citation2001), but also within patients depending on task demands, stimulus characteristics (such as the width of the stimulus field), and task instructions regarding on which area to focus (Behrmann & Tipper, Citation1999; Karnath & Niemeier, Citation2002). In our search task, we presented the stimuli in two grids, with space in between grids. This could have affected performance, as these grids could have been perceived as two ‘objects,’ resulting in VSN for the contralesional side of each object, in combination with the overall ipsilesional bias with respect to the body midline. Third, eye movement studies showed that, although there is a positive relation between the horizontal location and fixation frequency, the left-right gradient would predict a peak of maximum fixations on the extreme right, which is not always observed in patients with VSN (Behrmann et al., Citation1997; Karnath et al., Citation1998; Sprenger et al., Citation2002). Instead, this lack of a peak of maximum fixations on the extreme right could indicate that the midsagittal plane of the patient is shifted toward the ipsilesional side, with a symmetrical distribution of eye movements around this shifted point. An ipsilesional shift of the attention peak could also explain our observed pattern of a lower hit rate for more contralesional targets in patients with VSN. It is likely that different mechanisms are at play across patients, and that even within one patient multiple mechanisms play a role.
There were no differences between groups regarding overall search time, even though patients with VSN found less targets than patients without VSN. Surprisingly, there was no difference in search consistency between patients with left- and right-brain damage with or without VSN, even though this has been reported in previous studies (Rabuffetti et al., Citation2012; Ten Brink et al., Citation2016, Citation2016; Weintraub & Mesulam, Citation1988). This inconsistency can be explained by the low number of targets in the present study, which might be less sensitive to capture subtle alterations in search organization (i.e., there might have been a ceiling effect). Finally, there was no difference between groups regarding the number of immediate revisits, whereas patients with VSN made more delayed revisits than patients without VSN. Revisiting targets can be explained by deficits in spatial working memory, often associated with VSN (Kaufmann et al., Citation2020; Mannan et al., Citation2005; Saj et al., Citation2020; Wansard et al., Citation2014).
When at least one target was presented at each side, most patients with left-sided brain damage without VSN tapped a left target first. Of the right-brain damage patients, half of patients without VSN and most patients with VSN started with a right target. Thus, both lesion side and having VSN or not affect the initial attention bias, with a leftward bias for patients with left-sided brain damage without VSN, no bias for patients with right-sided brain damage without VSN, and a rightward bias for patients with right-sided brain damage and VSN. Neurologically healthy participants tend to exhibit a (small) initial spatial bias toward the left side. In eye-tracking studies on free viewing of images and face perception there usually is an initial leftward bias in exploration (e.g., Butler & Harvey, Citation2005; Mertens et al., Citation1993; Ossandon et al., Citation2014; Walshe & Nuthmann, Citation2014). In addition, when asked to bisect the middle of a line, healthy participants make small leftward errors (i.e., pseudoneglect; Bowers & Heilman, Citation1980; Jewell & McCourt, Citation2000) or perceive the mark in a pre-bisected line shifted toward the right side, consistent with an overestimation of the left-sided line segment (Toba et al., Citation2011). The cause of this leftward bias remains unresolved but could be due to hemispheric asymmetries in visuospatial attention (Bowers & Heilman, Citation1980; Jewell & McCourt, Citation2000). An alternative explanation is that the leftward bias is due to reading direction habits (Afsari et al., Citation2016; Chokron & Imbert, Citation1993). As we did not assess the initial spatial bias in a group of neurologically healthy controls, we cannot conclude whether the initial bias shifted toward the left in patients with left-sided brain damage and toward the right in patients with right-sided brain damage, or whether a shift was present for one of the groups only. Nevertheless, it can be concluded that having VSN after right-brain damage leads to a shift in initial spatial bias toward the right side of the stimulus array compared to patients without VSN. Against our expectations, there was no difference in search speed for a single left or single right target between any of the groups. Possibly, other factors such as motor deficits might have overshadowed subtle effects of attention bias in search speed.
Finally, when assessing the relation between performance at our visual search task and conventional neuropsychological paper-and-pencil tasks for VSN, moderate positive relations were observed between the asymmetry in percentage of hits at our search task and performance on the shape cancellation task and line bisection task. Similarly, a moderate positive relation was seen between the asymmetry in percentage of hits and neglect behavior in daily life, as measured with the Catherine Bergego Scale. These positive relationships show that our visual search task measures a similar construct as the shape cancellation and line bisection task, and that impairments on the visual search task are related to neglect behavior in daily life situations. However, assessing these relationships is only partly informative. Conventional paper-and-pencil tasks, including the shape cancellation and line bisection tasks, lack sensitivity in the diagnosis of VSN (Azouvi, Citation2017). Paper-and-pencil tasks are static (i.e., stimuli are not moving and there is unlimited time) and only one cognitive operation has to be performed at once. In dynamic, daily life situations, stimuli have to be detected within a moving environment in which one is also moving, there is little time to attend to objects, and often multiple operations have to be performed simultaneously (e.g., walking, chatting, and looking). An observation scale, such as the Catherine Bergego Scale, overcomes these problems, but has the disadvantage of being assessed in an unstandardized environment and is, therefore, less comparable between patients. Other solutions are to administer tasks with a time limit, brief stimulus presentations, or moving stimuli; or tasks in which two cognitive operations have to be performed at the same time. Such tasks are usually more sensitive to a lateralized attention bias compared to classic paper-and-pencil tasks, especially in the chronic phase post-stroke (e.g., Bonato et al., Citation2010; Marshall et al., Citation1997; Rengachary et al., Citation2009; Russell et al., Citation2004; Van der Stigchel & Nijboer, Citation2017; van Kessel et al., Citation2013). Nevertheless, in the current visual search task, several omissions were made despite the absence of a time limit, which can be considered a strength. It is generally accepted that for a diagnosis of VSN, a combination of tasks (preferably static and dynamic) should be administered (Spreij et al., Citation2020).
The visual search task that was used in the current study showed that increasing the number of targets negatively affects hit rate in patients with VSN. This finding is clinically relevant as in daily life situations, several salient objects or stimuli will compete for attention. Therefore, when assessing problems in spatial attention, it is essential to present multiple targets to resemble such situations, as we know now that it can negatively affect performance.
Limitations
In the current study, no data on visual field deficits, such as hemianopia, were present, and effects of hemianopia on our visual search task could not be evaluated. However, hemianopia is not specifically related to one of the hemispheres so it would have affected all groups, nor is it thought to affect the tests for VSN that were used to compose groups. In addition, visual search typically adapts fast after a visual field defect, within a few minutes after onset of simulated hemianopia, which likely parallels actual hemianopia (Simpson et al., Citation2011). The patients in this study were tested several weeks after stroke onset, making it likely that their visual search strategy was already adapted to any visual field defects.
Another limitation of the current study is that we were not able to reliably monitor eye movements. We tried to measure eye movements, however, the reaching movements toward the screen interfered too much with the eye-tracking recordings in order to collect reliable data. Measuring eye movements could provide more insight in the search strategy. For example, it could be determined how many fixations and saccades were made within the ipsilesional or contralesional side, whether missed targets were fixated or not, and whether locations were fixated repeatedly (i.e., which might be a more sensitive measure of working memory deficits than the number of immediate and delayed revisits) (Cox & Aimola Davies, Citation2020).
Finally, apart from lesion side, no information on specific lesion location was available. Different brain areas have been associated with impairments on different tests and subcomponents of VSN. For example, different brain regions have been associated with object finding (i.e., visual search) versus object perception (i.e., line bisection) (e.g., Binder et al., Citation1992; Karnath & Rorden, Citation2012; Molenberghs et al., Citation2012). Most likely, our sample of VSN patients consisted of a heterogeneous population with different lesion locations, as we selected patients based on impairment on cancellation, line bisection, and/or neglect behavior in daily life as measured with the Catherine Bergego Scale. Future studies could assess different profiles of search behavior related to specific lesion sites.
Conclusion
To conclude, in patients with right-brain damage, adding targets to the stimulus field reduced the likelihood of finding the most contralesional target, whereas this was not the case for the most ipsilesional target nor for patients with leftbrain damage. In patients with VSN, this effect was even larger and was also reflected in the overall hit rate, which was not seen in patients without VSN. These results provide insight in circumstances under which visual search in VSN is impaired, showing that a higher number of targets will reduce the likelihood of finding contralesional targets in VSN. The impairments evoked by additional targets should be taken into account in visual search tasks in VSN to make them more sensitive, which is highly important for clinical assessment and research purposes.
Acknowledgments
We would like to thank all patients who were willing to participate in this study, and rehabilitation centers De Hoogstraat and De Parkgraaf for their time and participation. We thank the research assistants for their help in testing the patients.
Disclosure statement
No potential conflict of interest was reported by the author(s).
Additional information
Funding
References
- Afsari, Z., Ossandón, J. P., & König, P. (2016). The dynamic effect of reading direction habit on spatial asymmetry of image perception. Journal of Vision, 16(11), 8. https://doi.org/10.1167/16.11.8
- Aglioti, S., Smania, N., Barbieri, C., & Corbetta, M. (1997). Influence of stimulus salience and attentional demands on visual search patterns in hemispatial neglect. Brain and Cognition, 34(3), 388–403. https://doi.org/10.1006/brcg.1997.0915
- Appelros, P., Karlsson, G. M., Seiger, A., & Nydevik, I. (2002). Neglect and anosognosia after first-ever stroke: Incidence and relationship to disability. Journal of Rehabilitation Medicine, 34(5), 215–220. https://doi.org/10.1080/165019702760279206
- Azouvi, P. (2017). The ecological assessment of unilateral neglect. Annals of Physical and Rehabilitation Medicine, 60(3), 186–190. https://doi.org/10.1016/j.rehab.2015.12.005
- Azouvi, P., Olivier, S., de Montety, G., Samuel, C., Louis-Dreyfus, A., & Tesio, L. (2003). Behavioral assessment of unilateral neglect: Study of the psychometric properties of the Catherine Bergego Scale. Archives of Physical Medicine and Rehabilitation, 84(1), 51–57. https://doi.org/10.1053/apmr.2003.50062
- Bartolomeo, P. (1997). The novelty effect in recovered hemineglect. Cortex, 33(2), 323–333. https://doi.org/10.1016/S0010-9452(08)70008-X
- Behrmann, M., & Tipper, S. P. (1999). Attention accesses multiple reference frames: Evidence from visual neglect. Journal of Experimental Psychology. Human Perception and Performance, 25(1), 83–101. https://doi.org/10.1037/0096-1523.25.1.83
- Behrmann, M., Watt, S., Black, S. E., & Barton, J. J. S. (1997). Impaired visual search in patients with unilateral neglect: An oculographic analysis. Neuropsychologia, 35(11), 1445–1458. https://doi.org/10.1016/S0028-3932(97)00058-4
- Binder, J., Marshall, R., Lazar, R., Benjamin, J., & Mohr, J. P. (1992). Distinct syndromes of hemineglect. Archives of Neurology, 49(11), 1187–1194. https://doi.org/10.1001/archneur.1992.00530350109026
- Blini, E., Romeo, Z., Spironelli, C., Pitteri, M., Meneghello, F., Bonato, M., & Zorzi, M. (2016). Multi-tasking uncovers right spatial neglect and extinction in chronic left-hemisphere stroke patients. Neuropsychologia, 92(2016), 147–157. https://doi.org/10.1016/j.neuropsychologia.2016.02.028
- Bonato, M. (2015). Unveiling residual, spontaneous recovery from subtle hemispatial neglect three years after stroke. Frontiers in Human Neuroscience, 9(July), 1–9. https://doi.org/10.3389/fnhum.2015.00413
- Bonato, M., Priftis, K., Marenzi, R., Umiltà, C., & Zorzi, M. (2010). Increased attentional demands impair contralesional space awareness following stroke. Neuropsychologia, 48(13), 3934–3940. https://doi.org/10.1016/j.neuropsychologia.2010.08.022
- Bonato, M., Priftis, K., Marenzi, R., Umiltà, C., & Zorzi, M. (2012). Deficits of contralesional awareness: A case study on what paper-and-pencil tests neglect. Neuropsychology, 26(1), 20–36. https://doi.org/10.1037/a0025306
- Bonato, M., Priftis, K., Umiltà, C., & Zorzi, M. (2013). Computer-based attention-demanding testing unveils severe neglect in apparently intact patients. Behavioural Neurology, 26(3), 179–181. https://doi.org/10.3233/BEN-2012-129005
- Bowers, D., & Heilman, K. M. (1980). Pseudoneglect: Effects of hemispace on a tactile line bisection task. Neuropsychologia, 18(4–5), 491–498. https://doi.org/10.1016/0028-3932(80)90151-7
- Butler, B. C., Eskes, G. A., & Vandorpe, R. A. (2004). Gradients of detection in neglect: Comparison of peripersonal and extrapersonal space. Neuropsychologia, 42(3), 346–358. https://doi.org/10.1016/j.neuropsychologia.2003.08.008
- Butler, S. H., & Harvey, M. (2005). Does inversion abolish the left chimeric face processing advantage? Cognitive Neuroscience and Neuropsychology, 16(18), 1991–1993. https://doi.org/10.1097/00001756-200512190-00004
- Buxbaum, L. J., Ferraro, M. K., Veramonti, T., Farne, A., Whyte, J., Ladavas, E., Frassinetti, F., & Coslett, H. B. (2004). Hemispatial neglect: Subtypes, neuroanatomy, and disability. Neurology, 62(5), 749–756. https://doi.org/10.1212/01.WNL.0000113730.73031.F4
- Chatterjee, A., Mennemeier, M., & Heilman, K. M. (1992a). Search patterns and neglect: A case study. Neuropsychologia, 30(7), 657–672. https://doi.org/10.1016/0028-3932(92)90070-3
- Chatterjee, A., Mennemeier, M., & Heilman, K. M. (1992b). A stimulus-response relationship in unilateral neglect: The power function. Neuropsychologia, 30(12), 1101–1108. https://doi.org/10.1016/0028-3932(92)90101-Q
- Chatterjee, A., Thompson, K. A., & Ricci, R. (1999). Quantitative analysis of cancellation tasks in neglect. Cortex, 35(2), 253–262. https://doi.org/10.1016/S0010-9452(08)70798-6
- Chechlacz, M., Rotshtein, P., & Humphreys, G. W. (2014). Neuronal substrates of Corsi Block span: Lesion symptom mapping analyses in relation to attentional competition and spatial bias. Neuropsychologia, 64(2014), 240–251. https://doi.org/10.1016/j.neuropsychologia.2014.09.038
- Chen, P., Chen, C. C., Hreha, K., Goedert, K. M., & Barrett, A. M. (2015). Kessler foundation neglect assessment process uniquely measures spatial neglect during activities of daily living. Archives of Physical Medicine and Rehabilitation, 96(5), 869–876.e1. https://doi.org/10.1016/j.apmr.2014.10.023
- Chokron, S., & Imbert, M. (1993). Influence of reading habits on line bisection. Cognitive Brain Research, 1(4), 219–222. https://doi.org/10.1016/0926-6410(93)90005-P
- Collin, C., & Wade, D. (1990). Assessing motor impairment after stroke: A pilot reliability study. Journal of Neurology, Neurosurgery, and Psychiatry, 53(7), 576–579. https://doi.org/10.1136/jnnp.53.7.576
- Collin, C., Wade, D., Davies, S., & Horne, V. (1988). The Barthel ADL index: A reliability study. Disability and Rehabilitation, 10(2), 61–63. https://doi.org/10.3109/09638288809164103
- Cox, J. A., & Aimola Davies, A. M. (2020). Keeping an eye on visual search patterns in visuospatial neglect: A systematic review. Neuropsychologia, 146, 107547. https://doi.org/10.1016/j.neuropsychologia.2020.107547
- Dalmaijer, E. S., Van der Stigchel, S., Nijboer, T. C. W., Cornelissen, T. H. W., & Husain, M. (2014). CancellationTools: All-in-one software for administration and analysis of cancellation tasks. Behavior Research Methods. 47(4), 1065–1075. https://doi.org/10.3758/s13428-014-0522-7
- Dancey, C., & Reidy, J. (2004). Statistics without maths for psychology: Using SPSS for windows. Prentice Hall.
- De Renzi, E., Gentilini, M., Faglioni, P., & Barbieri, C. (1989). Attentional shift towards the rightmost stimuli in patients with left visual neglect. Cortex, 25(2), 231–237. https://doi.org/10.1016/S0010-9452(89)80039-5
- Eglin, M., Robertson, L. C., & Knight, R. T. (1989). Visual search performance in the neglect syndrome. Journal of Cognitive Neuroscience, 1(4), 372–385. https://doi.org/10.1162/jocn.1989.1.4.372
- Elshout, J. A., Nijboer, T. C. W., & Van der Stigchel, S. (2019). Is congruent movement training more effective than standard visual scanning therapy to ameliorate symptoms of visuospatial neglect? Study protocol of a randomised control trial. BMJ Open, 9(12), e031884. https://doi.org/10.1136/bmjopen-2019-031884
- Emerson, R. L., García-Molina, A., López Carballo, J., García Fernández, J., Aparicio-López, C., Novo, J., Sánchez-Carrión, R., Enseñat-Cantallops, A., & Peña-Casanova, J. (2019). Visual search in unilateral spatial neglect: The effects of distractors on a dynamic visual search task. Applied Neuropsychology. Adult, 26(5), 401–410. https://doi.org/10.1080/23279095.2018.1434522
- Field, A. (2013). Discovering statistics using IBM SPSS statistics (4th ed.). Sage Publications Ltd.
- Gainotti, G., D’Erme, P., & Bartolomeo, P. (1991). Early orientation of attention toward the half space ipsilateral to the lesion in patients with unilateral brain damage. Journal of Neurology, Neurosurgery & Psychiatry, 54(12), 1082–1089. https://doi.org/10.1136/jnnp.54.12.1082
- Gainotti, G., De Luca, L., Figliozzi, F., & Doricchi, F. (2009). The influence of distracters, stimulus duration and hemianopia on first saccade in patients with unilateral neglect. Cortex, 45(4), 506–516. https://doi.org/10.1016/j.cortex.2007.12.008
- Gainotti, G., Messerli, P., & Tissot, R. (1972). Qualitative analysis of unilateral spatial neglect in relation to laterality of cerebral lesions. Journal of Neurology, Neurosurgery, and Psychiatry, 35(4), 545–550. https://doi.org/10.1136/jnnp.35.4.545
- Halligan, P. W., Burn, J. P., Marshall, J. C., & Wade, D. T. (1992). Visuo-spatial neglect: Qualitative differences and laterality of cerebral lesion. Journal of Neurology, Neurosurgery, and Psychiatry, 55(11), 1060–1068. https://doi.org/10.1136/jnnp.55.11.1060
- Harvey, M., Olk, B., Muir, K., & Gilchrist, I. D. (2002). Manual responses and saccades in chronic and recovered hemispatial neglect: A study using visual search. Neuropsychologia, 40(7), 705–717. https://doi.org/10.1016/S0028-3932(01)00189-0
- Heilman, K. M., & Abell, T. V. D. (1980). Right hemisphere dominance for attention: The mechanism underlying hemispheric asymmetries of inattention (neglect). Neurology, 30(3), 327. https://doi.org/10.1212/WNL.30.3.327
- Hildebrandt, H., Gießelmann, H., & Sachsenheimer, W. (1999). Visual search and visual target detection in patients with infarctions of the left or right posterior or the right middle brain artery. Journal of Clinical and Experimental Neuropsychology, 21(1), 94–107. https://doi.org/10.1076/jcen.21.1.94.947
- Holm, S. (1978). A simple sequentially rejective multiple test procedure. Scandinavian Journal of Statistics, 6(2), 65–70. https://doi.org/10.2307/4615733
- Husain, M. (2019). Visual attention: What inattention reveals about the brain. Current Biology, 29(7), R262–R264. https://doi.org/10.1016/j.cub.2019.02.026
- Husain, M., & Kennard, C. (1997). Distractor-dependent frontal neglect. Neuropsychologia, 35(6), 829–841. https://doi.org/10.1016/S0028-3932(97)00034-1
- Husain, M., Mannan, S., Hodgson, T., Wojciulik, E., Driver, J., & Kennard, C. (2001). Impaired spatial working memory across saccades contributes to abnormal search in parietal neglect. Brain, 124(5), 941–952. https://doi.org/10.1093/brain/124.5.941
- Jalas, M. J., Lindell, A. B., Brunila, T., Tenovuo, O., & Hamalainen, H. (2002). Initial rightward orienting bias in clinical tasks: Normal subjects and right hemispheric stroke patients with and without neglect. Journal of Clinical and Experimental Neuropsychology, 24(4), 479–490. https://doi.org/10.1076/jcen.24.4.479.1036
- Jewell, G., & McCourt, M. E. (2000). Pseudoneglect: A review and meta-analysis of performance factors in line bisection tasks. Neuropsychologia, 38(1), 93–110. https://doi.org/10.1016/S0028-3932(99)00045-7
- Karnath, H.-O., & Niemeier, M. (2002). Task-dependent differences in the exploratory behaviour of patients with spatial neglect. Neuropsychologia, 40(9), 1577–1585. https://doi.org/10.1016/S0028-3932(02)00020-9
- Karnath, H.-O., Niemeier, M., & Dichgans, J. (1998). Space exploration in neglect. Brain, 121(12), 2357–2367. https://doi.org/10.1093/brain/121.12.2357
- Karnath, H.-O., & Rorden, C. (2012). The anatomy of spatial neglect. Neuropsychologia, 50(6), 1010–1017. https://doi.org/10.1016/j.neuropsychologia.2011.06.027
- Kartsounis, L. D., & Findley, L. J. (1994). Task specific visuospatial neglect related to density and salience of stimuli. Cortex, 30(4), 647–659. https://doi.org/10.1016/S0010-9452(13)80241-9
- Kaufmann, B. C., Knobel, S. E. J., Nef, T., Müri, R. M., Cazzoli, D., & Nyffeler, T. (2020). Visual exploration area in neglect: A new analysis method for video-oculography data based on foveal vision. Frontiers in Neuroscience, 13(January), 1–14. https://doi.org/10.3389/fnins.2019.01412
- Keller, I., Volkening, K., & Garbacenkaite, R. (2015). Stimulus-dependent modulation of visual neglect in a touch-screen cancellation task. Neuropsychology, 29(3), 417–420. https://doi.org/10.1037/neu0000146
- Kinsbourne, M. (1987). Mechanisms of unilateral neglect. In M. Jeannerod (Ed.), Neurophysiological and neuropsychological aspects of spatial neglect (pp. 69–86). Elsevier Science. https://doi.org/10.1016/S0166-4115(08)61709-4
- Losier, B. J., & Klein, R. M. (2001). A review of the evidence for a disengage deficit following parietal lobe damage. Neuroscience and Biobehavioral Reviews, 25(1), 1–13. https://doi.org/10.1016/S0149-7634(00)00046-4
- Malhotra, P., Jäger, H., Parton, A., Greenwood, R., Playford, E., Brown, M., Driver, J., & Husain, M. (2005). Spatial working memory capacity in unilateral neglect. Brain, 128(2), 424–435. https://doi.org/10.1093/brain/awh372
- Mannan, S. K., Mort, D. J., Hodgson, T. L., Driver, J., Kennard, C., & Husain, M. (2005). Revisiting previously searched locations in visual neglect: Role of right parietal and frontal lesions in misjudging old locations as new. Journal of Cognitive Neuroscience, 17(2), 340–354. https://doi.org/10.1162/0898929053124983
- Mark, V. W., & Heilman, K. M. (1997). Diagonal neglect on cancellation. Neuropsychologia, 35(11), 1425–1436. https://doi.org/10.1016/S0028-3932(97)00067-5
- Marshall, J. C., & Halligan, P. W. (1989). Does the midsagittal plane play any privileged role in “left” neglect? Cognitive Neuropsychology, 6(4), 403–422. https://doi.org/10.1080/02643298908253290
- Marshall, S. C., Grinnell, D., Heisel, B., Newall, A., & Hunt, L. (1997). Attentional deficits in stroke patients: A visual dual task experiment. Archives of Physical Medicine and Rehabilitation, 78(1), 7–12. https://doi.org/10.1016/S0003-9993(97)90002-2
- McIntosh, R. D., Schindler, I., Birchall, D., & Milner, A. D. (2005). Weights and measures: A new look at bisection behaviour in neglect. Cognitive Brain Research, 25(3), 833–850. https://doi.org/10.1016/j.cogbrainres.2005.09.008
- Mertens, I., Siegmund, H., & Grüsser, O.-J. (1993). Gaze motor asymmetries in the perception of faces during a memory task. Neuropsychologia, 31(9), 989–998. https://doi.org/10.1016/0028-3932(93)90154-R
- Mizuno, K., Kato, K., Tsuji, T., Shindo, K., Kobayashi, Y., & Liu, M. (2016). Spatial and temporal dynamics of visual search tasks distinguish subtypes of unilateral spatial neglect: Comparison of two cases with viewer-centered and stimulus-centered neglect. Neuropsychological Rehabilitation, 26(4), 610–634. https://doi.org/10.1080/09602011.2015.1051547
- Molenberghs, P., Sale, M. V., & Mattingley, J. B. (2012). Is there a critical lesion site for unilateral spatial neglect? A meta-analysis using activation likelihood estimation. Frontiers in Human Neuroscience, 6(April), 78. https://doi.org/10.3389/fnhum.2012.00078
- Morrow, L., & Ratcliff, G. (1988). The disengagement of covert attention and the neglect syndrome. Psychobiology, 16(3), 261–269. http://link.springer.com/article/10.3758/BF03327316
- Nasreddine, Z. S., Phillips, N. A., Bédirian, V., Charbonneau, S., Whitehead, V., Collin, I., Cummings, J. L., & Chertkow, H. (2005). The montreal cognitive assessment, MoCA: A brief screening tool for mild cognitive impairment. Journal of the American Geriatrics Society, 53(4), 695–699. https://doi.org/10.1111/j.1532-5415.2005.53221.x
- Nijboer, T. C. W., Kollen, B. J., & Kwakkel, G. (2013). Time course of visuospatial neglect early after stroke: A longitudinal cohort study. Cortex, 49(8), 2021–2027. https://doi.org/10.1016/j.cortex.2012.11.006
- Nijboer, T. C. W., & Van der Stigchel, S. (2019). Visuospatial neglect is more severe when stimulus density is large. Journal of Clinical and Experimental Neuropsychology, 41(4), 399–410. https://doi.org/10.1080/13803395.2019.1566444
- Ossandon, J. P., Onat, S., & Konig, P. (2014). Spatial biases in viewing behavior. Journal of Vision, 14(2), 20. https://doi.org/10.1167/14.2.20
- Ota, H., Fujii, T., Suzuki, K., Fukatsu, R., & Yamadori, A. (2001). Dissociation of body-centered and stimulus-centered representations in unilateral neglect. Neurology, 57(11), 2064–2069. https://doi.org/10.1212/WNL.57.11.2064
- Pia, L., Ricci, R., Gindri, P., & Vallar, G. (2013). Drawing perseveration in neglect: Effects of target density. Journal of Neuropsychology, 7(1), 45–57. https://doi.org/10.1111/j.1748-6653.2012.02034.x
- Posner, M., Cohen, Y., & Rafal, R. (1982). Neural systems control of spatial orienting. Philosophical Transactions of the Royal Society. Series B: Biological Sciences, 298(1089), 187–198. https://doi.org/10.1098/rstb.1982.0081
- Rabuffetti, M., Farina, E., Alberoni, M., Pellegatta, D., Appollonio, I., Affanni, P., Forni, M., & Ferrarin, M. (2012). Spatio-temporal features of visual exploration in unilaterally brain-damaged subjects with or without neglect: Results from a touchscreen test. PloS One, 7(2), e31511. https://doi.org/10.1371/journal.pone.0031511
- Rengachary, J., D’Avossa, G., Sapir, A., Shulman, G. L., & Corbetta, M. (2009). Is the posner reaction time test more accurate than clinical tests in detecting left neglect in acute and chronic stroke? Archives of Physical Medicine and Rehabilitation, 90(12), 2081–2088. https://doi.org/10.1016/j.apmr.2009.07.014
- Rorden, C., & Karnath, H.-O. (2010). A simple measure of neglect severity. Neuropsychologia, 48(9), 2758–2763. https://doi.org/10.1016/j.neuropsychologia.2010.04.018
- Rosenthal, R. (1994). Parametric measures of effect size. In H. Cooper & L. V. Hedges (Eds.), The handbook of research synthesis (pp. 231–244). Russel Sage Foundation.
- Russell, C., Malhotra, P., & Husain, M. (2004). Attention modulates the visual field in healthy observers and parietal patients. NeuroReport, 15(14), 2189–2193. https://doi.org/10.1097/00001756-200410050-00009
- Saevarsson, S., Jóelsdóttir, S., Hjaltason, H., & Kristjánsson, Á. (2008). Repetition of distractor sets improves visual search performance in hemispatial neglect. Neuropsychologia, 46(4), 1161–1169. https://doi.org/10.1016/j.neuropsychologia.2007.10.020
- Saj, A., Pierce, J., Caroli, A., Ronchi, R., Thomasson, M., & Vuilleumier, P. (2020). Rightward exogenous attentional shifts impair perceptual memory of spatial locations in patients with left unilateral spatial neglect. Cortex, 122(2020), 187–197. https://doi.org/10.1016/j.cortex.2019.10.002
- Sarri, M., Greenwood, R., Kalra, L., & Driver, J. (2009). Task-related modulation of visual neglect in cancellation tasks. Neuropsychologia, 47(1), 91–103. https://doi.org/10.1016/j.neuropsychologia.2008.08.020
- Shinoda, H., Hayhoe, M. M., & Shrivastava, A. (2001). What controls attention in natural environments? Vision Research, 41(25–26), 3535–3545. https://doi.org/10.1016/S0042-6989(01)00199-7
- Simpson, S. A., Abegg, M., & Barton, J. J. S. (2011). Rapid adaptation of visual search in simulated hemianopia. Cerebral Cortex, 21(7), 1593–1601. https://doi.org/10.1093/cercor/bhq221
- Small, M., Cowey, A., & Ellis, S. (1994). How lateralised is visuospatial neglect? Neuropsychologia, 32(4), 449–464. https://doi.org/10.1016/0028-3932(94)90090-6
- Spreij, L. A., Ten Brink, A. F., Visser-Meily, J. M. A., & Nijboer, T. C. W. (2020). Increasing cognitive demand in assessments of visuo-spatial neglect: Testing the concepts of static and dynamic tests. Journal of Clinical and Experimental Neuropsychology, 42(7), 675–689. https://doi.org/10.1080/13803395.2020.1798881
- Sprenger, A., Kömpf, D., & Heide, W. (2002). Visual search in patients with left visual hemineglect. Progress in Brain Research, 140, 395–416. https://doi.org/10.1016/S0079-6123(02)40065-9
- Ten Brink, A. F., Biesbroek, J. M., Kuijf, H. J., Van der Stigchel, S., Oort, Q., Visser-Meily, J. M. A., & Nijboer, T. C. W. (2016). The right hemisphere is dominant in organization of visual search—A study in stroke patients. Behavioural Brain Research, 304(2016), 71–79. https://doi.org/10.1016/j.bbr.2016.02.004
- Ten Brink, A. F., Nijboer, T. C. W., Van Beekum, L., Van Dijk, J., Peeters, R., Post, M. W. M., & Visser-Meily, J. M. A. (2013). De Nederlandse Catherine Bergego schaal: Een bruikbaar en valide instrument in de CVA zorg. Wetenschappelijk Tijdschrift Voor Ergotherapie, 6(3), 27–36.
- Ten Brink, A. F., Van der Stigchel, S., Visser-Meily, J. M. A., & Nijboer, T. C. W. (2016). You never know where you are going until you know where you have been: Disorganized search after stroke. Journal of Neuropsychology, 10(2), 256–275. https://doi.org/10.1111/jnp.12068
- Ten Brink, A. F., Verwer, J. H., Biesbroek, J. M., Visser-Meily, J. M. A., & Nijboer, T. C. W. (2017). Differences between left- and right-sided neglect revisited: A large cohort study across multiple domains. Journal of Clinical and Experimental Neuropsychology, 39(7), 707–723. https://doi.org/10.1080/13803395.2016.1262333
- Toba, M.-N., Cavanagh, P., & Bartolomeo, P. (2011). Attention biases the perceived midpoint of horizontal lines. Neuropsychologia, 49(2), 238–246. https://doi.org/10.1016/j.neuropsychologia.2010.11.022
- Van der Stigchel, S., & Nijboer, T. C. W. (2017). Temporal order judgements as a sensitive measure of the spatial bias in patients with visuospatial neglect. Journal of Neuropsychology, 12(3)1–15. https://doi.org/10.1111/jnp.12118
- Van der Stoep, N., Visser-Meily, J., Kappelle, L., de Kort, P., Huisman, K., Eijsackers, A., Kouwenhoven, M., Van der Stigchel, S., & Nijboer, T. (2013). Exploring near and far regions of space: Distance-specific visuospatial neglect after stroke. Journal of Clinical and Experimental Neuropsychology, 35(8), 799–811. https://doi.org/10.1080/13803395.2013.824555
- van Kessel, M. E., van Nes, I. J. W., Geurts, A. C. H., Brouwer, W. H., & Fasotti, L. (2013). Visuospatial asymmetry in dual-task performance after subacute stroke. Journal of Neuropsychology, 7(1), 72–90. https://doi.org/10.1111/j.1748-6653.2012.02036.x
- Walshe, R. C., & Nuthmann, A. (2014). Asymmetrical control of fixation durations in scene viewing. Vision Research, 100(2014), 38–46. https://doi.org/10.1016/j.visres.2014.03.012
- Wansard, M., Meulemans, T., Gillet, S., Segovia, F., Bastin, C., Toba, M. N., & Bartolomeo, P. (2014). Visual neglect: Is there a relationship between impaired spatial working memory and re-cancellation? Experimental Brain Research, 232(10), 3333–3343. https://doi.org/10.1007/s00221-014-4028-4
- Weintraub, S., & Mesulam, M. M. (1988). Visual hemispatial inattention: Stimulus parameters and exploratory strategies. Journal of Neurology, Neurosurgery, and Psychiatry, 51(12), 1481–1488. https://doi.org/10.1136/jnnp.51.12.1481
- Wolfe, J. M. (1994). Guided Search 2.0 A revised model of visual search. Psychonomic Bulletin & Review, 1(2), 202–238. https://doi.org/10.3758/BF03200774