
ABSTRACT
Introduction
We aimed to investigate whether associations between deficits in “mid-range” visual functions and deficits in higher-order visual cognitive functions in stroke patients are more in line with a hierarchical, two-pathway model of the visual brain, or with a patchwork model, which assumes a parallel organization with many processing routes and cross-talk.
Methods
A group of 182 ischemic stroke patients was assessed with a new diagnostic set-up for the investigation of a comprehensive range of visuosensory mid-range functions: color, shape, location, orientation, correlated motion, contrast and texture. With logistic regression analyses we investigated the predictive value of these mid-range functions for deficits in visuoconstruction (Copy of the Rey-Complex Figure Test), visual emotion recognition (Ekman 60 Faces Test of the FEEST) and visual memory (computerized Doors-test).
Results
Results showed that performance on most mid-range visual tasks could not predict performance on higher-order visual cognitive tasks. Correlations were low to weak. Impaired visuoconstruction and visual memory were only modestly predicted by a worse location perception. Impaired emotion perception was modestly predicted by a worse orientation perception. In addition, double dissociations were found: there were patients with selective deficits in mid-range visual functions without higher-order visual deficits and vice versa.
Conclusions
Our findings are not in line with the hierarchical, two-pathway model. Instead, the findings are more in line with alternative “patchwork” models, arguing for a parallel organization with many processing routes and cross-talk. However, future studies are needed to test these alternative models.
Introduction
Deficits in visual functions are frequently occurring symptoms after stroke (Beaudoin et al., Citation2013; Nys, Van Zandvoort, De Kort, Van Der Worp et al., Citation2005). These symptoms have been associated with cognitive impairments (Nys, Van Zandvoort, De Kort, Jansen et al., Citation2005; Sand et al., Citation2013) and a poor functional and rehabilitation outcome (Nys, Van Zandvoort, De Kort, Van Der Worp et al., Citation2005). Visual deficits can range from visual-field deficits, such as a hemianopia, to higher-order visual disorders, such as recognition disorders or disorders in visuoconstruction (Jones et al., Citation2006; Rowe et al., Citation2009).
In a recent study, we reported on a new experimental set-up to diagnose the deficits in the intermediate stage of visual processing in a large group of stroke patients with lesions in (sub)corical areas distributed over the entire supratentorial region (Lammers et al., Citation2022). These visual sensory functions – which we called mid-range visual functions – involve the cortical processing of specific aspects of visual information, including the processes responsible for the perception of color, shape, location, orientation, contrast, texture and motion. The mid-range visual functions belong to the intermediate stage in which basic cues (such as color or orientation) are processed into structured representations, which can subsequently feed into higher order visual cognitive processes (Torfs et al., Citation2013; Vancleef et al., Citation2015). Our new experimental set-up involved a gaze-contingent presentation of the stimuli and is described in detail in the paper by Lammers et al. (Citation2022). The aim of that study was to establish the prevalence of deficits in the mid-range visual functions and to evaluate their co-occurrence. Results showed a relatively high incidence of half-field impairments with motion-perception being most prevalent (26%), followed by color (22%), texture (22%), location (21%), orientation (18%), contrast (14%), shape (14%) and glossiness (13%). Sixty-three percent of the stroke patients showed one or more mid-range visual deficits. With regard to the co-occurrence between the different mid-range visual functions, the results showed that the overlap between deficits was small and that they either occurred in isolation or co-occurred with only one or two other deficits.
At present, it is unclear what the consequences of different levels of proficiency on these mid-range visual sensory functions are for higher-order visual cognitive functions. Higher-order visual cognitive functions refer to cognitive processes involved in advanced processing of visual information. The different aspects of higher-order visual cognitive functions, including visual (emotion) recognition, visuoconstruction and visual (working) memory, have been found to be interrelated (Mervis et al., Citation1999; Nys, Van Zandvoort, De Kort, Jansen et al., Citation2005; Weider et al., Citation2016). However, how these so-called mid-range and higher-order visual cognitive functions are organized and interrelated remains unclear. There are essentially two opposing views.
The first view assumes a linear, hierarchical organization with a limited number of pathways that run from the primary visual cortex to different anterior areas. The information within a pathway “travels” in a serial fashion from one stage to the next. One of the pioneers of the hierarchical view was Bay (Citation1953) who postulated that basic visuosensory functions, such as shape or color perception, can have “knock-on” effects on higher-order visual cognitive functions by a process called “Funktionswandel.” Funktionswandel involves the transformations of basic sensations at a first, physiological stage into a meaningful percept at a second, psychological stage. He stressed the possibility that minor sensory deficits, that might go unnoticed on standard vision examination, may have unexpected severe repercussions at higher cognitive levels. As an example, T. C. Nijboer et al. (Citation2008) showed that subtle sensory impairments may have disturbing effects. They showed that hemi-metamorphopsia for faces in their stroke patients could likely be attributed to specific impairments in shape perception. In addition, various studies in patients with schizophrenia have investigated the role of basic visuosensory processes in the perception of facial emotional expressions (Jahshan et al., Citation2017). For instance, it was shown that deficits in emotion perception were preceded by deficits in contrast perception (Butler et al., Citation2009; Norton et al., Citation2009). Furthermore, in patients with Parkinson’s Disease (PD), it was found that an impaired emotion recognition could be related to a decreased contrast sensitivity (Hipp et al., Citation2014) and to an impaired visual-form processing (Marneweck & Hammond, Citation2014). In addition, some studies have shown indications that visuosensory functions can be related to visuoconstructive abilities (Cohen et al., Citation2010; Ma-Wyatt & McKee, Citation2006; Murray et al., Citation1990).
A typical example of limited processing streams is the “two-pathway model” (Goodale & Milner, Citation1992). According to the two-pathway model of Goodale and Milner (Citation1992), there is a ventral pathway and a dorsal pathway, both starting in the primary visual cortex. The ventral pathway runs toward the mesial temporal lobe and is used for the recognition of, for example, faces or text. The dorsal pathway runs toward the frontal lobe and is related to the spatial aspects of the outside world and is used for action planning. As this model assumes that the complexity of visual information within each pathway increases systematically, this model would predict that “perception cues” (such as color, shape or texture) would provide input to “ventral” higher-order visual cognitive functions, such as visual emotion recognition and visual memory. In contrast, “action cues” (such as orientation, location and motion) are used in “dorsal” higher-order visual cognitive functions, such as visuoconstruction.
The second view argues for a parallel organization with many processing routes and cross-talk between these routes (Gomez et al., Citation2015; Kravitz et al., Citation2011). Ettlinger (Citation1956) and De Haan et al. (Citation1995) have shown that deficits in mid-range visual functions, such as shape, location, color and motion, could not sufficiently explain the presence of visual recognition disorders (in either faces or objects) in agnostic patients. Based on these findings, De Haan and Cowey (Citation2011) proposed an alternative model. This “patchwork model” of the visual brain postulates the existence of overlapping networks (with many interconnections) involving different nodes for the different sensory features. These networks are not restricted to two clusters (i.e., a “ventral” and a “dorsal” cluster), and the outputs of these networks feed into different cognitive systems for, amongst others, perception, memory, emotion, and different types of action, such as eye and limb movements.
In sum, with regard to the consequences of mid-range visual deficits, there is a paucity of data. Based on the little information that is available, there are conflicting suggestions regarding the functional architecture. Linear, hierarchical pathway models, such as of Goodale and Milner (Citation1992), suggest a stronger interdependence between certain mid-range visual functions (e.g., shape, color and texture) and certain higher-order cognitive functions (e.g., visual memory). In contrast, models that posit overlapping networks with a high level of feedback and cross-link (e.g., De Haan & Cowey, Citation2011) assume that the higher-order functions would be less dependent on specific mid-range visual functions.
At present, no studies have investigated the full range of mid-range visual functions in relation to various higher-order visual cognitive functions in stroke patients. Therefore, the aim of the current study is to investigate how deficits in a broad range of mid-range visual functions (i.e., color, shape, location, orientation, contrast, texture and motion) are associated with performance on neuropsychological tasks assessing higher-order cognitive functions, requiring an advanced processing of visual information (i.e., facial emotion recognition, visual recognition memory and visuoconstructive functioning), and whether these associations are in line with the two-pathway model or with an alternative patchwork model.
Materials and methods
Study design
This study is part of the multi-center cohort study “A functional Architecture of the Brain for Vision” (FAB4V) with the aim of assessing visual deficits in patients with ischemic stroke. Patients were admitted to one of the following hospitals in the Netherlands: University Medical Center Groningen (UMCG), Amsterdam University Medical Center (AmsterdamUMC), Radboud University Medical Center (Radboudumc), University Medical Center Utrecht (UMCU), Onze Lieve Vrouwe Gasthuis (OLVG), Maasziekenhuis Pantein, Rijnstate, Ommelander Ziekenhuis Groep and St. Antonius Ziekenhuis and Diaconessenhuis. The assessment took place at either the UMCG, AmsterdamUMC, RadboudUMC or the UMCU between September 2015 and December 2019. The study was approved by The Medical Ethics Review Committee Utrecht (METC-nr 2015.372) and a written informed consent was obtained from all participants prior to their participation.
In the current study, we used a subset of 182 patients of the original patient-group of 220 patients and the same HC-group as used in our previous study (Lammers et al., Citation2022). The study by Lammers et al. (Citation2022) described the experimental set-up and investigated the prevalence of deficits in mid-range visual functions and the co-occurrence between the different mid-range visual functions. The current study investigated the relationship between the performance on the mid-range visual tasks and three higher-order visual cognitive functions. The total number of patients in the current study is smaller, because not all patients of the original patient-group were able to perform the tasks assessing higher-order visual cognitive functions. This was due to time shortage or fatigue. In those cases, we registered this as missing data for that particular missing task.
A patient was assessed at a particular center based on where the hospital admission had taken place. The main test protocol was identical for each participating center. However, there was a slight difference in test-priority between the academic centers, and because not all patients were able to perform all tasks due to time shortage or fatigue, there is a minor variation in included higher-order tasks between the testing sites. The total number of patients that have performed a particular task is noted for each task ().
Table 1. Clinical characteristics of subgroup of patients who performed the FEEST, Doors and Rey-Copy.
Table 2. Spearman’s correlations between mid-range visual functions and higher order visual cognitive functions (FEEST, Rey Copy and Doors).
Participants
A group of 182 patients with a diagnosis of ischemic stroke was included in this study. Inclusion criteria were: (1) the presence of a symptomatic cerebral (cortical or subcortical) ischemic stroke diagnosed by a neurologist and confirmed by computed tomography (CT) or magnetic resonance imaging (MRI), (2) age between 18–90 years old and (3) Dutch-speaking. Exclusion criteria included: (1) diagnosis of another neurological disease than an ischemic stroke, (2) diagnosis of a non-neurological disease affecting cognitive functioning, (3) history of substance abuse, (4) history of cognitive decline or impairment in daily life prior to the stroke and (5) presence of severe disturbances in consciousness or comprehension to the extent that task instructions could not be understood. The assessment took place between two weeks and six months post-stroke, in the subacute and early chronic phase (Wu et al., Citation2015).
A group of 49 healthy controls (HC’s) was included to determine whether performance on the mid-range visual task was impaired. This is the same HC group as described by Lammers et al. (Citation2022). HC’s were volunteers, recruited via the Senior Lab of the University of Amsterdam (www.seniorlab.nl) or recruited by word or by mouth. In addition, a control group of 85 age-matched HC’s, recruited by word or by mouth, was included to determine the cutoff of the Doors task. Exclusion criteria for all controls included serious neurological or psychiatric disorders, substance abuse or insufficient command of the Dutch language. All HC’s signed a written informed consent prior to participation and were treated in accordance to the Declaration of Helsinki.
Neuropsychological measures
Visual assessment
The diagnostic assessment of the mid-range visual deficits is described in detail in the study by Lammers et al. (Lammers et al., Citation2022). In short, seven tasks were constructed for the assessment of the perception of color (isoluminant stimuli in the red-green range), shape (Efron shapes), location (dot in a circle), orientation (lines at different angles), contrast (bars with converging gray-level differences), texture (from Brodatz grayscale texture album) and correlated motion (different percentages of dots moving in the same direction). Examples of the stimuli are presented in .
Figure 1. Examples of stimulus-pictures used to assess the perception of (A) color, (B) shape, (C) location, (D) orientation, (E) contrast, (F) texture and (G) correlated motion. In the bottom right, a schematic overview of the task assessing shape perception is presented.
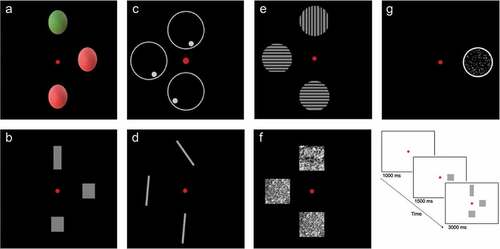
All tasks, except for correlated motion, had the same format. A red fixation dot was presented at the center of the screen. After one second, a target stimulus was presented on the horizontal midline at either 5° to the left or at 5° to the right side of the fixation. Then, after 1.5 seconds, two response items appeared in addition to the target stimulus for three seconds. One response item was presented 5° above the fixation dot and one was presented 5° below the fixation dot. One of the two response items differed from the target item on the midline on one critical dimension. The other response item was similar to the target item (see bottom right). Participants had to indicate which of the two response items was similar to the target stimulus on the midline within four seconds after the presentation of the response items (three seconds with the presentation of the items and an additional second with a black screen). Participants could respond by the use of a joystick. In case of motoric problems, answers could be given verbally. Therefore, both patients with aphasic problems and motoric problems were able to perform the tasks.
The task assessing motion perception only involved a target stimulus, presented at 5° to the left or at 5° to the right side of the fixation. This target stimulus was a circle with moving dots in it. The percentage coherence of the moving dots was adaptively changed across trials and participants had to indicate whether the dots were moving downwards or upwards. This task has been shown to be a sensitive test for shape, location and motion perception (e.g., Van Den Berg et al., Citation2019). To control for eye fixations and eye movements, we used an eye-tracker (Eyelink 1000; SR Research Ltd, Canada). The target item was presented in a gaze contingent fashion. This way, the target item always remained in the correct retinal position (of the horizontal axis), independent of eye movements, which made separate hemifield-testing possible.
All tasks started with twelve practice trials (six per hemifield) and 24 test trials (twelve per hemifield), except for texture perception (32 trials, 16 per hemifield) and motion perception (48 trials, 24 per hemifield). The raw score for all tasks, except for motion perception, was the number of correct responses per hemifield. The raw score for motion perception was the lowest percentage coherence of the moving dots at which the direction of the dots could be perceived accurately. Per task, the lowest score of two hemifields was used for the analyses. By selecting the lowest scores, we were able to detect a possible impairment. As a lesion is mostly one sided, it is likely that in some patients a high score in one hemifield would have leveled out a (minor) impairment in the other hemifield. Therefore, taking a mean score would not be accurate. As described in the paper by Lammers et al. (Citation2022), visual deficits occurred in all laterality-subgroups (lesion in right or left hemisphere or in both hemispheres); there were no significant differences between the lesion-laterality subgroups on most visual features, except for texture perception.
Raw scores were compared with the HC-group. A percentile score of 5 or lower was treated as deviant. The cutoffs for each task are described in the supplementary materials in the paper of Lammers et al. (Citation2022).
Facial emotion recognition
The Ekman 60 Faces Test of the Facial Expressions of Emotions – Stimuli and Test (FEEST; Voncken et al., Citation2018; Young et al., Citation2002) was used in the assessment of facial emotion recognition. Sixty faces expressing one of the six basic emotions (anger, disgust, fear, happiness, sadness and surprise) are shown in a randomized order, each ten times for three seconds. Subsequently, six labels are displayed on the screen and participants have to indicate which of the six emotional expressions is shown. The raw total score ranges from 0 to 60. Based on the Dutch normative data of the FEEST in which age, educational level and sex into were taken into account (Voncken et al., Citation2018), a percentile score could be determined for the total score. A percentile score of 5 or lower was treated as deviant.
Visuoconstructive functioning
The copy of the Rey–Osterrieth Complex Figure test (ROCF; Rey, Citation1941) was used to assess visuoconstructive functioning. The figure was placed in front of the participant and the participant was asked to copy the figure as accurately as possible. The task involves 18 elements, which are all evaluated for their accuracy and relative position. The maximum score was 36 (2 points per element). Based on the normative data of this test, percentile scores, taking age into account, could be determined. A percentile score of 5 or lower was treated as deviant.
Visual memory
To assess immediate visual memory, we used a computerized variant of the Doors Test (Schouten et al., Citation2009), which is a subtest of the Doors and People Test (Baddeley et al., Citation1994). This test contains a four-alternative forced-choice paradigm, in which participants have to select a target between three distractor doors. For this test, we selected fifteen target doors and ninety distractor doors from the doors database of the University of York (https://www.york.ac.uk/res/doors). This database contains 2000 different doors, categorized on a range of variables such as, shape, color, age, condition, function, door opening, surrounding, glazing type and richness of detail (Baddeley et al., Citation2016). Fifteen target doors consecutively appeared randomly at the center of a white computer screen. Each target door remained visible for 5 seconds. After the series of fifteen target doors, fifteen four-alternative forced-choice arrays followed. The patient had 13 seconds per array to select the target door from the distractors. They had to press 1, 2, 3 or 4 on the keyboard to select the target door. In case of motoric problems, responses could be given verbally. All target doors were matched with three distracter doors based on similarity in color, shape and surrounding. A cutoff score for the Doors task was obtained by using the age-matched control group (n = 85). A percentile score of 5 or lower was treated as deviant.
Statistical analysis
First, we performed Spearman’s rho correlations between all mid-range visual functions on the one hand and the continuous scores on the FEEST, Rey Copy and Doors on the other hand. As we were particularly interested in the predictive value of mid-range visual functions for impaired higher-order visual cognitive functions in patients, we performed logistic regression analyses (enter method). We dichotomized the scores on the FEEST, Rey and Doors as impaired versus non-impaired. As a considerable number of patients only made a few errors on a task, a continuous correlation would mainly be based on the correlations between the higher scores. By calculating an “impaired” and a “non-impaired” group, we were able to put more weight on the “impaired” group, which allowed us to study the relationship between mid-range visual disfunctions and impaired performance on higher order visual functions.
We assessed whether scores on the visual tasks (color, shape, location, orientation, contrast, texture and motion) could discriminate between impaired and non-impaired higher-order visual cognitive functions, i.e., facial emotion perception, visual recognition memory and visuo-constructive functioning. For all models, we used the lowest scores (right or left hemifield) of the seven visual tasks as independent variables, while controlling for age. With an additional logistic regression analysis, we investigated the predictive value of the number of deficits in mid-range visual functions on the higher-order visual cognitive functions. For all logistic analyses, the outcome variables were based on the normative data of the respective test. A percentile score of 5 of lower was categorized as impaired.
To investigate whether “perception cues” (color, shape and texture) are related to “ventral” higher-order visual cognitive functions (visual recognition memory or emotion recognition) and whether “action cues” (orientation, location and motion) provide input for “dorsal” higher-order visual cognitive functions (visuoconstruction), we created two compound scores: one “perception”- compound score (color, shape and texture) and one “action”-compound score (orientation, location and motion). To create these compound scores, the raw scores on the distinct visual tasks were converted into z-scores. Then, a mean z-score was calculated for both the perception-compound and the action-compound. The dichotomous (impaired/ non-impaired) outcome variable on the FEEST and Doors were used for “ventral” higher-order visual cognitive functioning, while the dichotomous (impaired/non -impaired) outcome variable on the Rey-copy was used for “dorsal” higher-order visual cognitive functioning.
Lastly, we also looked at individual patients for the presence of possible double dissociations. Previous studies have shown that these analyses can provide valuable information (De Haan et al., Citation1995). For this purpose, we first looked at the performance on the tasks assessing higher order visual cognitive functions in the patients with the most pronounced mid-range visual deficits. Then, we looked at the performance on the mid-range visual functions in the patients with the most pronounced higher-order visual cognitive deficits.
All behavioral analyses were performed in IBM SPSS statistics 26. The alpha level was set at .05.
Results
Participants
The total group of 182 patients (65.8% male) who performed the mid-range visual tasks had a mean age of 59.7 years (SD = 12.9) and a mean educational level of 5.3 (SD = 1.2). The group of 49 HC’s (59.2% male) who performed the mid-range visual tasks had a mean age of 59.7 years (SD = 13.3). No significant differences between all patients and these HCs were found with regard to age (t = 1.13, p = .263) and sex (χ2 = .77, p = .381). There were no significant differences in stroke severity between the different testing sites (H (3) = 5,95, p = .114).
As described earlier, not all patients performed all higher-order visual tasks, because of time shortage or fatigue. Therefore, in , the clinical characteristics are separated for the patient subgroups who performed the FEEST, Doors and Rey-copy. As can be seen, the subgroups were comparable.
Correlations
Location was significantly correlated with both the FEEST, Rey Copy and DOORS. In addition, orientation and texture were significantly correlated with the FEEST. Lastly, color was significantly correlated with the DOORS. However, all correlations were low to weak (See for all Spearman’s correlations).
Consequences of individual mid-range functions for higher-order visual functions
See for a frequency table of patients with a deficit on a mid-range visual task and higher-order visual task. The procedure of determining whether a score on a mid-range visual function was impaired is described in detail in Lammers et al. (Citation2022). In short, the performance of patients on each task was compared to an HC-group. The mean score minus 1.64 SDs of the HC-group on each visual task was used as the cutoff score for patients; a score of patients below this cutoff was treated as deviant.
Table 3. Frequencies of mid-range visual deficits.
The total number of deficits in mid-range visual tasks only significantly predicted impaired performance on the FEEST, but not performance on the Doors and Rey-copy (see ). In addition, shows the results of the logistic regression analyses (enter method) adjusted for age, with performance on all separate mid-range visual functions as predictors and the FEEST, Doors and Rey-copy as dependent variables. Impaired performance on the FEEST was significantly predicted by a worse score on the orientation-perception task. A worse location-perception score significantly predicted impaired performance on the Doors and Rey-copy.
Table 4. Logistic regression analyses, with the total number of deficits in the mid-range visual tasks as predictor and impaired/non-impaired performance on FEEST, Doors and Rey-copy as outcome variable, adjusted for age.
Table 5. Logistic regression analyses, with raw scores on the mid-range visual tasks as predictor and impaired/non-impaired scores on FEEST, Doors, and Rey-copy as outcome variable, adjusted for age.
Consequences of deficits in “perception cues” versus deficits in “action cues”
A compound-score for the “perception cues” (color, shape and texture) and a compound-score for the “action cues” (orientation, location and motion) was created. As can be seen in , the perception-compound could not significantly predict impaired performance on the FEEST and Doors (as “ventral” higher-order visual cognitive function) and the Rey-copy (as “dorsal” higher-order visual cognitive function). However, a worse action-compound significantly predicted impaired performance on both the FEEST and the Rey-copy. Performance on the Doors was not significantly predicted by the action-compound.
Table 6. Logistic regression analyses with both the perception-compound and the action-compound as separate predictors and impaired/non-impaired scores on FEEST, Doors, and Rey-copy as outcome variable, adjusted for age.
Double dissociations between mid-range and higher-order visual cognitive functions
According to hierarchical models of the brain, deficits in “lower-order” visual functions must lead to deficits in higher-order visual cognitive functions. Therefore, we also looked at individual patients for the presence of possible double dissociations. First, we looked at the patients with the most pronounced mid-range visual deficits. There was one patient with 6 out of 7 mid-range visual deficits. This patient also had an impaired performance on the Doors (raw score = 7, percentile score < 5) and the Rey-copy (raw score = 8, percentile score = 0). However, this patient’s performance on the FEEST was unimpaired (raw score = 48, percentile score = 58). More telling was the patient who suffered from 5 mid-range visual deficits but this patient’s performance on both the Rey-copy (raw score = 46, percentile score = 21) and FEEST (raw score = 33, percentile score > 16) was unimpaired. This patient did not perform the Doors task.
Then, we looked at the subgroup of patients with the lowest performance on the higher-order visual cognitive tasks. For the Rey-copy, we found that five patients with a percentile score of 0 on the Rey-copy had no mid-range visual deficits at all. Similarly, regarding the FEEST, one patient had a percentile score of 0 and another patient had a percentile score of 2. Both these patients did not show any mid-range visual deficits. Lastly, with regard to the Doors, we found four patients with a percentile score lower than 3 who did not show any mid-range visual deficit.
When looking at the five patients with the lowest perception-compound, only one patient had an impaired performance on the FEEST (raw score = 27, percentile score = 0). In contrast, the other four patients had unimpaired performance on the FEEST (raw scores = 42, 48, 46, 37, with the respective percentile scores = 21, 58, 21, 7). Within the group of 10 patients with the lowest performance on the FEEST (with a percentile score below 2), only one patient had an impaired perception-compound (percentile score < 5), while all other patients had an unimpaired perception-compound.
Of the five patients with the lowest action-compound, who also performed the Rey-copy, three patients had an impaired Rey-copy (percentile scores of 0). The other two patients had a percentile score higher than 16. Of the 10 patients with the lowest performance on the Rey-copy (a percentile score of 0), three patients had an impaired action-compound (percentile score < 5). The other patients had an unimpaired action-compound.
Discussion
The main aim of this study was to investigate the relationship between “mid-range” visual functions and “higher-order” visual cognitive functions in stroke patients. In addition, we aimed to investigate whether this relationship is better described in terms of a hierarchical, two-pathway model (Goodale & Milner, Citation1992) or an overlapping network model (De Haan & Cowey, Citation2011). Correlations between the mid-range visual functions and higher-order visual cognitive functions were low to weak. The logistic regression analyses showed that performance on the majority of mid-range visual tasks could not significantly predict performance on the tasks assessing higher-order visual cognitive functions. Amongst the full range of mid-range visual functions (i.e., color, shape, location, orientation, contrast, texture and motion), only the ability to perceive orientation significantly classified patients as having an impaired emotion recognition. An impaired visuoconstruction and visual memory was only significantly predicted by a worse perception of location. The odds-ratios were low in all these cases.
Apart from the group analyses, we also analyzed individual patients who showed or did not show mid-range visual impairments and/or higher-order visual cognitive impairments. Overall, the mid-range visual functions were associated with higher-order visual cognitive functions to a limited extent. In fact, we found several very clear double dissociations: there were patients who had selective deficits in mid-range visual functions without having any higher-order visual cognitive deficits, while there were at the same time patients with selective deficits in higher-order visual cognitive functions without having mid-range visual deficits. This indicates that deficits in mid-range visual functions and higher-order visual cognitive functions can occur relatively independently.
The findings of this independence are in line with earlier studies by Ettlinger (Citation1956) and De Haan et al. (Citation1995), who showed that the presence of visuosensory impairments in brain damaged patients with various etiologies were not sufficient to create higher-order visual disorders, such as agnosia. Also, it has been suggested that there is not always a clear distinction between so-called lower-order visual functions and higher-order visual cognitive functions. For instance, it has been found that even so-called lower-order or mid-range visual functions, such as color, require several levels of processing and may thus as well be conceptualized as a higher-order visual process (T. C. W. Nijboer et al., Citation2006; Heywood & Cowey, Citation1996; Van Zandvoort et al., Citation2007).
Our findings are not in line with the hierarchical nature of the two visual-pathway model because of various reasons. First, we found that the perception-compound score (i.e., color, shape and texture) predicted neither visual recognition abilities (emotion recognition and visual recognition memory), nor visuoconstructive functioning, while the action-compound (i.e., orientation, location and motion) predicted both emotion recognition and visuoconstructive functioning. Thus, we found no clear systematic two-pathway associations between visual recognition abilities and perception-cues, or a specific association between visuoconstruction abilities and action-cues. Second, the deficits in basic visual-sensory functions did not always create deficits in so-called higher-order visual cognitive functions. They often occurred independently. According to the two-pathway model, deficits in basic visuo-sensory functions must lead to deficits in higher-order, complex visual cognitive functions (Goodale & Milner, Citation1992).
Our results are more in keeping with the view of a parallel organization of visual functions, such as the “patchwork” model (De Haan & Cowey, Citation2011). In the “patchwork” model, separated nodes are described for all visual functions. According to this model, there are many overlapping networks consisting of constellations of retinotopic maps feeding into a number of different effector systems, such as perception, memory, action and affect (De Haan & Cowey, Citation2011; Kravitz et al., Citation2011). There are many interconnections between the different networks (Ponce et al., Citation2011), such as the interactions between position and shape networks (Janssen et al., Citation2008) and the shape and color networks (Seymour et al., Citation2010). Indeed, our data did show some associations between visual functions. For instance, the perception of emotions was mainly related to orientation perception. This could reflect the required orientation reaction to emotion perception (Nagy et al., Citation2005), which may be part of the extensive interconnections between (nonhierarchical) visual networks. Also, our finding that location perception was related to both visuoconstruction and visual memory suggests a possible overlap of different networks, instead of two hierarchical pathways. However, it should be noted that future studies are needed to test this alternative “patchwork” model.
This study is subject to some limitations. Although all patients had passed the acute stage of recovery (two weeks), the range of time since stroke is large (between subacute and early chronic phase), which could have had minor effects on the results. However, if small differences in functioning due to the time since stroke would be present, then these would be expected to be present in both the mid-range visual functions and higher order visual cognitive functions. As the assessment of the mid-range visual functions and the assessment of the “higher-order” visual cognitive functions took place at the same time since stroke, differences in time since stroke would only have limited effect on our outcome.
A practical issue of the study concerns the use of a limited amount of higher-order visual cognitive tasks. Although we have used a very broad spectrum of mid-range visual tasks, we only included three higher-order visual cognitive tasks in our study. Our main goal was to evaluate the presence of a hierarchical pattern of lower-order visual functions and higher-order visual cognitive functions in the two pathways of the “two-pathway” model. To this end, we used three tasks that are used in clinical practice and that could represent higher-order functions requiring an advanced visual processing which would, according to the two-pathway model, be typical for the dorsal pathway (visuoconstruction) and the ventral pathway (emotion recognition and visual memory). Examining additional higher-order visual abilities, such as object recognition or visual guided reaching, could shed more light on the interconnections between the different visual cognitive processes.
Furthermore, although our results are not in line with the hierarchical nature of the two visual-pathway model, due to the above-mentioned limitations we cannot rule out at least some claims of the two visual-pathway model. Therefore, more studies are needed to test an alternative model of the visual brain. Although we found that mid-range and complex higher-order visual deficits are not organized in a hierarchical manner and not within two pathways, we have not yet reached a clear understanding on how these functions are organized. For example, with structural DTI and fMRI analysis, different networks of the visual system could be mapped and clarify the interconnections. From a clinical point of view, our findings indicate that although mid-range visual functions occur frequently, they have limited effect on the more complex visual cognitive processes. The question may rise what the ramifications of mid-range visual deficits are for functional outcome and daily living in the chronic phase post-stroke. For example, when a patient shows impaired shape and orientation processing without impairments in higher-order visual cognitive functioning, could these shape and orientation deficits still be predictors for daily-life functioning?
To conclude, this is the first study that investigated a comprehensive range of mid-range visual functions within the same paradigm in relation to different higher-order visual cognitive functions. The associations between mid-range visual functions and higher-order visual cognitive functions did not occur systematically. Moreover, the mid-range visual deficits did not show direct knock-on effects on higher-order visual cognitive functions. We conclude that the patterns between visual subprocesses suggest the existence of multiple networks instead of two pathways. Therefore, our findings are not supportive of the hierarchical two-pathway model but more in line with an alternative patchwork model. Future studies are needed to test this alternative model.
Acknowledgments
The visual brain group: Anouk R. Smits ([email protected]); Ben A. Schmand ([email protected]); Edward H.F. de Haan ([email protected]); Frank Erik de Leeuw ([email protected]); Gert Jan Luijckx ([email protected]); H. Steven Scholte ([email protected]); Jacoba M. Spikman ([email protected]); L. Jaap Kappelle ([email protected]); Linda Geerligs ([email protected]); Martine J.E. van Zandvoort ([email protected]); Matthan W.A. Caan ([email protected]); Matthijs A.H.L.L. Raemaekers ([email protected]); Mathias Prokop [email protected]); Nick F. Ramsey ([email protected]); Nikki A. Lammers ([email protected]); Nils S. van den Berg ([email protected]) Noor Seijdel ([email protected]); Paul J. Nederkoorn ([email protected]); Rients B. Huitema ([email protected]); Bob Kentridge ([email protected]); Roy P.C. Kessels ([email protected]); Selma Lugtmeijer ([email protected]); Yair Pinto ([email protected]).
Disclosure statement
No potential conflict of interest was reported by the author(s).
Additional information
Funding
References
- Baddeley, A. D., Emslie, H., & Nimmo-Smith, I. (1994). The doors and people test: A test of visual and verbal recall and recognition. Thames Valley Test Company.
- Baddeley, A. D., Hitch, G. J., Quinlan, P. T., Bowes, L., & Stone, R. (2016). Doors for memory: A searchable database. Quarterly Journal of Experimental Psychology, 69(11), 2111–2118. https://doi.org/10.1080/17470218.2015.1087582
- Bay, E. (1953). Disturbances of visual perception and their examination. Brain, 76(4), 515–550. https://doi.org/10.1093/brain/76.4.515
- Beaudoin, A. J., Fournier, B., Julien-Caron, L., Moleski, L., Simard, J., Mercier, L., & Desrosiers, J. (2013). Visuoperceptual deficits and participation in older adults after stroke. Australian Occupational Therapy Journal, 60(4), 260–266. https://doi.org/10.1111/1440-1630.12046
- Butler, P. D., Abeles, I. Y., Weiskopf, N. G., Tambini, A., Jalbrzikowski, M., Legatt, M. E., Zemon, V., Loughead, J., Gur, R. C., & Javitt, D. C. (2009). Sensory contributions to impaired emotion processing in schizophrenia. Schizophrenia Bulletin, 35(6), 1095–1107. https://doi.org/10.1093/schbul/sbp109
- Cohen, M. L., Burtis, B., Kwon, J. C., Williamson, J., & Heilman, K. M. (2010). Action-intentional spatial bias in a patient with posterior cortical atrophy. Neurocase, 16(6), 529–534. https://doi.org/10.1080/13554794.2010.487827
- De Haan, E. H. F., & Cowey, A. (2011). On the usefulness of “what” and “where” pathways in vision. Trends in Cognitive Sciences, 15(10), 460–466. https://doi.org/10.1016/j.tics.2011.08.005
- De Haan, E. H. F., Heywood, C. A., Young, A. W., Edelstyn, N., & Newcombe, F. (1995). Ettlinger revisited: The relation between agnosia and sensory impairment. Journal of Neurology, Neurosurgery, and Psychiatry, 58(3), 350–356. https://doi.org/10.1136/jnnp.58.3.350
- Ettlinger, G. (1956). Sensory deficits in visual agnosia. Journal of Neurology, Neurosurgery, and Psychiatry, 19(4), 297–307. https://doi.org/10.1136/jnnp.19.4.297
- Gomez, J., Pestilli, F., Witthoft, N., Golarai, G., Liberman, A., Poltoratski, S., Yoon, J., & Grill-Spector, K. (2015). Functionally defined white matter reveals segregated pathways in human ventral temporal cortex associated with category-specific processing. Neuron, 85(1), 216–227. https://doi.org/10.1016/j.neuron.2014.12.027
- Goodale, M. A., & Milner, A. D. (1992). Separate visual pathways for perception and action. Trends in Neurosciences, 15(1), 20–25. https://doi.org/10.1016/0166-2236(92)90344-8
- Heywood, C., & Cowey, A. (1996). Colour vision: Now you see it, now you don’t. Current Biology, 6(9), 1064–1066. https://doi.org/10.1016/S0960-9822(02)70665-9
- Hipp, G., Diederich, N. J., Pieria, V., & Vaillant, M. (2014). Primary vision and facial emotion recognition in early Parkinson’s disease. Journal of the Neurological Sciences, 338(1–2), 178–182. https://doi.org/10.1016/j.jns.2013.12.047
- Jahshan, C., Wolf, M., Karbi, Y., Shamir, E., & Rassovsky, Y. (2017). Probing the magnocellular and parvocellular visual pathways in facial emotion perception in schizophrenia. Psychiatry Research, 253, 38–42. https://doi.org/10.1016/J.PSYCHRES.2017.03.031
- Janssen, P., Srivastava, S., Ombelet, S., & Orban, G. A. (2008). Coding of shape and position in macaque lateral intraparietal area. Journal of Neuroscience, 28(26), 6679–6690. https://doi.org/10.1523/JNEUROSCI.0499-08.2008
- Jones, S. A., Shinton, R. A., & Jones, S. A. (2006). Improving outcome in stroke patients with visual problems. Age and Ageing, 35(6), 560–565. https://doi.org/10.1093/ageing/afl074
- Kravitz, D. J., Saleem, K. S., Baker, I. B., & Mishkin, M. (2011). A new neural framework for visuospatial processing. Nature Reviews Neuroscience, 12(4), 217–230. https://doi.org/10.1038/nrn3008.A
- Lammers, N. A., Van den Berg, N. S., Lugtmeijer, S., Smits, A. R., Pinto, Y., & De Haan, E. H. F. (2022). Mid-range visual deficits after stroke: Prevalence and co-occurrence. PLoS ONE, 17(4 April), e0262886. https://doi.org/10.1371/journal.pone.0262886
- Marneweck, M., & Hammond, G. (2014). Discriminating facial expressions of emotion and its link with perceiving visual form in Parkinson’s disease. Journal of the Neurological Sciences, 346(1–2), 149–155. https://doi.org/10.1016/j.jns.2014.08.014
- Ma-Wyatt, A., & McKee, S. P. (2006). Initial visual information determines endpoint precision for rapid pointing. Vision Research, 46(28), 4675–4683. https://doi.org/10.1016/j.visres.2006.08.009
- Mervis, C. B., Robinson, B. F., & Pani, J. R. (1999). Visuospatial construction. American Journal of Human Genetics, 65(5), 1222–1229. https://doi.org/10.1086/302633
- Murray, E. A., Cermak, S. A., & O’Brien, V. (1990). The relationship between form and space perception, constructional abilities, and clumsiness in children. The American Journal of Occupational Therapy. : Official Publication of the American Occupational Therapy Association, 44(7), 623–628. https://doi.org/10.5014/ajot.44.7.623
- Nagy, E., Loveland, K. A., & Molnar, P. (2005). Role of orientation perception of emotions. Perceptual and Motor Skills, 101(1), 217–222. https://doi.org/10.2466/pms.101.1.217-222
- Nijboer, T. C., Ruis, C., Van der Worp, H. B., & De Haan, E. H. (2008). The role of Funktionswandel in metamorphopsia. Journal of Neuropsychology, 2(1), 287–300. https://doi.org/10.1348/174866407X256563
- Nijboer, T. C. W., van Zandvoort, M. J. E., & De Haan, E. H. F. (2006). Covert colour processing in colour agnosia. Neuropsychologia, 44(8), 1437–1443. https://doi.org/10.1016/j.neuropsychologia.2005.12.004
- Norton, D., McBain, R., Holt, D. J., Ongur, D., & Chen, Y. (2009). Association of impaired facial affect recognition with basic facial and visual processing deficits in schizophrenia. Biological Psychiatry, 65(12), 1094–1098. https://doi.org/10.1016/j.biopsych.2009.01.026
- Nys, G. M. S., Van Zandvoort, M. J. E., De Kort, P. L. M., Jansen, B. P. W., Van Der Worp, H. B., Kappelle, L. J., & De Haan, E. H. F. (2005). Domain-specific cognitive recovery after first-ever stroke: A follow-up study of 111 cases. Journal of the International Neuropsychological Society, 11(7), 795–806. https://doi.org/10.1017/S1355617705050952
- Nys, G. M. S., Van Zandvoort, M. J. E., De Kort, P. L. M., Van Der Worp, H. B., Jansen, B. P. W., Algra, A., de Haan, E. H. F., & Kappelle, L. J. (2005). The prognostic value of domain-specific cognitive abilities in acute first-ever stroke. Neurology, 64(5), 821–827. https://doi.org/10.1212/01.WNL.0000152984.28420.5A
- Ponce, C. R., Hunter, J. N., Pack, C. C., Lomber, S. G., & Born, R. T. (2011). Contributions of indirect pathways to visual response properties in macaque middle temporal area MT. Journal of Neuroscience, 31(10), 3894–3903. https://doi.org/10.1523/JNEUROSCI.5362-10.2011
- Rey, A. (1941). L’examen psychologique dans le cas d’encephalopathie traumatique. Archives de Psycholy.
- Rowe, F. J., & VISGroup UK. (2009). Visual perceptual consequences of stroke. Strabismus, 17(1), 24–28. https://doi.org/10.1080/09273970802678537
- Sand, K. M., Midelfart, A., Thomassen, L., Melms, A., Wilhelm, H., & Hoff, J. M. (2013). Visual impairment in stroke patients - a review. Acta Neurologica Scandinavica, 127(S196), 52–56. https://doi.org/10.1111/ane.12050
- Schouten, E. A., Schiemanck, S. K., Brand, N., & Post, M. W. M. (2009). Long-term deficits in episodic memory after ischemic stroke: Evaluation and prediction of verbal and visual memory performance based on lesion characteristics. Journal of Stroke and Cerebrovascular Diseases, 18(2), 128–138. https://doi.org/10.1016/j.jstrokecerebrovasdis.2008.09.017
- Seymour, K., Clifford, C. W. G., Logothetis, N. K., & Bartels, A. (2010). Coding and binding of color and form in visual cortex. Cerebral Cortex, 20(8), 1946–1954. https://doi.org/10.1093/cercor/bhp265
- Torfs, K., Vancleef, K., Lafosse, C., Wagemans, J., & de-Wit, L. (2013). The Leuven Perceptual Organization Screening Test (L-POST), an online test to assess mid-level visual perception. Behavior Research Methods 2013 46:2, 46(2), 472–487. https://doi.org/10.3758/S13428-013-0382-6
- Vancleef, K., Acke, E., Torfs, K., Demeyere, N., Lafosse, C., Humphreys, G., De-Wit, L., & Wagemans, J. (2015). Reliability and validity of the L euven Perceptual Organization Screening Test (L - POST). Journal of Neuropsychology, 9(2), 271–298. https://doi.org/10.1111/jnp.12050
- Van Den Berg, N. S., Huitema, R. B., Spikman, J. M., Van Laar, P. J., & De Haan, E. H. F. (2019). A shrunken world–micropsia after a right occipito-parietal ischemic stroke. Neurocase, 25(5), 202–208. https://doi.org/10.1080/13554794.2019.1656751
- Van Zandvoort, M. J. E., Nijboer, T. C. W., & De Haan, E. (2007). Developmental colour agnosia. Cortex, 43(6), 750–757. https://doi.org/10.1016/S0010-9452(08)70503-3
- Voncken, L., Timmerman, M., Spikman, J., & Huitema, R. B. (2018). Beschrijving van de nieuwe, Nederlandse normering van de Ekman 60 Faces Test (EFT), onderdeel van de FEEST. Tijdschrift Voor Neuropsychologie, 13(2), 143–151.
- Weider, S., Indredavik, M. S., Lydersen, S., & Hestad, K. (2016). Central coherence, visuoconstruction and visual memory in patients with eating disorders as measured by different scoring methods of the rey complex figure test. European Eating Disorders Review, 24(2), 106–113. https://doi.org/10.1002/erv.2385
- Wu, P., Zeng, F., Li, Y. X., Yu, B. L., Qiu, L. H., Qin, W., Li, J., Zhou, Y.-M., & Liang, F. R. (2015). Changes of resting cerebral activities in subacute ischemic stroke patients. Neural Regeneration Research, 10(5), 760. https://doi.org/10.4103/1673-5374.156977
- Young, A. W., Perrett, D. I., Calder, A. J., Sprengelmeyer, R., & Ekman, P. (2002). Facial Expressions of Emotion: Stimuli and Tests (FEEST). Thames Valley Test Company.