Abstract
Background: Fourty years of morbidity registration in general practice is a milestone urging to present an overview of outcomes. This paper provides insight into the infrastructure and methods of the oldest practice-based research network in the Netherlands and offers an overview of morbidity in a general practice population. Changes in morbidity and some striking trends in morbidity are presented. Methods: The CMR (Continuous Morbidity Registration) collects morbidity data in four practices, in and around Nijmegen, the Netherlands. The recording is anchored in the Dutch healthcare system, which is primary care based, and where every citizen is listed with a personal GP. Trends over the period 1985–2006 are presented as a three year moving average. As an indicator for 20-year prevalence trends we used the annual percentage change (APC). We restricted ourselves to morbidity, which is presented to the family physician on a frequent basis (overall prevalence rates >1.0/1000/year). Results: The age distribution of the CMR population is comparable to the general Dutch population. Overall incidence figures vary between 1500/1000 ptyrs (men) and 2000/1000 ptyrs (women). They are quite stable over the years, whereas overall prevalence figures are rising gradually to 1500/2500 ptyrs (men) and 2000/3500 ptyrs (women). Increase in prevalence rates for chronic conditions is diffuse and gradual with a few striking exceptions.
Conclusion: For morbidity patterns, the CMR database serves as a mirror of general practice. Practice-based research networks are indispensable for the development and maintenance of general practice as an academic discipline.
Introduction
The Continuous Morbidity Registration (CMR) Nijmegen was initiated by professor Frans Huygen, the inaugural chair of the Nijmegen University Department of General Practice in 1968, and one of the founding fathers of Dutch general practice. In 1967, he started recording, in collaboration with his colleague Van Thiel, all episodes of morbidity their patients presented in their practices—including diagnoses made by specialists after referral. By 1971, the registration had expanded to four practices, covering 12 000 patients in the Nijmegen area. These four practices have continued the morbidity recording ever since, in a relatively stable practice population, that by 2008 covered 15 000 patients. This makes the CMR in all probability the longest-operating database in general practice in the world. Since 1967, the database has served for practice-based research and, in current-day terms, the CMR would be described as a successful example of a practice-based research network (PBRN).
This paper presents an overview of general practice morbidity as has been recorded in the CMR. An important characteristic of the CMR database is its relation to time. “Time” is a critical component of general practice. General practitioners (GP) establish a working relation with their patients over a longer period of time. Longitudinal surveillance of patients’ health status and continuity of care are core characteristics of general practice, which have been related to the effectiveness and cost-effectiveness of patient care Citation[1]. This makes it of paramount importance to study the process and outcome of care on the basis of empirical data that have been collected over the long term. Through their longitudinal character, general practice data provide an opportunity to extend the time window of research beyond the few years usually covered by research projects Citation[2].
Time has influenced the CMR data in two important respects. First, the health status of the population has changed, and with it the health problems encountered in general practice. A second feature is that the database enables the tracking of the medical life histories of patients over time, in a number of cases over more than 30 years. Longitudinal research of patients’ medical life histories has been studied on many occasions from the CMR database Citation[3–5]. A more extensive overview is presented elsewhere in this issue [13]. In order to be able to analyse individual medical life histories, it is important to understand secular trends in morbidity over time: “what went and came” in everyday general practice. The overview in this paper addresses the changes in morbidity in the general practice population between 1986 and 2006.
Methods
Practice setting, population, and privacy protection
The CMR collects morbidity data in four practices, in and around Nijmegen, the Netherlands. The recording is anchored in the Dutch healthcare system, which is primary care based, with general practice being the main provider of healthcare and the gatekeeper of access to specialist medical care. Every citizen is listed with a personal GP, usually over a longer period of time, and specialists report back to the patient's GP for their care after referral. As a consequence, patients’ general practice records are the focal point of all their relevant medical information.
The four practices are fully integrated in their local primary care structure, and provide healthcare for their patient populations without any pre-selections or restrictions. There are currently 11 GPs working in the practices, on average for more than 15 years. Six of them hold a part-time position at the staff of the Nijmegen Department of General Practice.
The practice population currently comprises 15 000 patients. All patients have been informed about the database and have given informed consent for the recording of their data. For each patient, the following socio-demographic information is available: age, gender, socio-economic status, family composition, and practice of listing. Morbidity data are stored on a unique patient identification number, allowing anonymous processing and analysis of data in relation to individual characteristics. The patient's practice of listing holds the key to relating recorded data to an individual—particularly important when pursuing additional patient-related information for research. This is conditional to renewed informed consent of the patient.
Procedure: Classification and registration of episodes
All episodes are coded according to the E-list in its Dutch translation Citation[6]. At the start of the network, in 1967, this was the only available classification system derived from ICD-6. This classification has remained the frame of reference since 1967, to preserve the integrity of the database. However, throughout the years, diagnostic definitions (from the International Classification of Health Problems in Primary Care Citation[7] and important general practice guidelines Citation[8] have been integrated into the system. Coding of episodes is done by the patient's own GP at the time of (first) presentation. This way, an episode is only recorded once, irrespective of follow-up consultations.
Recurrence of an episode after successful treatment and/or natural recovery is considered a new episode. For chronic diseases, coding of their continued presence is carried out annually following the year of initial diagnosis/coding, with a prevalence code. For this, the disease must still be relevant to the patient's health status. A number of classification rules have been developed, on the basis of the E-list. Some conditions—for example, malignancies, diabetes mellitus, or chronic obstructive pulmonary disease (COPD)—are considered a chronic health problem throughout the patient's life, while for other conditions—for example, arthritis of the hip—this depends on the individual course, and prevalence coding is at the discretion of the GP.
Practice assistants code episodes that are presented exclusively by telephone consultations (new episodes) and follow-up prescriptions (prevalent episodes).
In addition to morbidity, the GP records referrals to other primary care providers and medical specialists. In case a presented episode is unclear or uncertain in diagnostic terms, coding can be postponed until the natural course or diagnostic testing provides clarification. When follow-up leads to a revision of the diagnosis, the corrected code is inserted to replace the initial one. New diagnoses made by medical specialists are included in the database.
The morbidity data attached to individual patient numbers are transferred through an internet-based transfer programme to the central database at the Department of General Practice, Radboud University Nijmegen Medical Centre, and stored for analysis.
Socio-demographic characteristics
Age is calculated on the basis of date of birth, and grouped according to international standards Citation[9]. Gender is recorded as male or female.
Socio-economic status (SES) is allocated on the basis of the patient's occupation, using the nine-point scale from the Central Bureau of Statistics, the Netherlands Citation[10], and grouped in three categories: low, middle, and high. For a household with children, the highest allocated status determines the children's SES status up to and including their school years.
Family composition is obtained by using the practices’ unique codes for individual households, and the position of the members within each household can be identified by their unique labels. Practice of listing can be identified as part of the unique patient identification number.
Supervision and quality control of recorded information
All GPs and practice assistants are trained for their role in the coding and processing of data. Initial training includes the coding of vignette cases and an introduction to registration rules. The practices meet monthly to discuss classification problems and review adherence to classification rules. There are separate meetings for practice assistants to discuss their work. The data controller at the central database checks codes for consistency and gives feedback to the participating GPs. Additional quality control consists of comparing the patient's clinical characteristics with the diagnostic criteria of the diagnosis that has been coded. Where this has been done Citation[11], Citation[12], it found a consistency of 85% or more was found for the classified cases fulfilling the diagnostic criteria.
Standard presentation of morbidity data
In the standard presentation, the CMR presents morbidity data as incidence (all new episodes recorded) and prevalence (all new and already-recorded cases), per 1000 patients per year. In addition, the incidence and prevalence are specified for the socio-demographic characteristics gender, age, SES, and seasonal fluctuation of diagnosis (winter, spring, summer, autumn).
A number of comprehensive morbidity indicators are presented. Overall morbidity is the sum of all new and already-recorded cases. For severity of illness, all diagnostic codes of the E-list have been allocated a severity score by a panel of experienced GPs: severity score 1, potentially life threatening; severity score 2, temporary major impact on daily functioning; severity score 3, only modest impact on daily functioning; severity score 4, unclassifiable.
Age specificity and severity are not part of this paper.
Analysis
First, we provide basic characteristics of the CMR population (age and gender) in comparison to the Dutch population, and show trends in characteristics over the past 20 years. We calculated overall morbidity incidence and prevalence rates, and, more specifically, we looked at incidence and prevalence rates for chronic conditions. We defined chronicity quite pragmatically as the proportion of prevalence to incidence; a ratio more than 3 was considered a chronic condition.
Next, we present gender-specific incidence and prevalence figures for the period 2002–2006. We restrict ourselves to morbidity, which is presented to the family physician on a frequent basis (overall prevalence rates >1.0/1000/year). We did not standardize data for age, because this gives insight into the influence of ageing on morbidity presented to the GP. If incidence and prevalence rates were identical, only the prevalence rates are given in the tables.
Due to space restrictions, we made a selection of frequent morbidities, which results in a rough overview with interesting highlights. We excluded figures from pregnancy-related morbidity and from congenital and neonatal morbidity, and traumatology and “rest” categories were also excluded. In line with current practice, we combined codes to make one category for certain morbidity labels. For example, the diagnosis depression consists of three different codes: endogenous depression, reactive depression, and neurotic depression. Back pain includes acute and chronic back pain, with or without irradiation.
We provide an indicator for 20-year prevalence trends for the period 1986–2006. These trends are expressed as the annual percentage change (APC), which we calculated by relating the mean prevalence rates for the period 1985–1989 to the mean prevalence rates for 2002–2006. Decline in prevalence is represented negatively. APC can be calculated as follows: APC=(((prevalence in the period 2002–2006/prevalence in the period 1985–1990)×(1/17)) −1)×100. For example, an APC of 10 will double prevalence numbers within 8 years, and an APC of −10 will halve them within the same time period.
Inevitably, we were not able to express APCs for all types of morbidity. For example, skin cancers have only been specified as melanomas, basaliomas, and squamous cell carcinomas since the 1990s. In order to reflect morbidity trends in everyday practice, we chose not to correct the data for age and gender. Some striking trends in morbidity will be highlighted in Boxes 1–5.
Box 1. What came: hypothyroidism and hyperthyroidism
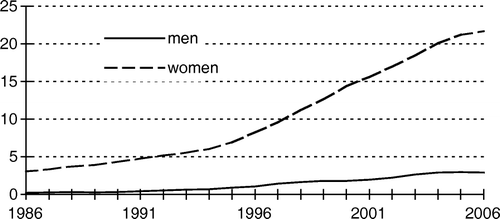
Hypothyroidism and hyperthyroidism are common thyroid disorders in family medicine. The incidence of hyperthyroidism has been stable throughout the years, occurring more often in women than in men (). Contrary, demonstrates a serious increase of hypothyroidism. Within a time frame of twenty years incidence rates have risen sevenfold, for men as well as for women. Are we facing a small epidemic? We are not sure. An alternative explanation may be that doctors are more keen on the diagnosis. It may also be a side-effect of an increase in biochemical testing, or related to an increasing tendency to treat and label subclinical hypothyroidism as overt hypothyroidism.
Figure 1. Hyperthyroidism (prevalence, trend line).
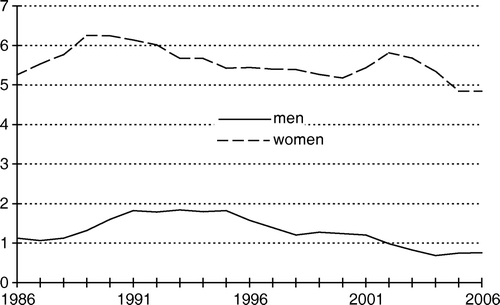
Figure 2. Hypothyroidism (prevalence, trend line).
Box 2. What came: Anxiety disorders and depression
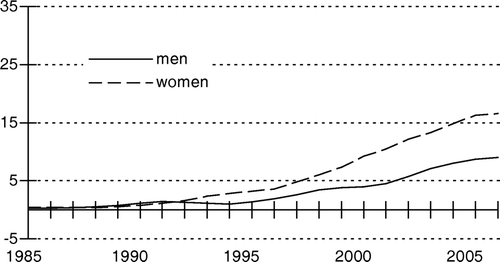
Many patients yearly present to the GP with anxiety disorders and depression. In the past 20 years their numbers have inclined gradually. The and show that prevalence rates for both conditions have risen dramatically. Many possible explanations are available for this rise. It may reflect real alterations in disease patterns. But also, patients may be more eager to present their sorrows and mood disturbances to a doctor. Or it may reflect a tendency to use psychiatric diagnostic labels, instead of lighter labels. For sure, these figures can provide relevant research topics in the mental illness research domain.
Figure 3. Depression (prevalence, trend line).
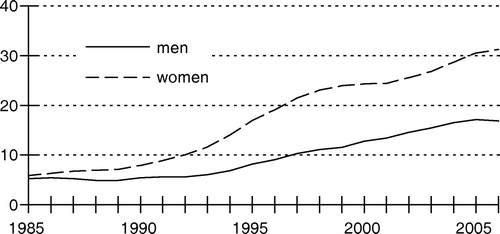
Figure 4. Anxiety disorders (prevalence, trend line).
Box 3. What went: pinworms
Pinworm is a common parasite in family practice. It mainly affects children at a young age. It circulates in families with small children. From 1975, the prevalence rate was stable. However, around the year 1995, the incidence rate drops impressively. Have pinworms been exterminated in the Netherlands just like measles and parotitis? We do not know this by sure. But we do know that antihelmintic agents, such as mebendazole, can be bought over the counter only since 1993 in the Netherlands, when a new law was introduced.
Figure 5. Pinworms (prevalence, trend line).
Box 4. What went: duodenal ulcer
Duodenal ulcers used to be common. However, nowadays a GP only sees approximately one ulcer every year. In the eighties of the past century it was discovered that Helicobacter pylori played an important role in the etiology of duodenal ulcer. Since the early nineties, eradication therapy has prevented many recidives. However, the drop in prevalence rates already started earlier, at the time of the introduction of H2 receptor blockers during the late eighties.
Figure 6. Duodenal ulcer (prevalence, trend line).
Box 5. What came: diabetes
In the past twenty years much attention has been paid to diabetes. Many publications have warned for a systematic underdiagnosis of the condition. Cut-off points for the diagnosis have been altered. In practice, we have observed a change from diabetes being a clinical condition which is diagnosed through symtoms such as fatigue, polyuria and thirsth, towards a merely biochemical abnormality of blood sugar levels. This may be the explanation for the impressive increase in diabetes levels.
Figure 7. Diabetes (prevalence, trend line).
We calculated seasonal influence on prevalence data, and show the average spread over the seasons for respiratory morbidity as presented from 2001 up to 2006. We used 3-month periods (January–March, April–June, July–September, October–December) as indicators for the seasons. Ninety-five per cent confidence intervals (CI) are provided. Also, we calculated the influence of socio-economic class on prevalence data using the same 5-year period, 2001–2006. Mean percentages, including 95% CI, are given for the musculoskeletal system as an example. For severity figures, we refer to our website (URL: www.cmr.nl).
Results
Trends in morbidity
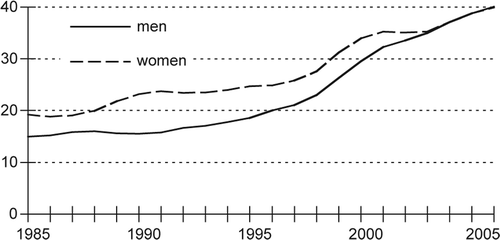
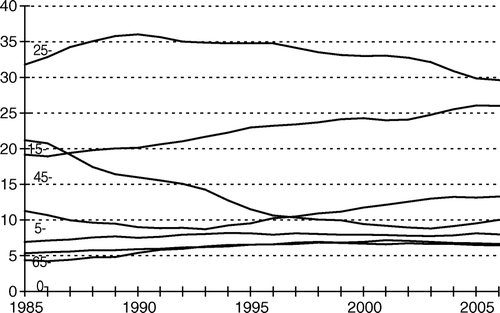
and show that age distributions of the CMR population are comparable to the general Dutch population (data from Statistics Netherlands Institute 2000). Age distributions in the CMR have changed significantly in the past 20 years, both for men and women. The population is ageing. The youngest age groups have declined, while the older age groups have increased. The “baby boomer” generation is gradually moving to the 45–64-year age groups ( and ).
Figure 1. CMR population and Dutch population for men (CBS; Statistics Netherlands 2000) (percentages) according to age group (years).
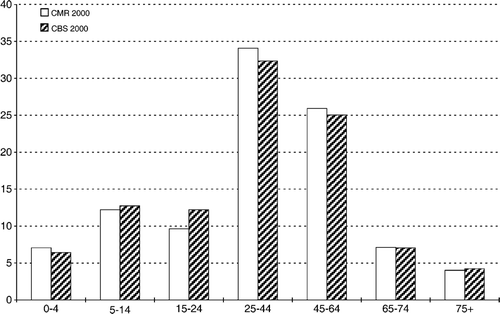
Figure 2. CMR population and Dutch population for women (CBS; Statistics Netherlands 2000) (percentages) according to age group (years).
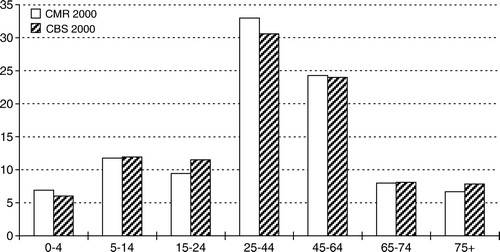
Figure 3. Trend in age distributions for men 1985–2005 (percentages).
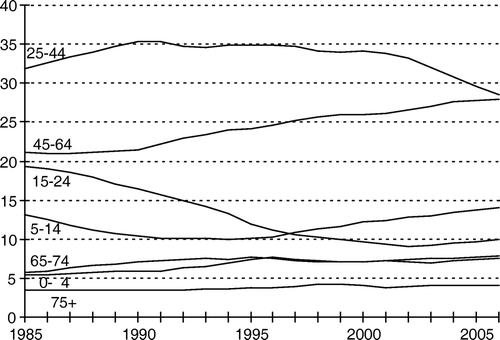
Figure 4. Trend in age distributions for women 1985–2005 (percentages).
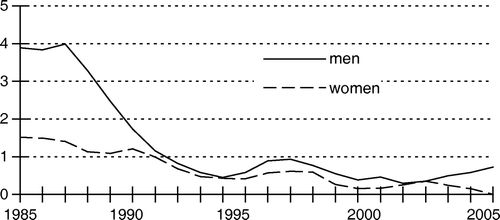
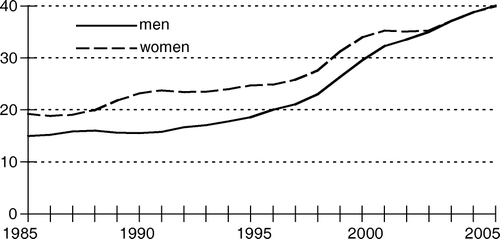
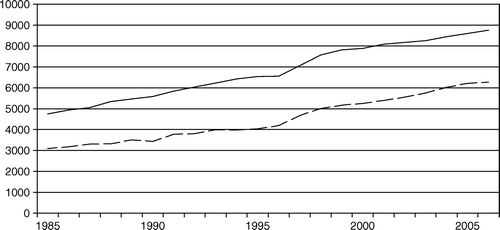
and show standardized overall incidence and prevalence trends for all types of morbidity. Incidence numbers vary between 1500/1000 ptyrs (men) and 2000/1000 ptyrs (women). These are quite stable over the years, whereas prevalence numbers are rising gradually to 2500/1000 ptyrs (men) and 3500/1000 ptyrs (women). More chronic morbidity is gradually being presented to general practitioners. shows this gradual increase for chronic conditions only.
Figure 5. Trend for overall morbidity: incidence rates.
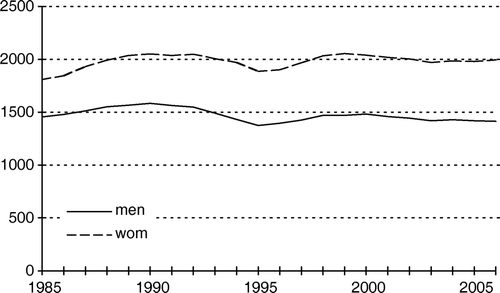
Figure 6. Trend for overall morbidity: prevalence rates.
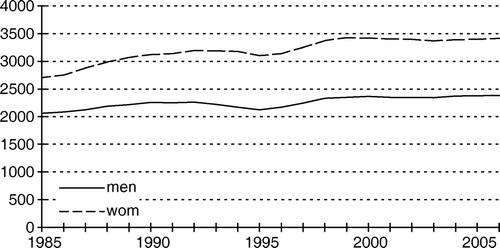
Figure 7. Trend for chronic morbidity: incidence rates.
From , it is evident that the increase in prevalence rates for chronic conditions is diffuse and gradual, with a few striking exceptions. The increases for conditions such as asthma, hypothyroidism, gastro-oesophageal reflux, depressive disorders, and anxiety disorders are remarkable. These conditions are presented much more frequently to the general practitioner than 20 years ago. In contrast, other conditions have almost disappeared. Conditions such as furunculosis, duodenal ulcer, pinworms, common cold, and hyperhidrosis are much less frequently seen by GPs nowadays than in 1985.
Table I. Incidence rates, prevalence rates, and annual percentage change (APC).
shows the seasonal variation for respiratory morbidity. It is clear that most, but not all infectious respiratory morbidity follows a seasonal pattern, with increased incidence rates in wintertime, and relatively low prevalence rates in the late summer and early autumn. Seasonal rhinitis is an exception, which would of course be expected. shows that socio-economic class influences considerably the prevalence rates of diseases of the musculoskeletal system. With the exception of osteoarthritis of the hip, osteoarthritis is otherwise overrepresented in the lower-SES group. Also, muscle, shoulder, and back pain are much more common in the lower-SES group. The observed differences are highly significant.
Table II. Seasonal trends for respiratory infections (period 2001–2006): percentage spread over the year.
Table III. Influence of socio-economic status (SES): prevalence rates for SES (patients/1000/year).
Discussion
This article has provided an overview of the infrastructure and methods of the oldest practice-based research network in the Netherlands, the Continuous Morbidity Registration Nijmegen. The network has now existed for 40 years. Its success is mainly contributable to the participating GPs’ strong academic bonds, to its relatively small size, and to its consistent emphasis on completeness of data and, by organizing monthly meetings, on the assurance of data validity. Moreover, we have shown morbidity data for common types of morbidity, and have given examples of what has come and gone in general practice in the Netherlands. In general, the overall incidence rates of morbidity are quite stable. The prevalence data show a clear increase in chronic conditions that seem more often to be brought to the attention of the GP. Extrapolation of these data suggests that, in the near future, we will be faced with increased involvement with multimorbidity and chronic conditions, leading to an increased workload for GPs. In this way, through careful and long-term registration, PBRNs can provide us with a comprehensive overview of trends in morbidity patterns in general practice. It contributes to the academic triad of education, research, and patient care. At present, however, the relevant threats to our network are the insecurity of permanent academic support and the limited resources available for innovation.
As regards morbidity patterns, the database serves as a mirror of general practice. The given examples show how morbidity patterns in general practice may be influenced. On the one hand, the patterns are a reflection of real changes in morbidity, which are true for example for the majority of infectious diseases. Moreover, they are a reflection of presented morbidity to the GP. In this way, the example of pinworms is striking. On the other hand, morbidity patterns show the impact of cultural and societal changes on concepts of illness and health, and thus on the interpretation of morbidity classification systems. Mental illness is a striking example of this factor.
Practice-based research networks are indispensable for the development and maintenance of general practice as an academic discipline. They can both induce and answer important research questions for the general practice domain. We need these networks to prove that general practice is a full-bodied evidence-based medical discipline. Therefore, they deserve our major support.
References
- Macinko J, Starfield B, Shi L. Quantifying the health benefits of primary care physician supply in the United States. Int J Health Serv 2007; 37(1)111–26
- Van Weel C. Longitudinal research and data collection in primary care. Ann Fam Med 2005; 3(suppl 1)46–51
- De Grauw WJ, van de Lisdonk EH, van den Hoogen HJ, van Weel C. Cardiovascular morbidity and mortality in type 2 diabetic patients: a 22-year historical cohort study in Dutch General practice. Diabet Med 1995; 12: 117–22
- Van den Bosch WJ, van den Hoogen HJ, Huygen FJ, van Weel C. Morbidity from childhood to adulthood. The medical life history of 103 patients. Fam Pract 1992; 9: 290–4
- Van Weel-Baumgarten E, van den Bosch W, van den Hoogen H, Zitman FG. Ten year follow-up of depression after diagnosis in general practice. Br J Gen Pract 1998; 48: 1643–6
- The College of General Practitioners. A classification of disease. J Coll Gen Pract 1959;2:140–59.
- Soler JK, Okkes I, Wood M, Lamberts H. The coming of age of ICPC: celebrating the 21st birthday of the International Classification of Primary Care. Fam Pract 2008; 25(4)312–7
- Grol R. National standard setting for quality of care in general practice: attitudes of general practitioners and response to a set of standards. Br J Gen Pract 1990; 40: 361–4
- Bentzen N, Bridges-Webb C. An international glossary for general/family practice. Fam Pract 1995; 12: 267
- http://www.cbs.nl/en-GB/default.htm.
- van Weel C. Validating long term morbidity recording. J Epidemiol Commun Health 1995; 9(suppl 1)29–32
- van Weel-Baumgarten EM, van den Bosch WJ, van den Hoogen HJ, Zitman FG. The validity of the diagnosis of depression in general practice: is using criteria for diagnosis as a routine the answer?. Br J Gen Pract 2000; 50: 284–7
- van Weel C. The Continuous Morbidity Registration Nijmegen: Background and history of a Dutch general practice database. Eur J Gen Pract 2008; 14(Suppl 1)5–12