
Abstract
Background
Recognising acute appendicitis in children presenting with acute abdominal pain in primary care is challenging. General practitioners (GPs) may benefit from a clinical prediction rule.
Objectives
To develop and validate a clinical prediction rule for acute appendicitis in children presenting with acute abdominal pain in primary care.
Methods
In a historical cohort study data was retrieved from GP electronic health records included in the Integrated Primary Care Information database. We assigned children aged 4–18 years presenting with acute abdominal pain (≤ 7 days) to development (2010–2012) and validation (2013–2016) cohorts, using acute appendicitis within six weeks as the outcome. Multiple logistic regression was used to develop a prediction model based on predictors with > 50% data availability derived from existing rules for secondary care. We performed internal and external temporal validation and derived a point score to stratify risk of appendicitis into three groups, i.e. low-risk, medium-risk and high-risk.
Results
The development and validation cohorts included 2,041 and 3,650 children, of whom 95 (4.6%) and 195 (5.3%) had acute appendicitis. The model included male sex, pain duration (<24, 24–48, > 48 h), nausea/vomiting, elevated temperature (≥ 37.3 °C), abnormal bowel sounds, right lower quadrant tenderness, and peritoneal irritation. Internal and temporal validation showed good discrimination (C-statistics: 0.93 and 0.90, respectively) and excellent calibration. In the three groups, the risks of acute appendicitis were 0.5%, 7.5%, and 41%,
Conclusion
Combined with further testing in the medium-risk group, the prediction rule could improve clinical decision making and outcomes.
KEY MESSAGES
For GPs, recognising appendicitis in children with acute abdominal pain is challenging and clinical prediction rules are unavailable.
We developed and validated a clinical prediction rule to stratify these children’s risk of acute appendicitis.
For the three risk groups, we suggest parental observation, further assessment and direct referral.
Introduction
Acute appendicitis in children has a population incidence of approximately 0.12% per year, with 20%–74% of cases developing potentially life-threatening complications [Citation1]. The general practitioner (GP) must not only recognise cases and refer them to secondary care promptly but also avoid unnecessary referrals for children with less harmful conditions, such as gastroenteritis or constipation. This balance is especially challenging for the GP because individual clinical features of appendicitis have low predictive value [Citation2–4].
Although guidelines exist to help with decisions about referral [Citation2, Citation3], these specify about 20–40 clinical features related to acute appendicitis and a myriad of other abdominal diseases to be considered. Moreover, we have reported that GPs record only a few clinical features after assessing children with acute abdominal pain and that these vary widely [Citation4]. GPs instead use heuristic decision-making [Citation5], relying on their clinical judgement rather than formal algorithms or complete investigations of all features. However, prediction rules can support clinical assessment by using optimally weighed predictive variables for risk stratification [Citation6]. Although several clinical prediction rules have been developed and validated for diagnosing appendicitis in children in secondary care, discrimination and calibration in primary care may differ. This is caused by selective referral of patients to secondary care with more severe disease and a higher probability of disease [Citation7–9]. In this study, we first develop and validate a clinical prediction rule for children with acute abdominal pain in primary care, using registration data [Citation10, Citation11]. Second, we classify risk groups based on preset diagnostic accuracy criteria and report the observed probabilities of acute appendicitis for each group.
Methods
Study design
We performed a historical cohort study of children presenting with acute abdominal pain to primary care in the Netherlands between November 2010 and November 2016 [Citation4]. The cohort was split into development and validation cohorts based on data obtained before and after November 2013, respectively. Reporting follows the TRIPOD statement [Citation12].
Data source
We used medical records from the longitudinal International Primary Care Information (IPCI) database managed by Erasmus Medical Centre, Rotterdam, which contains complete pseudonymised data for 1.5 million patients from approximately 600 Dutch GP practices [Citation13]. All Dutch residents must enlist with a GP, who must code (or record as free text) all clinical data in electronic patient records. Medical specialists must also report all patient contacts to GPs, irrespective of the referral source. The IPCI database contains data from six GP software platforms, and for this study, we used the three platforms with the most complete specialist reports, accounting for 32.9% of the total (368 practices). The database complies with European Union guidelines on using medical data for research.
Study population
GP consultation records for children aged 4–18 years with ‘abdominal pain’ noted in the free text and an International Classification of Primary Care (ICPC) code for the gastrointestinal tract (D.xx) were identified automatically. Index consultations were those for children who presented to their GP for the first time with acute abdominal pain (≤ 7 days) during the study period, excluding cases with a history of prior appendicitis or appendectomy.
Outcome
Presence of appendicitis was based on imaging, intraoperative findings and/or histopathology as reported by the secondary care specialist. Absence of appendicitis was either based on the GP’s medical records within six weeks from the index consultation or on the specialist reports, if available. Four medical students extracted outcome data from free text.
Candidate predictors
Thirteen candidate predictors were derived from existing prediction rules: male sex, right lower quadrant (RLQ) pain, RLQ pain migration, pain intensity, pain duration, increasing pain, nausea and/or vomiting, anorexia, RLQ tenderness, peritoneal irritation (rebound tenderness, guarding, abdominal wall rigidity, and/or pain at jarring movements), abnormal bowel sounds (absent, tinkling or high-pitched), elevated temperature (≥ 37.3 °C by recall or measure), and difficulty walking [Citation11]. All predictors were binary, except pain duration (< 24, 24–48 h, > 48 h). Using standardised criteria, the coders extracted the candidate predictors from the free text, as assessed during the index consultation [Citation4, Citation14]. Demographic data was retrieved automatically from the patients’ records. Candidate predictors were only included in the model when recorded in > 50% of consultations, whether positive or negative [Citation6].
Missing data
We considered items missing at random (MAR) if the observed values of other predictors or outcomes could predict missingness [Citation15]. For data presumed MAR or missing completely at random, we used multiple imputation to replace missing values. Based on all known predictors, demographic data, referral data, and outcomes, 20 datasets were constructed with the missing data imputed. Acute appendicitis and perforation of the appendix were included as predictive variables in the multiple imputation. We used predictive mean matching for imputation because the incomplete variables were not normally distributed. As a sensitivity analysis, we performed a complete case analysis in the development cohort [Citation15].
Statistical analysis
Model development and validation
In the development cohort, we fitted a logistic regression model with acute appendicitis as the dependent variable and all candidate predictors as independent variables. Backward selection was used to identify predictors meeting the Akaike information criterion (p < 0.157) in over 50% of the 20 imputed datasets. For internal validation, we performed bootstrapping with 250 iterations to obtain an overfitting-adjusted concordance index (C-statistic) and calculate a shrinkage factor for uniform application to the beta coefficients to obtain an adjusted slope. Final model calibration was achieved by adjusting the intercept [Citation16]. Model performance was assessed by using the C-statistic pooled across imputed data sets for the discrimination and calibration curves constructed separately for each imputed set.
External temporal validation of the final model involved using data from the validation cohort to calculate the C-statistic and calibration curves. The model was accepted without updating if the results were satisfactory.
Subgroup analysis by age
Because the differential diagnosis of acute abdominal pain differs between pre- and post-pubertal children [Citation11], we conducted two posthoc analyses in the development cohort. First, by adding age group to the other candidate predictors, we assessed whether age group (4–10 and 11–18 years) independently predicted acute appendicitis. Second, we assessed the interaction between the linear predictor of the final model and age group. To preserve any potential interaction with age, missing predictor variables were imputed separately for each age group [Citation17].
Score development
We constructed a clinical practice score based on the final model as the sum of points for all predictors. This involved assigning points to each predictor equal to its beta coefficient divided by the absolute lowest beta coefficient and rounded this to the nearest integer [Citation18]. We plotted the predicted probability of acute appendicitis for each point score.
Performance
Model performance was further assessed in the validation cohort by calculating sensitivity, specificity, positive predictive value, and negative predictive value with binomial proportion 95% confidence intervals (95%CIs) at all possible cut-off values. We report observed numbers of children with and without acute appendicitis at different cut-off values in the validation cohort. Parameter estimates were pooled using Rubin’s rules, which were also used to obtain 95%CIs [Citation19].
Additionally, we constructed a percentile curve showing the proportion of children below each point score in the validation cohort. Benchmarking was done by calculating the test characteristics and the probability of appendicitis based on the GP’s decision to refer during the index consultation in the validation cohort. Finally, we built an online calculator for estimating the theoretical probability of acute appendicitis [Citation18].
Risk groups
Aiming for arbitrarily defined sensitivity of 95% and specificity of 95%, we defined two cut-offs for the score. The lower cut-off corresponded with 95% model sensitivity and the upper cut-off with 95% model specificity. The two cut-offs were used to assign children to the low-risk, medium-risk or high risks groups. Referral rates by the GP within the risk groups were assessed. Analyses were performed in IBM SPSS version 26.0 (IBM Corp, Armonk, NY, USA) and R version 4.0.4.
Results
Participants
During the study period, 15,607 children presented to their GP and 5,691 met the inclusion criteria. Of these, we included 2,041 in the development cohort (referred: 84 of 96 with acute appendicitis and 196 without appendicitis) and 3,650 in the validation cohort (referred: 152 of 195 with acute appendicitis and 366 without appendicitis). shows the broadly comparable characteristics between the cohorts.
Table 1. Availability and values of predictors and outcomes in the development and validation cohorts.
Included candidate predictors
shows that seven candidate predictors met the criterium of > 50% available values. These were used for analysis: male sex, pain duration, nausea/vomiting, elevated temperature, abnormal bowel sounds, RLQ tenderness, and peritoneal irritation.
Missing data
The missing data analysis in Supplementary Table S1 shows that children with peritoneal irritation (odds ratio, 0.62; 95%CI, 0.45–0.84) and acute appendicitis (odds ratio, 0.57; 95%CI, 0.34–0.96) were less likely to have missing values of the other predictors. Thus, we assumed the data were at least partially MAR.
Development of the prediction model
All seven candidate predictors were independently associated with an increased risk of acute appendicitis and were included in the initial model (), which had an excellent discriminatory power (pooled C-statistic, 0.93; 95%CI, 0.92–0.95). The complete case sensitivity analysis produced a C-statistic of 0.96 (95%CI, 0.92–1.0; Supplementary Table S2) and the calibration curves showed good calibration for all 20 datasets and complete case analysis (Supplementary Figure S1).
Table 2. Adjusted model after internal validation, with point scores for the prediction rule.
Subgroup analysis by age
In the development cohort, backward selection led to age group (4–10 versus 11–18 years old) being deselected in all imputed datasets. No interaction effect existed between the linear predictor and age group (p for interaction: 0.15).
Internal and external validation
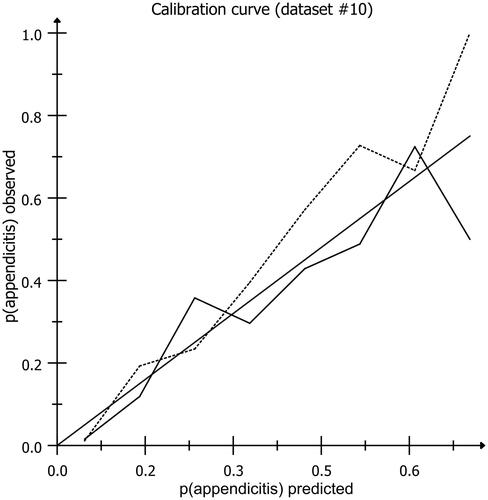
shows the final model after adjusting the initial beta coefficients with a shrinkage factor of 0.95. The C-statistic was 0.93 (95%CI, 0.92–0.95) and the calibration curves showed good calibration. In the external temporal validation, the C-statistic decreased to 0.90 (95%CI, 0.89–0.92) (Supplementary Figure S2) and the calibration curves again showed good calibration (). Therefore, the final model did not require updating and was used to build the online calculator available at https://jscalc.io/calc/YKeGYmYoeBSgK7FC for demonstration purposes.
Figure 1. Calibration plot showing the agreement between expected and observed probabilities in the development cohort (dotted line) and the validation cohort (solid line). the best model’s results would align closely with the diagonal line X = Y, were the observed numbers are equal to the predicted numbers. The data are based on predictions by the final model applied in the development and validation cohorts in two randomly chosen imputed datasets (#10 of each cohort).
Performance
Point scores ranged from 0 to 18, corresponding with model-based predicted probabilities of acute appendicitis from 0.05% to 85% (). In the validation cohort, 29.3% of children referred and 1.4% of children not referred had appendicitis. Agreement between the classifications based on the point score and the GP’s decision to refer was maximal at a cut-off value ≥11 points (), with 24.8% above and 1.5% below this cut-off having appendicitis.
Figure 2. Predicted probability of acute appendicitis by point score the predicted probability of acute appendicitis in the low-risk (green), medium-risk (orange) and high-risk (red) groups, based on the final model, is juxtaposed against the point score. For example, in a boy (2 points) with fever (1 point), vomiting (2 points), pain duration between 24 and 48 h (2 points), absent bowel sounds (1 point), and peritoneal irritation (4 points), but without right lower quadrant tenderness, the point score is 11. As the graph shows, this corresponds to a predicted probability of acute appendicitis of 0.12.
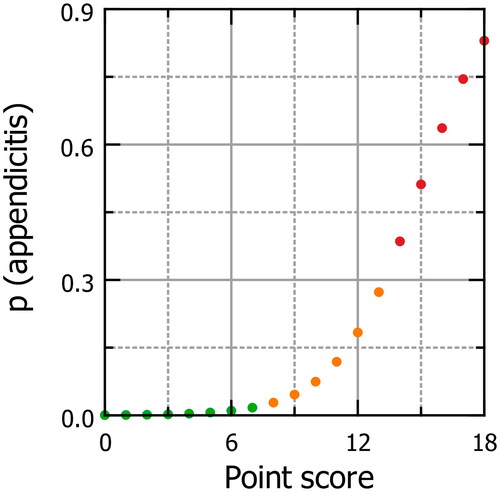
Table 3. Diagnostic performance and observed diagnoses at each point score cut-off in the validation cohort.
Risk groups
Using two cut-offs corresponding to a 95% sensitivity and 95% specificity, we categorised the point scores and defined low risk as ≤ 7, medium risk as 8–13, and high risk as ≥14 with observed probabilities of appendicitis of 0.5% (95%CI, 0.2–0.9), 7.5% (95%CI, 6.2–9.0), and 41.0% (95%CI, 34.0–48.3), respectively. Of the 3,650 children in the validation cohort, 2,053 (56%) had low risk, 1,402 (38%) had medium risk, and 195 (5%) had high risk (Supplementary Figure S3); and, of the 195 children with acute appendicitis, 10 (5%, as pre-defined) had low risk, 105 (54%) had medium risk, and 80 (41%) had high risk. In the low, medium and high-risk groups, 2.9% (95% CI: 2.3% − 3.5%), 27.1% (24.9% − 29.4%) and 71.5% (65.9% − 77.2%) of children were referred by the GP during the index consultation, respectively.
Discussion
Main findings
Our clinical prediction rule uses seven easily assessed predictors of appendicitis in children with acute abdominal pain: male sex, pain duration, nausea/vomiting, elevated temperature, abnormal bowel sounds, RLQ tenderness, and peritoneal irritation. The rule can stratify children presenting with acute abdominal pain in primary care into three risk groups. Among the children, 56% were classified as low risk, 38% as medium risk, and 5% as high risk, with corresponding probabilities of appendicitis estimated at 0.5%, 7.5%, and 41.0%, respectively. Calibration and discrimination of the model was good, with a C-statistic of 0.90 at external validation.
Strengths and limitations
This study benefitted from a large cohort with an adequate number of patients with acute appendicitis (96 of 2041 in the development cohort and 195 of 3,650 in the validation cohort), allowing for over 10 events per variable [Citation8]. In fact, the number of events exceeded the minimum of 100 and approached the more ideal 200 recommended for external validation in simulation studies [Citation20]. Although new methods have become available since designing the study and collecting the data [Citation21], we decided against applying elaborate posthoc sample size calculations. The successful temporal external validation, with good calibration and discrimination, represents a strength of this study, although the validation was narrowed by using a similar cohort, limiting generalisability. External validation in different datasets, such as prospective studies or studies conducted in other countries, could yield less favourable results and future studies are required to achieve broad validation and generalisability [Citation6].
Using routine healthcare data resulted in many unavailable data on predictors, with only 7 of the 13 candidate predictors being sufficiently available [Citation6]. Predictors were selected as candidate predictors only when > 50% of their values were available, based on judgement as strict criteria are lacking [Citation6]. However, we assume each GP will record the most important predictors to their decision [Citation4]. Information bias and problems in selecting a representative cohort may also limit research using registration data [Citation22]. To reduce these biases, we used a combination of free text, diagnostic codes, and structured extraction forms. Additionally, defining the absence of acute appendicitis based on an observation period may have introduced differential verification bias. However, this approach ensured that no children with clinically manifest appendicitis will have gone unnoticed, which makes differential verification bias less likely [Citation24]. Although information and differential verification biases can lead to test characteristics being overestimated [Citation22], the study predictors were assessed according to daily practice, which is recognised to result in realistic accuracy estimates [Citation23].
Comparison with existing literature
Several clinical prediction rules exist for estimating the probability of appendicitis in secondary care, but none are validated in primary care. Moreover, we are aware of no other research into developing or validating a clinical prediction rule for acute appendicitis in primary care [Citation11]. Our study is per existing recommendations stating that the setting affects how prediction models perform; existing secondary care prediction models need to be validated and modified for primary care [Citation9, Citation18]. Unfortunately, the limited availability of predictor values in our cohort and the inclusion of white blood counts in most existing models meant that we could not directly compare our rule with these models. Although age is reported to affect clinical presentation, it did not influence the interpretation or selection of predictors in this study [Citation11].
Clinical prediction rules for acute appendicitis in children have been studied extensively in secondary care, producing C-statistics of 0.61–0.85, sensitivities of 0.72–1.00, and specificities of 0.34–0.98 [Citation10, Citation11, Citation24]. External temporal validation of the model in this study produced a C-statistic of 0.90 (95%CI, 0.89–0.92). A decrease in the discriminative value of diagnostic tests in secondary care when patients with positive test results are likely to be referred could account for this difference [Citation25]. In addition, the baseline prevalence (prior) was lower in primary care compared to secondary care (5% vs 27%) [Citation11]. Furthermore, low and high cut-offs have been presented for different prediction rules for appendicitis, with sensitivity at low cut-offs ranging from 88.1 to 97.2 and specificity at high cut-offs ranging from 70.1 to 98.9 as compared to the pre-defined value of 95% for both sensitivity and specificity in our study [Citation26].
Implications for research and practice
GPs miss approximately 19% of children with appendicitis and refer 69% to other, mainly self-limiting, conditions [Citation4]. The developed rule could quickly evaluate symptoms and signs to support the structured evaluation of children with acute abdominal pain. It could serve as a memory aid for the GP to ensure that the most predictive clinical features of acute appendicitis are evaluated, making care more homogeneous.
Risk stratification could offer a more efficient approach to usual care by reducing the number of referrals without missing more cases of acute appendicitis. This may include using C-reactive protein testing, which has most impact on the decision process in those at medium risk [Citation14]. CRP point-of-care testing has become increasingly available in primary care in many European countries and its introduction in the UK has been advocated [Citation27]. We did not consider CRP for the prediction model because a CRP-test is only appropriate in children with a medium risk of appendicitis [Citation14].
Thus, when using the prediction rule in practice, we suggest parental observation for children at low risk (0.5%), further testing and/or reassessment by the GP for those at medium risk (7.5%), and direct referral to secondary care for those at high risk (41.0%) or for those at medium risk when the suspicion is high. This diagnostic strategy may potentially decrease the referrals of children without acute appendicitis without delaying a diagnosis of appendicitis compared with current GPs’ practice. However, it is recommended that GPs should combine the probabilistic data obtained from our tool with their clinical judgement in every case. Further research could investigate factors influencing the decision to refer, given the 2.9% referral rate for low-risk children and the 28.5% non-referral rate for high-risk children. Given that other diagnoses are usually considered when assessing the need for referral, clinical impact studies must now evaluate the impact of our proposed diagnostic strategy on clinical decision-making and patient outcomes in primary care [Citation18].
Conclusion
Using registration data in a historical cohort study, we developed a clinical prediction rule for acute appendicitis in children with acute abdominal pain in primary care. The underlying model’s performance was good at internal and temporal validation. We suggest a diagnostic strategy with risk stratification based on this clinical prediction rule. Clinical-impact studies are warranted to evaluate its effect on clinical decision-making and patient outcomes in primary care.
Ethical approval
The Medical Ethics Review Committee (METc) of the University Medical Centre Groningen approved this study (METc2017/541) and concluded that this study did not fall under the scope of the Dutch Medical Research Involving Human Subjects Act (WMO).
Supplementary Table 3
Download MS Word (14.4 KB)Supplementary Table 1
Download MS Word (17.1 KB)Supplementary Figure 3
Download MS Word (109.3 KB)Supplementary Figure 2
Download MS Word (40.5 KB)Supplementary Figure 1
Download MS Word (128.9 KB)Acknowledgements
Dr Robert Sykes (www.doctored.org.uk) provided manuscript editing services for the final pre-submission drafts.
Disclosure statement
The authors alone are responsible for the content and writing of the paper.
Correction Statement
This article has been corrected with minor changes. These changes do not impact the academic content of the article.
References
- Kumar JS, Jaya Kumar S. Trends in incidence of acute appendicitis in children. Acad J Ped Neonatol. 2017;3(5):1–5. doi:10.19080/AJPN.2017.03.555682.
- Eizenga WH, Gieteling MJ, Berger MY, et al. Summary of the NHG guideline “abdominal pain in children”, the 100th NHG guideline. Ned Tijdschr Geneeskd. 2013;157(15):A6191. http://www.ncbi.nlm.nih.gov/pubmed/23575296
- National Institute for Health and Care Excellence. Appendicitis. Clinical Knowledge Summary. Published 2015. [cited 2019 November 20]. Available form: https://cks.nice.org.uk/appendicitis#!topicSummary.
- Blok CGH, Veenstra LMM, van der Lei J, et al. Appendicitis in children with acute abdominal pain in primary care, a retrospective cohort study. Fam Pract. 2021;38(6):758–765. doi:10.1093/fampra/cmab039.
- Marewski JN, Gigerenzer G. Heuristic decision making in medicine. Dialog Clin Neurosci. 2012;14(1):77–89. doi:10.31887/dcns.2012.14.1/jmarewski.
- Steyerberg E. Clinical prediction models. New York (NY): Springer-Verlag; 2009. doi:10.1007/978-0-387-77244-8.
- Craig S, Dalton S. Diagnosing appendicitis: what works, what does not and where to go from here? J Paediatr Child Health. 2016;52(2):168–173. doi:10.1111/jpc.12998.
- Riley RD, Ensor J, Snell KIE, et al. External validation of clinical prediction models using big datasets from e-health records or IPD meta-analysis: opportunities and challenges. BMJ. 2016;353(mar31_1):i3140. doi:10.1136/bmj.i3140.
- Wolff RF, Moons KGM, Riley RD, et al. PROBAST: a tool to assess the risk of bias and applicability of prediction model studies. Ann Intern Med. 2019;170(1):51–58. doi:10.7326/M18-1376/SUPPL_FILE/M18-1376_SUPPLEMENT.PDF.
- Kulik DM, Uleryk EM, Maguire JL. Does this child have appendicitis? A systematic review of clinical prediction rules for children with acute abdominal pain. J Clin Epidemiol. 2013;66(1):95–104. doi:10.1016/j.jclinepi.2012.09.004.
- Nepogodiev D, Wilkin RJ, Bradshaw CJ, et al. Appendicitis risk prediction models in children presenting with right iliac fossa pain (RIFT study): a prospective, multicentre validation study. Lancet Child Adolesc Heal. 2020;4(4):271–280. doi:10.1016/S2352-4642(20)30006-7.
- Collins GS, Reitsma JB, Altman DG, et al. Transparent reporting of a multivariable prediction model for individual prognosis or diagnosis (TRIPOD): the TRIPOD statement. BMC Med. 2015;13:1. doi:10.1186/s12916-014-0241-z.
- de Ridder MAJJ, de Wilde M, de Ben C, et al. Data resource profile: the integrated primary care information (IPCI) database, The Netherlands. Int J Epidemiol. 2022;51(6):e314–e323. doi:10.1093/IJE/DYAC026.
- Blok GCGH, Nikkels ED, van der LJ, et al. Added value of CRP above clinical features for appendicitis in children. Eur J Gen Pract. 2022;28(1):1–26. doi:10.1080/13814788.2022.2067142.
- Bell ML, Fairclough DL. Practical and statistical issues in missing data for longitudinal patient-reported outcomes. Stat Methods Med Res. 2014;23(5):440–459. doi:10.1177/0962280213476378.
- Heymans MW, Anema JR, van Buuren S, et al. Return to work in a cohort of low back pain patients: development and validation of a clinical prediction rule. J Occup Rehabil. 2009;19(2):155–165. doi:10.1007/s10926-009-9166-3.
- Tilling K, Williamson EJ, Spratt M, et al. Appropriate inclusion of interactions was needed to avoid bias in multiple imputation. J Clin Epidemiol. 2016;80:107–115. doi:10.1016/j.jclinepi.2016.07.004.
- Cowley LE, Farewell DM, Maguire S, et al. Methodological standards for the development and evaluation of clinical prediction rules: a review of the literature. Diagn Progn Res. 2019;3(1):1–23. doi:10.1186/s41512-019-0060-y.
- Marshall A, Altman DG, Holder RL, et al. Combining estimates of interest in prognostic modelling studies after multiple imputation: current practice and guidelines. BMC Med Res Methodol. 2009;9:57. doi:10.1186/1471-2288-9-57.
- Collins GS, Ogundimu EO, Altman DG. Sample size considerations for the external validation of a multivariable prognostic model: a resampling study. Stat Med. 2016;35(2):214–226. doi:10.1002/SIM.6787.
- van Smeden M, Moons KGM, de Groot JAH, et al. Sample size for binary logistic prediction models: beyond events per variable criteria. Stat Methods Med Res. 2019;28(8):2455–2474. doi:10.1177/0962280218784726.
- Oostenbrink R, Moons KGM, Bleeker SE, et al. Diagnostic research on routine care data: prospects and problems. J Clin Epidemiol. 2003;56(6):501–506. doi:10.1016/S0895-4356(03)00080-5.
- Grobbee DE, Arno WH. Clinical Epidemiology Principles, Methods and Applications for Clinical Research. 2015.
- van Amstel P, Gorter RR, van der Lee JH, et al. Ruling out appendicitis in children: can We use clinical prediction rules? J Gastrointest Surg. 2019;23(10):2027–2048. doi:10.1007/s11605-018-3997-1.
- Sackett DL, Haynes RB. Evidence base of clinical diagnosis: the architecture of diagnostic research. BMJ. 2002;324(7336):539–541. doi:10.1136/bmj.324.7336.539.
- Gudjonsdottir J, Marklund E, Hagander L, et al. Clinical prediction scores for pediatric appendicitis. Eur J Pediatr Surg. 2021;31(3):252–260. doi:10.1055/s-0040-1710534.
- John AS, Hopstaken R, Tirimacco R, et al. Analysis implementing point-of-care CRP testing for better diagnosis of acute respiratory infections. Br J Gen Pract. 2022;72(715):87–88. doi:10.3399/bjgp22X718517.