
ABSTRACT
Background: To identify and investigate the effects of a novel splicing variant, c.1444–2A>C of OPA1, on its transcript, translation, and mitochondrial function, which was found in an 8-year-old patient with dominantly inherited optic atrophy (DOA).
Materials and Methods: The clinical evaluations were performed at the Eye Center. Lymphoblast cell lines were generated from the patient, mother, and a normal control with the same haplotype of mitochondrial genome. The novel variant was confirmed by Sanger sequencing. The splicing alteration of cDNA was checked by both Sanger sequencing and agarose gel. OPA1 expression was carried out by RT-PCR and Western blotting. Transmission electron microscopy was used for mitochondrial morphology. Mitochondrial functions, including the rates of oxygen consumption, ATP generation, ROS product and membrane potential were assayed in lymphoblast cells.
Results: The novel OPA1 splicing variant, c.1444–2A>C, led to a deletion of the 15th exon in mRNA transcript. Approximately 50% reduction of mRNA and protein expression was present in mutant cells as compared with controls. No marked depletion of mtDNA nor mitochondrial mass was caused by the splicing variant. However, defects that the impaired capacity of OXPHOS, reduced ATP generation, increased ROS and decreased membrane potential were observed in the mutant cells, which promoted a ubiquitin-binding mitophagy instead of apoptosis.
Conclusions: The novel splicing variant, c.1444–2A>C resulted in OPA1 haploinsufficiency effect on its expression and mitochondrial function without mtDNA depletion. Our findings may provide new insights into the understanding of pathophysiology of DOA.
Introduction
Autosomal-dominant optic atrophy (DOA, OMIM #165500) is one of the most common and heterogeneous groups of optic atrophy caused by selective loss of retinal ganglion cells (RGCs) and ascending degeneration of the optic nerve (Citation1,Citation2). The OPA1 is the most prevalently causative gene for DOA, containing total 30 exons with alternative splicing variants involving exons 4, 4b, and 5b that led to eight different mRNA species in humans (Citation3). Update, more than 400 considered pathogenic variants of OPA1, mostly family-specific, are reported to distribute along the entire protein-coding sequence, but many are clustered in the GTPase domain (https://www.lovd.nl/OPA1). Additionally, the extent of depletion of various mutant OPA1 transcripts and its proteins in DOA patients is highly variable, ranging from no change to an apparent ~2/3 loss (Citation4), which resulted phenotypic heterogeneity in patients. As protein OPA1 is required for mitochondrial fusion and the formation of mitochondrial cristae, the core functions of OPA1 were essential for mitochondrial bioenergetics, mitochondrial DNA stability, control of apoptosis and possibly autophagy (Citation5–8). How specific OPA1 mutants affect these functions has been widely investigated but remains without consensus, as the type/position of OPA1 variants has different effects on its transcript, translation, and thereby mitochondrial function, which in turn responsible for the diversity of pathophysiology in DOA.
The frequency of OPA1 mutations is high in Han Chinese Patients with Optic Neuropathy (Citation9). Here, a novel heterozygous variant, c.1444–2A>C in intron 14 of OPA1 (NM_015560), was found in a sporadic DOA patient with centrocecal scotoma and pale temporal optic disc in both eyes. However, the produced effects of splicing variants were barely classified and difficult to predict reliably in DOA. Considering there was two base-pair upstream the exon 15, the variant was speculated to perturb the mRNA precursor splicing based on the GU-AG rule for spliceosome recognition as elsewhere (Citation10). To identify the function of c.1444–2A>C variant, lymphoblastoid cell lines were generated from the patient and two control subjects with the wild-type OPA1 and same haplotype of mitochondrial DNA (mtDNA). The mutant OPA1 was assessed for its effects on mRNA precursor splicing, transcript, translation, and mitochondrial morphology and function including mtDNA copy number to better understand how the novel intron variant leads to the haploinsufficiency of OPA1 in DOA.
Materials and methods
Clinical evaluation and Sanger sequencing
The patient exhibiting DOA was identified at the Eye Center, the Second Affiliated Hospital of Zhejiang University School of Medicine. Ophthalmologic evaluations were taken including best-corrected visual acuity (BCVA) according to decimal Snellen E chart, color fundus image, optical coherence tomography (OCT), visual-field testing, etc. Genomic DNA was isolated from peripheral blood with QIAamp DNA Blood Midi Kit (Qiagen) according to the manufacturer’s protocol. Sanger sequencing was performed by TsingKe Biological Technology (Beijing) with the following primer (F:5ʹ-ACACATCATTCCGGGTTTT CG-3ʹ; R:5ʹ-CCTACTTTAGGAGCTTTGAATTCTG-3ʹ). Informed consent, blood samples, and clinical evaluations were obtained from all participants, under protocols approved by the Ethic Committees of Zhejiang University, and our study here followed the principles of Declaration of Helsinki.
Cell cultures and culture conditions
Lymphoblastoid cell lines were derived from the DOA patient carrying the OPA1 c.1444–2A<C mutation and two vision normal member (one is patient mother, the other is genetically unrelated control subject with the same haplotype Y1 of mtDNA as Supplementary Table 1), which were immortalized by transformation with the Epstein-Barr virus, as described previously (Citation11). Lymphoblastoid cell lines were grown in RPMI1640 medium (Invitrogen), supplemented with 10% fetal bovine serum (FBS).
RT-PCR, mtDNA copy number analysis
Total cellular RNA was extracted using TRIzol (Takara, Japan) according to the manufacturer’s protocol. The cDNA segment was synthesized using the PrimeScriptTM RT Master Mix kit (Takara, Japan), and then evaluated by 2.5% agarose gel electrophoresis. Gene expression was analyzed on the 7900 HT Fast Real-time PCR System (Applied Biosystems) using the Universal SYBR Green Master (Roche Applied Science, Mannheim, Germany), in which three pairs primers were used as follows: Primer1 for segment between exon13 and exon17 (primer1F, 5ʹ-AGCAAAGCTTACATGCAGAATCC-3ʹ, primer1R, 5ʹ-TGTGCCTTTAGCATGCTT GTC-3ʹ); Primer2 for segment between exon18 and exon21 (primer2F, 5ʹ-CGGGAACTTGACCGGAATGA-3ʹ, primer2R, 5ʹ-GTAGGGTCTCCCAAGCAACC-3ʹ), and Primer3 for segment between exon 9 and exon 13 (primer3F, 5ʹ-TGGGGAGATGATGACACGTT-3ʹ, primer3R, 5ʹ-TTCCT TTGTGTCAGG AGCCA-3ʹ). The GAPDH was used as an internal control. For mtDNA copy number analysis, 50 ng of DNA was extracted with the MiniBEST Universal Genomic DNA Extraction Kit KaRa) and qPCR with a pair of primer for mtDNA (MT-16S rRNA-ND1) with 18S for normalization as described before (Citation12). Primers are following as: MT-16S-ND1: 5′-CACCCA AGAACAGGGTTTGT-3′ (sense) and 5′-TGGCCATGGGTATGTTGTTAA-3′ (anti-sense); 18S: 5′-TAGAGGGACAAGTGG CGTTC-3′ (sense) and 5′-CGCTGAGCCAGTCAGTGT-3′ (anti-sense).
Immunoblotting and immunocytochemistry analysis
Western blotting was performed with 20 μg of total cellular proteins isolated from mutant and control cells. The antibodies used here were from Abcam (Anti-TOM20, P62), Proteintech (GAPDH, MFN1, MFN2, DRP1), Abgent (PINK1); Cell Signaling Technology (OPA1and PARK2). Secondary antibody solutions contained either peroxidase-conjugated goat anti-rabbit or anti-mouse IgG (Jackson). Protein signals were detected using the ECL system (CWBIO, Beijing). For immunofluorescence, cells were cultured on collagen-coated coverslips (Thermo Fisher), fixed in 4% formaldehyde at 4°C for 15 minutes then blocked with 5% fetal bovine serum (FBS) with 0.2% Triton X-100 for 1 hour. After incubating with anti-TOM20 at 4°C overnight, cells were then incubated with Alex Fluor 594 goat anti-rabbit IgG with DAPI for 15 minutes and mounted (Sigma-Aldrich). Images were taken by Olympus FV1000 (Japan).
Transmission electron microscopy (TEM)
Specimens were fixed with 2.5% glutaraldehyde in phosphate buffer (0.1 M, pH: 7.0) for more than 4 hours, followed by 1% osmium tetroxide in phosphate buffer (0.1 M, pH: 7.0) for 1–2 hours. Specimens were then dehydrated by a graded ethanol series followed by infiltration and finally embedded in epoxy resin. Ultrathin sections were stained with 2% uranyl acetate and alkaline lead citrate for 5 to 10 min respectively and visualized by Hitachi Model H-7650 TEM (Japan).
Mitochondrial respiration extracellular flux analysis
The rates of oxygen consumption in lymphoblastoid cell lines were measured with a Seahorse Bioscience XF-96 Extracellular Flux Analyzer (Seahorse Bioscience), as detailed previously (Citation12). A density of 1 × 10⁵ cells per well in 96-well plate was coated with Cell-TakTM adhesive. The rates of O2 consumption were determined under basal condition and after the addition of oligomycin (1 μM), carbonyl cyanide p-(trifluoromethoxy) phenylhydrazone (FCCP) (0.5 μM), rotenone (1 μM) and antimycin A (1 μM).
Measurement of mitochondrial ROS production
The levels of mitochondrial reactive oxygen species (ROS) generation were determined using MitoSOX assay as detailed previously (Citation13). Approximate 1 × 10⁶ cells of each cell line were harvested, resuspended in 5 μM MitoSOX reagent working solution followed by incubation at 37°C for 30 min. Samples were then analyzed by BD-LSR II flow cytometer system (Beckton Dickson, Inc.), with an excitation at 488 nm and emission at 529 nm.
Measurement of intracellular ATP
The levels of cellular and mitochondrial ATP levels were measured using the ATP Bioluminescence Assay Kit HS II (Roche Applied Science, Mannheim, Germany) according to the manufacturer’s instruction. In brief, samples of 2 × 10⁶ cells were incubated for 2 hours in the record solution (156 mM NaCl, 3 mM KCl, 2 mM MgSO4, 1.25 mM KH2PO4, 2 mM CaCl2, 20 mM HEPES, pH 7.35) with 10 mM glucose (total ATP production), or 5 mM 2-deoxy-D-glucose plus 5 mM pyruvate (oxidative ATP production). Cells were lysed and then incubated with the luciferin/luciferase reagents. After 10 min incubation at room temperature, the luminescence was read on a microplate reader (Synergy H1, Bio-Tek).
Assessment of mitochondrial membrane potential
Mitochondrial membrane potential was assessed with JC-10 Assay Kit Flow Cytometry (Abcam) following general manufacturer’s recommendations. In brief, after culturing in 6-well cell overnight, cells were incubated with JC-10 dye for 30 min at 37°C, 5% CO2, and then analyzed by BD-LSR II flow cytometer system (Beckton Dickson, Inc.) at Ex/Em = 490/525 and 490/590 nm. Ten thousand events were analyzed in each sample.
Cell apoptosis measurement
Cell apoptosis was evaluated by B D-LSR II flow cytometer (Beckton Dickson, Inc.) using an Annexin V-FITC/PI apoptosis detection kit following general manufacturer’s recommendations. For each sample, 5 μL (90 μg/mL) of Annexin-V-FITC and 2 μL (1 mg/mL) propidium iodide were added to the cell suspension and incubated for 30 min at room temperature (25°C) in dark. Unstained cell served as the negative controls. Cell death by apoptosis was scored by quantifying the population of Annexin V-FITC-positive cells for 10,000 events.
Statistics
Data were expressed as mean±SD at least three independent experiments unless otherwise specified and performed using GraphPad Prism (version 8.0) with 2-tailed paired or unpaired Student’s t-tests. P values of less than 0.05 were statistically significant.
Results
Clinical manifestation
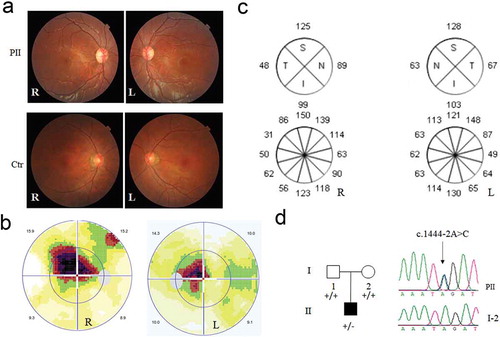
The patient was an 8-year-old boy referred to our neuro-ophthalmology clinic for consultation due to poor vision in both eyes for two years. The boy was born by full-term natural delivery, and his past medical history was unremarkable until his vision in both eyes was found lower than normal during a routine physical examination before primary school entrance two years ago. His parents were both normal and denied any family history of hereditary diseases. At presentation, his visual acuity was 0.3 and 0.4 in the right and left eye respectively and could not be corrected. As shown in , anterior segment was normal and temporal optic disc was pale in both eyes by fundus examination. Visual field test revealed centrocecal scotoma in both eyes, and optical coherence tomography (OCT) revealed thinned retinal neuro-fiber layer thickness in the temporal sector around optic disc in both eyes (&c). An initial clinical diagnosis of hereditary optic neuropathy in both eyes was made, and the boy was strongly recommended to get a mitochondrial and autosomal DNA analysis to exclude Leber hereditary optic neuropathy and DOA, respectively. A novel heterozygous variant, c.1444–2A>C in intron 14 of OPA1 gene (NM_015560) was detected in the boy (), but absent in either of his patients. No pathogenic mutants of mtDNA were detected in cells derived from the patient (Supplementary Table 1).
Figure 1. Clinical evaluation and genetic test for the DOA patient. (a) The color fundus image. Color fundus photographs showed paled temporal optic disc in both eyes of the patient, and normal optic disc in both eyes of the normal control. R: right eye, L: left eye. (b)Visual field test in both eyes of the patient. (c)Optical coherence tomography of the right (R) and left (L) eyes around optic disc for patient. (d) The novel heterozygous variant, c.1444–2A>C in the DOA patient, confirmed by Sanger sequencing. PII, DOA patient; I-2, mother, as a family control. “+”, wild-type allele; “-”, mutant allele
Aberrant mRNA splicing and reduced expression of mRNA and protein
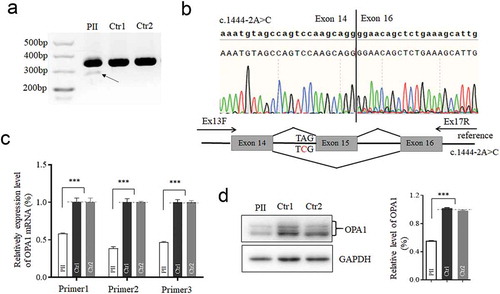
To investigate whether the intron variant perturbs the splicing of mRNA transcript, OPA1 cDNA was synthesized using Primer1. As shown in , a weak band was present below the normal one in mutant cell, which was further confirmed by Sanger sequencing with a deletion of Exon 15. Obviously, the amount of short cDNA band was significantly lower and difficult to be detected. To check the mRNA expression, three pairs of primers were designed for RT-qPCR segments that encompass the exon 15 (primer1), downstream the exon15 (primer2), and upstream the exon 15 (primer 3). Significantly, approximately 50% reduction of mRNA expression occurred in the mutant cells (), which in turn resulted in 50% decrease in OPA1 protein detected by Western blot (). Collectively, the heterozygous c.1444–2A>C in intron 14 of OPA1 led to a deletion of Exon 15 in OPA1 transcript, reduction in both mRNA and protein expression.
Figure 2. Effects of the splicing variant on OPA1 mRNA-transcript and its translation. The cDNA segments by reverse transcription polymerase chain reaction analyzed with the agarose gel (a), and Sanger sequencing (b). RNA extracted from the patient (PII) and other two controls (Ctr1, mother as a family control; Ctr2, genetically unrelated control subject with the same mtDNA haplotype). A schematic diagram below shows the Exon 15 skipping, caused by c.1444–2A>C. (c) The mRNA expression by three pairs of primers. segment by Primer1 encompass the exon15; segment by Primer2 is downstream the exon 15; segment by Primer3 is upstream the exon15. 50% reduction of mRNA expression was checked in the mutant cell, related to the controls. (d) Western blotting of OPA1 protein in the mutant and control cells. OPA1 protein decreased 50% in the mutant cells as comparison to the control. *, P < .05; **, P < .01; ***, P < .001
Non-alteration in mtDNA depletion, but mild change in morphology
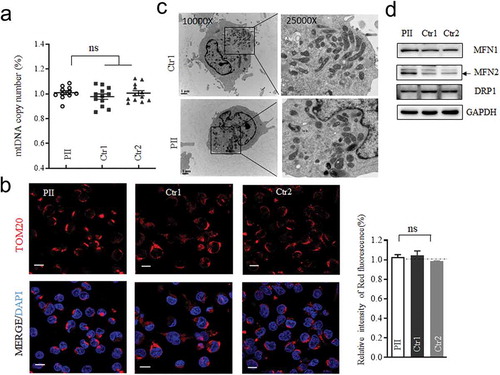
The missense mutation of OPA1 was reported to reduce the mtDNA contents (Citation14). We therefore assessed the mtDNA copy number by quantitative PCR firstly using primer for segment covered MT-16S rRNA and ND1 region with 18S rRNA as a control. No significant difference was observed in mtDNA contents between the mutant and control cells (). Moreover, intensity of fluorescence of TOM20, as a detector of mitochondrial mass, was comparable in both mutant and control lymphoblastoid cells (). To evaluate whether the splicing variant has effect on mitochondrial morphology, cells were fixed for TEM analysis. As shown in , cells with the splicing variant exhibited more punctate mitochondria, which was clustered in the perinuclear region, as comparison with the control cells. Neither vacuolated mitochondria nor loss of cristae was displayed substantially. Additionally, the level of either MFN1 or DRP1 for mitochondrial dynamics was unchanged (). Whereas, MFN2 was increased in mutant cells, which was assumed to be associated with mitophagy or reverse response to counteract fission (Citation15).
Figure 3. Assay for Mitochondrial DNA content, mitochondrial mass and its morphology. (a) Measurements of mtDNA copy numbers in lymphoblastoid cell lines. The mtDNA copy numbers were determined as a ratio of mtDNA to nDNA (18S) by real-time quantitative PCR (n = 11 or 12). (b) Mitochondrial mass visualized by Immunofluorescent labeling. TOM20 (red) stained for mitochondria; DAPI stained for nuclei. (c)Mitochondrial morphology, imaged by TEM. Punctate and tubular mitochondria mixed in cells. (d) Western blotting of mitochondrial fusion (MFN1 and MFN2) and fission (DRP1) protein, GAPDH as a loading control. *, P < .05; **, P < .01; ***, P < .001. ns, non-significantly
Mitochondrial respiratory defects with ROS upsurge
To evaluate whether the c.1444–2A>C heterozygous variant impair oxidative phosphorylation, we measured the oxygen consumption rate (OCR) of the mutant and two control cell lines using a Seahorse Bioscience XF-96 Extracellular Flux Analyzer following the sequential addition of inhibitors for respiratory chain complex (Citation12,Citation13). As shown in , the average basal OCR in mutant cells was 61.6% (P < .001) relative to the mean value measured in control cells. The ATP-linked OCR in mutant cells monitored after oligomycin added were ~60.4% of that of the control cells (P < .001). Similarly, lower level of maximal OCR in mutant cell line, detected after FCCP added, was 65.1% (P < .001) compared with the controls. The lower ATP-linked OCR usually led to lower level of ATP. Strikingly, the levels of cellular ATP production in mutant cells were about 72.9% (P < .001) of that measured in control cells (). Consistently, the mitochondrial ATP production in the mutant cells were 82.7% (P < .001) of average value of the controls, by inhibited the glycolysis using pyruvate and 2-deoxy-D-glucose. The levels of mitochondrial ROS as a by-product in respiratory chain among the mutant and control cell lines were measured with MitoSOX indicator by flow cytometry. Compared to the controls, the levels of mitochondrial ROS in the mutant cells were increased to139% (P < .01) as illustrated in . These data evidenced that the splicing variant of OPA1 impaired the function of mitochondrial respiratory chain with lower ATP production and accumulated ROS.
Figure 4. Mitochondrial function analysis. (a) The rates of oxygen consumption (OCR) in the various cell lines using different inhibitors. OCR were first measured on 1 × 10⁵ cells of each cell line under basal conditions and then after the addition of oligomycin (1 μM), carbonyl cyanide p-(trifluoromethoxy) phenylhydrazone (FCCP) (0.5 μM), rotenone (1 μM) and antimycin A (1 μM) to determine different parameters of mitochondrial functions. Graphs presented the basal OCR, ATP-linked OCR, and the maximal OCR in cell lines. (b)Measurement of cellular and mitochondrial ATP levels using bioluminescence assay. Cells were incubated with 10 mM glucose or 5 mM 2-deoxy-D-glucose plus 5 mM pyruvate to determine ATP generation under cellular and mitochondrial ATP levels. Data are mean ± SD of quadruplication. (c) Measurement of mitochondrial ROS by BD-LSR II flow cytometer system using Mitochondrial Superoxide Indicator, MitoSOX Red. Data are mean ±SD of triplicates. *, P < .05; **, P < .01; ***, P < .001. ns, non-significantly
Mitophagy promoted in mutant cell
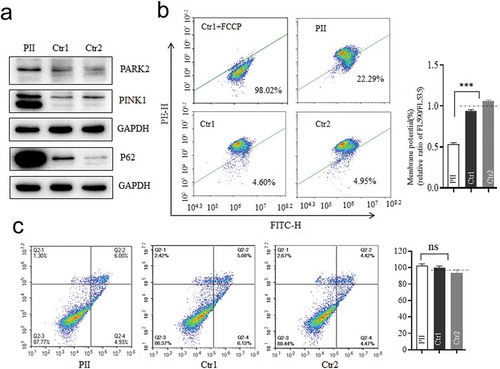
Considering the defect of OPA1 would cause mitophagy to remove damaged mitochondria timely as a compensatory mechanism (Citation16), we tested whether the splicing variant could elicit it either. As expected, PARK2 and PINK1 were markedly up-regulated with enhanced p62 in the mutant cells as compared to the controls (), indicating the increased level of ubiquitin-binding mitophagy which was PINK1/PRAK2-dependent (Citation15,Citation17). As the accumulation of PINK1 was reported to be induced to the increased ROS production or depolarization (Citation18,Citation19), the mitochondrial membrane potentials (MMP) were measured by the ratios of the fluorescence intensity (FL590/FL530). Compared to the controls, the average level of MMP in mutant cells was decreased to 53.1% (P < .0001) as shown in . By contrast, no significant difference in apoptosis was found between mutant and control cells () as previous findings (Citation20). These data indicated that the OPA1 defect due to the c.1444–2A>C variant here promoted mitophagy, concomitant with both lower MMP and increased ROS, rather than apoptosis.
Figure 5. Mitophagy and apoptosis assay. (a) Western blotting analysis using antibodies for Parkin (PARK2), PINK1, and P62 with GAPDH as a loading control. (b)Mitochondrial membrane potential (MMP) measured by the fluorescence probe JC-10 assay. The ratio of fluorescence intensities Ex/Em = 490/590 nm and 490/530 nm (FL590/FL530) were recorded to delineate the MMP level of each sample. Data are mean ±SD of triplicates. (c) The apoptosis evaluation using the Annexin V-FITC/PI apoptosis detection kit by flow cytometry. Data are mean ±SD of triplicates. *, P < .05; **, P < .01; ***, P < .001. ns, non-significantly
Discussion
The OPA1 are the major causative gene for DOA, including variants of missense, frameshift, nonsense, deletions, and variants associated with altered splicing. Here, we identified a novel splicing one, c.1444–2A>C, in an 8-year-old boy suffered in DOA. Similarly, c.1444–1 G > T and c.1444–1 G > C variants were reported as pathogenic or likely pathogenic respectively in the OPA1 database (https://www.lovd.nl/OPA1) without the classified effect. As the variant locates in exon-intron boundaries, the deletion of exon15 was observed in the short cDNA product as predicted. Whereas the amount of alternative cDNA was much lighter to be detectable as compared to the long heavy transcript in samples from proband and controls (), indicating that the c.1444–2A>C variant did not disturb the transcription from the other normal strand of OPA1 gene, and thereby the variant would solely attenuate the quantity of OPA1 expression. Consistent with the finding, approximately 50% reduction was observed in both OPA1 mRNA expression and protein levels in the mutant cells. Thus, our observations revealed that the c.1444–2A>C resulted in a haploinsufficiency effect of the main condition for DOA (Citation8,Citation21), rather than the dominant-negative effect by some missense mutations (Citation2).
OPA1 involved in neurological diseases affecting mitochondrial dynamics, bioenergetics and mtDNA stability (Citation2,Citation22). In this study, we found that the c.1444–2A>C variant causing haploinsufficiency lead to no loss of mitochondrial mass nor depletion of mtDNA content, but impairment mitochondrial bioenergetics with a lower capacity of OXPHOS, decreased mitochondrial ATP generation and increased ROS product. The marked depletion of mtDNA reported in cells with compound heterozygosity or homozygous OPA1 mutations (Citation16,Citation23) was undetected here. This observation was supported by the evidence that few splicing transcripts was expressed, indicating there was almost wild type OPA1 protein translated. Conversely, missense mutations of OPA1 that resulted in mutant protein were assumed to be involved in an interference of the mutant protein on its wild type, as well as protein processing, by which ultimately to affect mtDNA maintenance. Therefore, some DOA-associated missense mutations of OPA1 led to increased mtDNA amount in fibroblast (Citation24), or mtDNA depletion in fibroblasts and lymphoblasts (Citation14,Citation24,Citation25). The mtDNA maintenance was associated with mitochondria dynamic. Tubular and punctate mitochondria were mixed in the mutant cells here, which was in agreement with unchanged expression levels of fusion (MFN1) and fission (DRP1) protein, as compared with the control cells. Similarly, mitochondrial morphology was reported to be impervious in cells carrying a C-terminal truncated allele (OPA1Δ58, c.2708delTTAG) (Citation26). Intriguingly, MFN2, associated with the increase of mitochondrial fragmentation and mitophagy (Citation16), was higher expressed in the mutant cells. In this study, we supposed that it may be mostly contributed to the mitophagy, rather than a compensatory increase for the mitochondrial fragmentation. This hypothesis was supported by the marked increase of PINK/Parkin that recruited to depolarized mitochondria to promote mitochondrial ubiquitylation and the ubiquitin-binding mitophagy (Citation8). Moreover, Parkin was evidenced to mediate the ubiquitination of MFN2 to drive mitophagy (Citation15,Citation27). The increased autophagy was also present in the RGC layer of Opa1 (±) murine models (Citation8). However, the pathophysiology underlying this splicing mutation, specifically the tissue-specific effect, needs further study.
In summary, this study identified a novel DOA-associated splicing variant, c.1444–2A>C, causing the deletion of exon15 and having an OPA1 haploinsufficiency effect on its transcript and translation. The defect OPA1 here led to impaired capacity of OXPHOS, which decreases both of ATP generation and MMP, paralleled with increased ROS product. The splicing variant has no effect on mtDNA content, nor sensitive cell to apoptosis, but active the ubiquitin-binding mitophagy. Our findings would be helpful for genetic counseling and management of DOA and provide new insights to understanding of the OPA1 haploinsufficiency in pathogenesis of DOA.
Author contributions
P.J. and X.W., conception and design, analysis and interpretation of data; C.S., H.B., and Z.L., recruited patients and performed clinical analysis; X.W. and C.W., performing biochemical and cellular experiments and analysis; C.Y. and Y.L., conducting the mutational screening and data analysis; P.J., X.W. and C.S., drafting and revising the article.
Declaration of interest
The authors report no conflicts of interest. The authors alone are responsible for the content and writing of this article.
Supplementary Material
Download PDF (282 KB)Acknowledgments
We are grateful to patients and their family members for their participation. This work was supported by Grant 31671303 to PJ from National Natural Science Foundation of China, and the Zhejiang Provincial Program for the Cultivation of High-level Innovative Health talents to P.J.
Supplementary material
Supplemental data for this article can be accessed on the publisher’s website.
Additional information
Funding
References
- Skidd PM, Lessell S, Cestari DM. 2013. Autosomal dominant hereditary optic neuropathy (ADOA): a review of the genetics and clinical manifestations of ADOA and ADOA+. Semin Ophthalmol. 28(5–6):422–26. doi:10.3109/08820538.2013.825296.
- Yu‐Wai‐Man P, Votruba M, Burté F, La Morgia C, Barboni P, Carelli V. 2016. A neurodegenerative perspective on mitochondrial optic neuropathies. Acta Neuropathol. 132(6):789–806. doi:10.1007/s00401-016-1625-2.
- Del Dotto V, Fogazza M, Carelli V, Rugolo M, Zanna C. Eight human OPA1isoforms, long and short: what are they for? Biochim Biophys Acta Bioenerg. 2018; 1859(4):263–69. doi:10.1016/j.bbabio.2018.01.005.
- Pesch UE, Leo-Kottler B, Mayer S, Jurklies B, Kellner U, Apfelstedt-Sylla E, Zrenner E, Alexander C, Wissinger B. 2001. OPA1 mutations in patients with autosomal dominant optic atrophy and evidence for semi-dominant inheritance. Hum Mol Genet. 10(13):1359–68. doi:10.1093/hmg/10.13.1359.
- Zanna C, Ghelli A, Porcelli AM, Karbowski M, Youle RJ, Schimpf S, Wissinger B, Pinti M, Cossarizza A, Vidoni S, et al. OPA1 mutations associated with dominant optic atrophy impair oxidative phosphorylation and mitochondrial fusion. Brain. 2008;131(Pt 2):352–67. doi:10.1093/brain/awm335.
- Elachouri G, Vidoni S, Zanna C, Pattyn A, Boukhaddaoui H, Gaget K, Yu-Wai-Man P, Gasparre G, Sarzi E, Delettre C, et al. OPA1 links human mitochondrial genome maintenance to mtDNA replication and distribution. Genome Res. 2011;21(1):12–20. doi:10.1101/gr.108696.110.
- Song Z, Chen H, Fiket M, Alexander C, Chan DC. 2007. OPA1 processing controls mitochondrial fusion and is regulated by mRNA splicing, membrane potential, and Yme1L. J Cell Biol. 178(5):749–55. doi:10.1083/jcb.200704110.
- Kane MS, Alban J, Desquiret-Dumas V, Gueguen N, Ishak L, Ferre M, Amati-Bonneau P, Procaccio V, Bonneau D, Lenaers G, et al. 2017. Autophagy controls the pathogenicity of OPA1 mutations in dominant optic atrophy. J Cell Mol Med. 21(10):2284–97. doi:10.1111/jcmm.13149.
- Li H, Jones EM, Li H, Yang L, Sun Z, Yuan Z, Chen R, Dong F, Sui R. 2018. Clinical and genetic features of eight Chinese autosomal-dominant optic atrophy pedigrees with six novel OPA1 pathogenic variants. Ophthalmic Genet. 39(5):569–76. doi:10.1080/13816810.2018.1466337.
- Bolognini R, Gerth-Kahlert C, Abegg M, Bartholdi D, Mathis N, Sturm V, Gallati S, Schaller A. 2017. Characterization of two novel intronic OPA1 mutations resulting in aberrant pre-mRNA splicing. BMC Med Genet. 18(1):22. doi:10.1186/s12881-017-0383-x.
- Miller G, Lipman M. Release of infectious Epstein-Barr virus by transformed marmoset leukocytes. Proc Natl Acad Sci USA. 1973;70:190–94. doi:10.1073/pnas.70.1.190.
- Yu J, Xiao Y, Liu J, Ji Y, Liu H, Xu J, Jin X, Liu L, Guan MX, Jiang P. 2014. Loss of MED1 triggers mitochondrial biogenesis in C2C12 cells. Mitochondrion. 14(1):18–25. doi:10.1016/j.mito.2013.12.004.
- Zhao X, Han J, Zhu L, Xiao Y, Wang C, Hong F, Jiang P, Guan MX. 2018. Overexpression of human mitochondrial alanyl-tRNA synthetase suppresses biochemical defects of the mt-tRNAAla mutation in cybrids. Int J Biol Sci. 14(11):1437–44. doi:10.7150/ijbs.27043.
- Kim JY, Hwang JM, Ko HS, Seong MW, Park BJ, Park SS. 2005. Mitochondrial DNA content is decreased in autosomal dominant optic atrophy. Neurology. 64(6):966–72. doi:10.1212/01.WNL.0000157282.76715.B1.
- McLelland GL, Goiran T, Yi W, Dorval G, Chen CX, Lauinger ND, Krahn AI, Valimehr S, Rakovic A, Rouiller I, et al. Mfn2 ubiquitination by PINK1/parkin gates the p97-dependent release of ER from mitochondria to drive mitophagy. Elife. 2018;7:e32866.
- Liao C, Ashley N, Diot A, Morten K, Phadwal K, Williams A, Fearnley I, Rosser L, Lowndes J, Fratter C, et al. Dysregulated mitophagy and mitochondrial organization in optic atrophy due to OPA1 mutations. Neurology. 2017;88(2):131–42. doi:10.1212/WNL.0000000000003491.
- Zimmermann M, Reichert AS. 2017. How to get rid of mitochondria: crosstalk and regulation of multiple mitophagy pathways. Biol Chem. 399(1):29–45. doi:10.1515/hsz-2017-0206.
- Xiao B, Goh JY, Xiao L, Xian H, Lim KL, Liou YC. Reactive oxygen species trigger Parkin/PINK1 pathway-dependent mitophagy by inducing mitochondrial recruitment of Parkin. J Biol Chem. 2017 Oct 6;292(40):16697–708. doi:10.1074/jbc.M117.787739.
- Lee H, Yoon Y. 2018. Mitochondrial membrane dynamics-functional positioning of OPA1. Antioxidants (Basel). 7(12):186. doi:10.3390/antiox7120186.
- Millet AM, Bertholet AM, Daloyau M, Reynier P, Galinier A, Devin A, Wissinguer B, Belenguer P, Davezac N. 2016. Loss of functional OPA1 unbalances redox state: implications in dominant optic atrophy pathogenesis. Ann Clin Transl Neurol. 3(6):408–21. doi:10.1002/acn3.305.
- Kushnareva Y, Seong Y, Andreyev AY, Kuwana T, Kiosses WB, Votruba M, Newmeyer DD. Mitochondrial dysfunction in an Opa1(Q285STOP) mouse model of dominant optic atrophy results from Opa1 haploinsufficiency. Cell Death Dis. 2016;7(7):e2309. doi:10.1038/cddis.2016.160.
- Chun BY, Rizzo JF 3rd. 2016. Dominant optic atrophy: updates on the pathophysiology and clinical manifestations of the optic atrophy 1 mutation. Curr Opin Ophthalmol. 27(6):475–80. doi:10.1097/ICU.0000000000000314.
- Spiegel R, Saada A, Flannery PJ, Burte F, Soiferman D, Khayat M, Eisner V, Vladovski E, Taylor RW, Bindoff LA, et al. Fatal infantile mitochondrial encephalomyopathy, hypertrophic cardiomyopathy and optic atrophy associated with a homozygous OPA1 mutation. J Med Genet. 2016;53(2):127–31. doi:10.1136/jmedgenet-2015-103361.
- Del Dotto V, Fogazza M, Musiani F, Maresca A, Aleo SJ, Caporali L, La Morgia C, Nolli C, Lodi T, Goffrini P, et al. Deciphering OPA1 mutations pathogenicity by combined analysis of human, mouse and yeast cell models. Biochim Biophys Acta Mol Basis Dis. 2018;1864(10):3496–514. doi:10.1016/j.bbadis.2018.08.004.
- Zhang J, Liu X, Liang X, Lu Y, Zhu L, Fu R, Ji Y, Fan W, Chen J, Lin B, et al. A novel ADOA-associated OPA1 mutation alters the mitochondrial function, membrane potential, ROS production and apoptosis. Sci Rep. 2017;7(1):5704. Published 2017 Jul 18. doi:10.1038/s41598-017-05571-y.
- Olichon A, Landes T, Arnauné-Pelloquin L, Emorine LJ, Mils V, Guichet A, Delettre C, Hamel C, Amati-Bonneau P, Bonneau D, et al. Effects of OPA1 mutations on mitochondrial morphology and apoptosis: relevance to ADOA pathogenesis. J Cell Physiol. 2007;211(2):423–30. doi:10.1002/jcp.20950.
- Gegg ME, Cooper JM, Chau KY, Rojo M, Schapira AH, Taanman JW. 2010. Mitofusin 1 and mitofusin 2 are ubiquitinated in a PINK1/parkin-dependent manner upon induction of mitophagy. Hum Mol Genet. 19(24):4861–70. doi:10.1093/hmg/ddq419.