
 ?Mathematical formulae have been encoded as MathML and are displayed in this HTML version using MathJax in order to improve their display. Uncheck the box to turn MathJax off. This feature requires Javascript. Click on a formula to zoom.
ABSTRACT
Slowed processing speed is part of normal aging but also a symptom of many diseases, including dementia. A Quick Test of Cognitive Speed (AQT) consists of three conditions: color naming (AQT1), form naming (AQT2) and dual color-form naming (AQT3) and offers a user-friendly assessment of processing speed that is used internationally to identify cognitive impairment in elderly patients. Appropriate age-norms have however been lacking. This study provides regression-based norms derived from a Swedish sample of 158 cognitively healthy 80 to 94-year olds. The results show age effects in all three conditions, a non-linear education effect in AQT1, and age by gender interactions in AQT2 and AQT3: men performed worse with increasing age, but women remained on a par. However, irrespective of age and gender, AQT2 and AQT3 mean raw and predicted scores were slower than the hitherto recommended cutoff criteria for suspected cognitive impairment.
Introduction
There is an increasing demand for high-sensitivity cognitive screening instruments that can detect subtle declines associated with mild cognitive impairment (MCI), incipient dementia and other health conditions affecting the elderly (Mitchell & Malladi, Citation2010). Tests that are highly sensitive to disease-related cognitive decline tend however to be equally sensitive to factors such as education, cultural background, and aging per se (Hebben & Milberg, Citation2009). This dilemma poses high demands on the availability of adequate normative data for elderly samples, an area in which much work remains to be done. The current study contributes to that work by presenting hitherto lacking age-norms for 80 to 94-year olds on a test of processing speed with proven clinical utility, A Quick Test of Cognitive Speed (AQT; Wiig et al., Citation2002b).
Processing speed is a broad concept, basically determined by speed of neural transmission within and between brain networks. Like attention, processing speed is typically measured in relation to some timed task, the performance of which requires task-specific combinations of perceptual, motor, and/or cognitive operations that cannot be easily disentangled. Reduced speed in one or all of the required operations, which also affects the necessary ability to rapidly carry them out simultaneously, sets a ceiling to performance (Salthouse, Citation1996). Generalized slowing of processing speed has been put forth as a primary mechanism for age-related cognitive change, affecting higher order abilities (Finkel et al., Citation2007; Salthouse, Citation1996). Links between white matter damage, reduced processing speed and functional decline are seen in normal aging (Classon et al., Citation2016; Lu et al., Citation2013; Makizako et al., Citation2015; Venkatraman et al., Citation2011), but accelerated slowing may be an early marker of degenerative disease (Lezak et al., Citation2012) and often one of the most prominent symptoms in neurocognitive disorders such as vascular dementia, dementia with Lewy bodies and Parkinson´s disease dementia. It is also an indication for treatment of cardiovascular risk factors (Venkatraman et al., Citation2011), which may in turn reduce risk of dementia (O’Brien & Thomas, Citation2015). The lack of items assessing processing speed and executive functions in the Mini-Mental State Examination (MMSE; Folstein et al., Citation1975), still the most used cognitive screen, has been criticized over the years. This is however a disadvantage it shares with the majority of screening tests used in the elderly population (Cullen et al., Citation2007) and one reason why cognitive decline might remain undetected. Sensitivity in primary care dementia investigations can, for example, be improved by complementing the MMSE with AQT (Kvitting et al., Citation2013).
AQT is a test that has the advantage of being short and easy to administer and interpret with minimal training and an outcome measure, time in seconds, sensitive enough to capture discreet changes without floor or ceiling effects. It consists of three continuous performance rapid automatized naming (RAN) conditions, where the first two are single dimension (naming of color, naming of form), and the third dual dimension (naming of both color and form). Seemingly simple, efficient rapid automatized naming – mainly examined in children – has been proposed to require swift and precisely timed synchronization and integration of a combination of visual-verbal, attentional and executive processes, along with motor response preparation and activation (Cutting & Denckla, Citation2001; Norton & Wolf, Citation2012). The few brain imaging studies that have examined neural correlates of RAN have found activations in networks related to control of eye movements, attention and reading, including areas associated with motor planning, semantic access and articulation (Cummine et al., Citation2015; Misra et al., Citation2004). Dual dimension conditions puts additional demands on co-articulation, working memory and set shifting (Norton & Wolf, Citation2012; Wiig et al., Citation2005).
There are virtually no AQT practice effects, test–retest reliability is high (Humes et al., Citation2013) and cultural bias reportedly low (Dsurney, Citation2007; Takahashi et al., Citation2012; Wiig et al., Citation2002a) although differences in syllable length across languages, and thereby naming speeds, motivate language-specific norms (Wiig & Al-Halees, Citation2013). Literacy is not required even if it facilitates performance (Nielsen & Wiig, Citation2006) and correlations with educational levels beyond 8 years of schooling are typically low, but not in all samples (Nielsen & Wiig, Citation2006; Petrazzuoli et al., Citation2014; Takahashi et al., Citation2012; Wiig & Al-Halees, Citation2013).
No gender effects have been reported (Nielsen & Wiig, Citation2006; Petrazzuoli et al., Citation2014; Subirana-Mirete et al., Citation2014; Wiig et al., Citation2007) but age has consistently been associated with decreasing AQT performance, as would be expected in a measure of processing speed. The effect has been described as small, in the range of 1 to 6 s/decade depending on task and sample (Nielsen & Wiig, Citation2006; Subirana-Mirete et al., Citation2014; Wiig et al., Citation2007). Slowed AQT performance has been associated with cortical thinning in occipital and parieto-temporal cortical areas, reduced parieto-temporal regional cerebral blood flow and reduced connectivity in posterior networks (Jalakas et al., Citation2019; Park et al., Citation2018; Warkentin et al., Citation2008).
With respect to neurodegenerative disorders, AQT has been found to: correlate with other dementia screens but have higher sensitivity; help predict conversion to dementia; discriminate between dementia and normal aging as well as between different types of dementia; and be useful in evaluating treatment effects of cholinesterase inhibitors or Memantine (Aarsland et al., Citation2009; Andersson et al., Citation2007; Jalakas et al., Citation2019; Kvitting et al., Citation2013; Palmqvist et al., Citation2010; Park et al., Citation2018; Takahashi et al., Citation2012). In studies on cardiovascular disease, AQT has proven sufficiently sensitive to capture subtle differences in processing speed associated with diabetes and cardiovascular disease (Dybjer et al., Citation2018; Nilsson et al., Citation2016, Citation2014; Tufvesson et al., Citation2013).
AQT performance in normal aging beyond the seventies is however sparsely examined. To our knowledge there are only three normative studies that have included individuals at or above the age of 80 (Petrazzuoli et al., Citation2014; Subirana-Mirete et al., Citation2014; Wiig et al., Citation2007), but in each case as part of a single, wide age-range group (above 59, 70 and 75 years, respectively), suggesting few elderly participants. This is specified in the study by Wiig et al. (Citation2007) which included only three individuals older than 85 years. Collapsing participants across wide age-ranges, typically with considerably fewer old-old (85 years and upwards) than younger participants in the oldest age-group, is common in normative studies but should raise concerns. There is good evidence that age-related declines in cognitive abilities, perhaps particularly processing speed, proceeds and accelerates with advancing age (Bäckman et al., Citation2004; Cohen-Mansfield et al., Citation2013; McCarrey et al., Citation2016; Small et al., Citation2011). Calculating normative trajectories for the old-old based on findings from younger age groups is therefore associated with a risk of overestimating expected performance. Because AQT is currently used in dementia investigations and other examinations of cognitive health that increasingly involve old-old individuals, this may entail consequences for the individual patient. That said, two of the three norming studies conducted so far (Petrazzuoli et al., Citation2014; Wiig et al., Citation2007) generally agree with the recommended cutoffs for risk of cognitive impairment at 35s for the single-dimension tasks, and 70s for the dual-dimension task, irrespective of age (Wiig et al., Citation2005). But the mean values and standard deviation reported in Subirana-Mirete et al. (Citation2014) rather indicate that these cutoffs are within the range of normal performance in cognitively healthy individuals over 60 years of age.
To summarize, AQT is an interesting tool for evaluation of cognitive impairment in the elderly over broad populations and health conditions, as well as for examining disease progression and treatment outcomes. Age-norms of adequate quality and resolution for individuals above their seventies have however been lacking. The purpose of the current study was to present updated, regression-based, AQT norms for a sample of cognitively healthy Swedish community-dwelling 80 to 94-year olds.
Materials and methods
The data reported below were collected as part of a larger normative study, including two additional cognitive tests: the Montreal Cognitive Assessment (MoCA; Nasreddine et al., Citation2005) and Cognistat (Kiernan et al., Citation1987). Results on those will be reported separately for the sake of clarity and readability.
Participants and procedure
A total of 987 mail invitations were sent to a pseudo-randomized selection of Linköping county inhabitants, evenly distributed over gender and age group (80–84 years, 85–89 years, and 90–94 years), acquired from the Swedish population registry. Of these, 218 agreed to a structured telephone interview conducted by experienced staff members at the Linköping university hospital memory clinic. The questions covered living condition, health status, cognitive functioning, sensory and motor functioning, Swedish language proficiency if other native tongue, and consent to supplement the self-reported information with that of medical records (diagnoses). Exclusion criteria were MCI, dementia, or other known cognitive deficit (e.g., following stroke or other neurological or non-neurological disorder), current substance abuse or ongoing moderate-to-severe psychiatric illness. Impaired perceptual or motor ability or lack of knowledge in the Swedish language were also grounds for exclusion if judged to entail non-valid test results.
The health conditions covered by the interview and medical records search were current or previous substance dependency or neurocognitive, cerebrovascular, neurological, psychiatric, or other (e.g., chronic obstructive pulmonary disease (COPD), thyroid or kidney disorders) disease. Note that, apart from ongoing moderate-to-severe psychiatric illness or substance dependency, presence of one or more of these health conditions was accepted, unless coupled with evidence of subjective or objective cognitive decline. The purpose was to enroll representatives of the general cognitively healthy elderly population but with information about their health condition. Individuals with a verified stroke or intracranial hemorrhage within the last 5 years were however consistently excluded.
Eligible participants (n = 181) completed a 1.5-hour visit at the Linköping university hospital memory clinic, in a quiet and well-lit room. Participants with glasses and/or hearing aids were instructed to bring them and use them under the session, help with settings was provided if needed. The test leader, one of five experienced staff members engaged in the project, collected written informed consent and conducted a structured interview concerning educational and vocative attainment. This was followed by administration of the study tests, always beginning with AQT, and followed by the MMSE, the MoCA and Cognistat in counterbalanced order. After a coffee break, the questionnaires ended the session. Test leaders were not blind to participant age.
To further ensure that only cognitively healthy participants were included, the 23 individuals who scored below 26p on the MMSE (Kvitting et al., Citation2019) and/or above 9p on the PHQ-9 self-rating scale of depression, corresponding to more than mild depressive symptoms (Kroenke et al., Citation2001), were exempted from further analyses. These individuals did not differ from the included participants in gender, age, or years of education, but they performed on average around 20s slower (worse) in each AQT condition (UAQT1 = 2921, z= 4.70, p< 0.001; UAQT2 = 2752, z= 4.00, p< 0.001; UAQT3 = 2927, z= 4.73, p< 0.001).
To summarize, cognitive health was assessed by telephone interview, medical records search, MMSE >25p, PHQ-9 < 9p and clinical assessment. Please see for a detailed description of recruitment, drop-out and exclusion.
Figure 1. Flow-chart of recruitment, drop-out and exclusion
The final set of 158 participants were evenly distributed over gender, mean age was 85 and they had in average 11 years of education. Three participants were not native Swedish speakers but had lived 57–71 years in this country and spoke Swedish fluently. More detailed demographic information about the participants and their health status are listed in and .
Table 1. Demographic information and AQT performance divided by age group, by gender, and in total. Presented as mean, SD or number, (%)
Table 2. Health status in terms of conditions diagnosed in medical records, divided by age group, by gender, and in total
Measurements
AQT
AQT consists of three rapid automatized naming conditions (hereafter called AQT1-3) that were administered according to the manual (Wiig et al., Citation2005). Thus, each condition was preceded by a short practice trial to ensure ability to accurately identify and name all stimuli (colors and forms) appearing in the task. The actual test stimuli were then presented on a laminated test plate containing 40 stimuli in eight rows of five. In AQT1 the stimuli are blue, yellow, red, and black squares (green is not included to allow for red-green color blindness), in AQT2 they are black lines, squares, triangles and circles, and in AQT they are combinations of the colors and forms of the previous conditions (e.g., blue line, red square, etc.). Before each condition, participants were instructed to name the color, the form, or the color-form combination (in that order) as quickly and accurately as possible, from left to right and top to bottom as in reading. A digital stopwatch was used for timing, starting the moment the participant began naming the first item and stopping the moment the last item was named. The entire test takes approximately 10 minutes to perform and the score is time in seconds to complete each condition. Errors were recorded but not further analyzed in line with the typical procedure for RAN tasks (Norton & Wolf, Citation2012).
Background variables
The revised Swedish version of the MMSE, MMSE-SR (Palmqvist et al., Citation2013), was used as a screen of global cognitive functioning. It consists of 20 items assessing orientation to time and place, memory, attention, language, and visuospatial ability. It yields a total score ranging from 0 to 30 with lower scores denoting more impaired cognition. Self-rated depressive symptoms were assessed using PHQ-9 (Kroenke et al., Citation2001), a short version of the Patient Health Questionnaire (Spitzer et al., Citation1999). Frequency of nine depressive symptoms over the past two weeks are reported together with an assessment of how symptoms have affected everyday life. Self-reported independence in 10 everyday activities was assessed by the Functional Activities Questionnaire (FAQ; Pfeffer et al., Citation1982). Summed total score, max 30p with higher scores denoting less independence, was used for analyses. The EQ-5D (EuroQolGroup, Citation1990) is a self – report inventory designed to measure health outcome. It includes a visual analog scale (EQ-VAS) that was used to assess self-rated health. The scale runs from 100 (“Best imaginable health state”) to 0 (“Worst imaginable health state”). Vision was not objectively measured but roughly coded into three categories based on unstructured self-reports of function with the correction normally used: fair (generally experiencing that vision is not a problem in everyday life), intermediate (experiencing visual problems not adequately compensated for by glasses), and poor (experiencing vision as a problem in everyday life that glasses cannot compensate for).
Statistical analyses
All statistics were conducted using the IBM SPSS Statistics version 25.0 software. Demographic variables and gender differences were analyzed using independent samples T-tests, general linear models (GLMs) followed-up by Bonferroni post hoc, Chi2 tests, Mann–Whitney U-test or Kruskal–Wallis tests, followed-up by Bonferroni post hoc, as applicable. The level of significance was set at two-tailed p= 0.05.
Separate multiple linear regression analyses were conducted to obtain predicted scores corrected for demographic factors for each AQT condition. AQT performance (time in s), was regressed on candidate lower-order and higher-order predictors: age, years of education and gender; age2 and all two-way interactions. Gender was coded as female = 1 and male = 0. To avoid multicollinearity, age and years of education were centered (i.e., individual age – mean age of entire sample rounded to integer) before computing age2 and the interaction terms. Additionally, to explore a potential nonlinear effect of education, a second set of regressions were computed replacing linear education by nonlinear education (1/years of education). When this resulted in a new model, the model with nonlinear education was retained if it increased predictive capacity (R2) and visual inspection confirmed the improved fit of the model on the data (Bergman et al., Citation2016).
All regressions were conducted using the backwards selection model with p-to-remove set at >0.1. Lower-order predictors that were included in higher-order predictors of the final model were forced back into the model. Regression assumptions were checked by inspection of the distributions and normal probability plots of the residuals, intercorrelations, computation of tolerance and variance inflation factor (VIF). Tolerance should not be lower than 0.2 and VIF should not exceed 10 (Bowerman & O´Connell, Citation1990; Menard, Citation1995). Influential outliers were identified by visual inspection, computation of Cook´s distances (Di) and SDs from mean results. Homoscedasticity was assessed by visual inspection of plots of standardized predicted values and unstandardized residuals and by applying Levene’s tests to the residuals divided into tertiles. The unstandardized residuals measure the vertical distance between each raw score and the regression equation line, i.e., the positive or negative deviation between each individual raw score and it´s corresponding predicted score. The SDs of the residuals are thus measures of the present sample´s normal distributions of variances around the predicted scores, within which the relative deviations of individual raw scores can be defined. Homoscedasticity is violated when residual variance differs across the regression equation line (aging is for example, associated with worse cognitive performance and increasing individual variance, hence residual variance may be larger around higher than lower predicted values). This needs to be considered when computing normative values by using the residual SD for each tertile. If homoscedasticity is not violated, the same SD can be used for all cases (please see a detailed description of how to compute individual AQT norms below, section Application of the normative model to individual raw scores).
Ethics
All participants gave their written informed consent. The study procedure was approved by the Research Ethics Committee of Linköping University, Sweden (D.nr 2016/394-31), and conducted according to the Helsinki Declaration.
Results
AQT performance and demographics
AQT raw score performance and demographics are detailed in and health conditions diagnosed in medical records are presented in (see also Supplementary materials where scores fully stratified by age and gender are presented in Table S1 and traditional norms in Table S2). It should also be noted that there were no test leader effects in either AQT condition. A few comments are that AQT2 and AQT3 mean raw performances were slower than the hitherto recommended cutoff criteria for suspected cognitive impairment at 35s and 70s: 66% and 57%, respectively, performed below cutoff in these conditions. Functional independence declined with age but depressive symptoms, self-rated health and frequency, as well as number, of diagnosed health conditions where generally similar across age groups and genders. As expected at these high ages, the majority had at some time received a cardiovascular diagnosis, most commonly hypertension. There were some substantial overlaps where, for example, 50 (32%) of those with hypertension also had hyperlipidemia. Analyses examining whether either specific diagnosis impacted AQT performance showed that presence of hypertension or heart disease had significant effects but only on AQT1 (hypertension: U= 3466, z= 2.04, p= 0.041; heart disease: U= 3805, z= 2.51, p= 0.012), slowing down processing speed with 2–3s. As noted, sensory function was not objectively measured but some degree of visual impairment was ubiquitous. Compared to those with “fair” vision, those with “intermediate” vision were in average 0–6s slower, and those with “poor” vision 4–8s slower, depending on AQT condition. Due to the small number of participants with “poor” vision, two categories: “fair” and “intermediate-poor” were created for statistical analyses. These found no significant differences in AQT1 or AQT2 performance but those with poorer vision were slower in AQT3 (Mfair = 73.88, Mintermediate-poor = 80.23; t(156) = −2.10, p= 0.038).
Regression-based normative data
The final regression models are presented in . Note that for AQT2, the backwards selection resulted in a model including only age and an age by gender interaction, but shows the results when gender was forced back into the model. Multicollinearity was well within recommended levels, tolerance was ≥0.52 and VIF ≤1.95. There were however two influential outlier scores in AQT1, representing the only raw scores >5 SD above the mean and with DIs of 0.596 and 0.278. These two scores were excluded which improved model fit as assessed by visual inspection and R2 (please see Figures S1 and S2 for plots and regression diagnostics). Homoscedasticity, as assessed by Levene’s Test, could be assumed for the residuals of the AQT1 and AQT2 models (p≥ 0.215), but not for the AQT3 model (p= 0.008). This violated homoscedasticity was however not confirmed by visual inspection of residuals and predicted scores. The small difference could be inflated by the unequal group sizes of the tertiles of predicted scores: one very large group with 111 individuals and two very small groups with 19 to 21 individuals. Instead of splitting the participants in arbitrary groups and calculate separate SD values, it was decided to continue with one SD value for each of the models. The SDs of the residuals are 5.939 for AQT1, 7.850 for AQT2, and 17.898 for AQT3.
Table 3. Final regression models for AQT performance
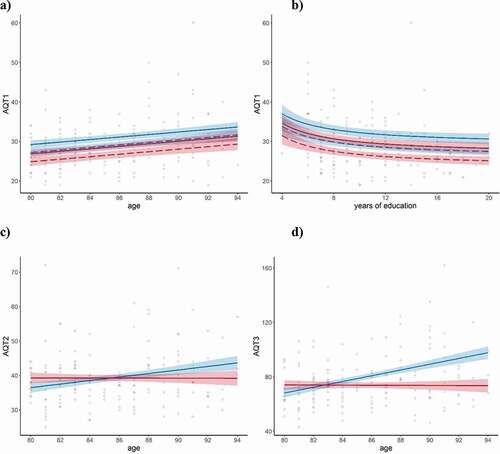
The regressions showed that years of education reached significance as a predictor for AQT1 performance only (although there was also a significant correlation between years of education and AQT3, r= −0.17, p< 0.05). Nonlinear education provided a better fit than linear, reflecting a positive effect of the first 8–10 years of attained education but with little additional benefit thereafter (please see : b). For AQT1 there were also effects of linear age and gender, with B-values indicating a consistent 2s advantage for women together with a general slowing with increasing age for both genders, corresponding to around 3s per decade (see : a). Significant effects of linear age were also found for AQT2 and AQT3, with B-values indicating around 5s and 20s slower performance per decade and condition, but together with an age by gender interactions of similar size: at 80, men were faster than women, but their performance declined with age, while that of women remained on a par. After the age of around 85 for AQT2 and 83 for AQT3 males therefore performed worse than females (: c and d).
Figure 2. Normative models displaying effects of age, education, and gender
As shown by , there were no obvious demographic explanation for these different trajectories. Women had fewer years of education (t(156) = 3.1, p= 0.036) and were more inflicted by thyroid disease (X2(1) = 16.99, p< 0.001), factors that would rather have put them at a disadvantage. Diseases could become disproportionately more common in men than in women with increasing age, and demographic factors could vary as a function of gender and age group, potentially explaining the age by gender interactions. This was however not supported by the data. There was no age group by gender interactions in years of education, global cognition, number of diagnoses, self-rated depressive symptoms, health, or functional ability. Examination of gender distribution of hypertension and heart disease (i.e., the two conditions found to influence AQT results) or level of visual function (“fair” vs “intermediate-poor”) across age groups did not reveal emerging gender differences with age. As a final check, the same regression analyses as used for the AQT norms were repeated with MoCA and Cognistat, the other two cognitive tests performed by the same sample, as outcome variables. Neither of these regressions showed significant age by gender interactions (results not shown here), suggesting they are specific for AQT.
Application of the normative model to individual raw scores
To facilitate for clinicians, predicted AQT scores by age and gender are displayed in together with cutoffs for slower-than-typical performance (≥1 SD), suspected impairment (≥1.5 SD), and atypical/pathological performance (≥2 SD).
Table 4. Regression norms stratified by age and gender. As noted, there was a nonlinear effect of years of education in AQT1 and the predicted AQT1 scores below are computed for 11 years of education
Note that years of education is fixed at 11 years in the normative data. That doesn´t affect AQT2 or AQT3, for which no education effects were found, but needs to be considered for AQT1: if the test taker has less than 11 years of education (and particularly when 8 or fewer), computation of individual normative data using the two-step procedure presented below is recommended.
As explained in detail in Van Der Elst et al. (Citation2006), normative data for individual test takers can be computed from the regression parameters and, in combination with the SDs of the residuals, indicate this individual’s standardized deviation in performance compared to the norms. This requires a two-step procedure where the first step is to calculate the predicted score for the test taker (TT in the equations below) which is computed as:
The constants and B-values and their signs (±) to use are found in . The second step is to standardize the difference between the actual test result (raw score time in s) and the predicted score of the test taker:
As already noted, the SDs of residuals are 5.939 for AQT1, 7.850 for AQT2, and 17.898 for AQT3. For example, computation of normative AQT1 data for a male 91-year-old test taker with 6 years of education and a raw score of 45s:
A z-score of 1.84 lies between 1.5 and 2 SD above (slower than) average and thus in the range of suspected impairment. Had the same test taker had 11 years of education, shows that his score would have been more than 2 SD above average and thus in the range of pathological performance.
Discussion
Slowed processing speed is a natural part of normal aging, but also a symptom of many somatic or psychiatric disorders and, if accelerated, dementias. AQT offers a quick and user-friendly assessment of processing speed that is used internationally to differentiate between normal aging and cognitive impairment, also in patients above their seventies. Normative data for this age-group has however been lacking. The purpose of the present study was therefore to provide regression-based AQT norms for cognitively healthy 80 to 94-year olds. Results showed interacting effects of age and gender, with age-related slowing of processing speed in men but not in women in two of the three AQT conditions. The majority, irrespective of age and gender, also performed slower than the recommended cutoffs for suspected cognitive impairment in these conditions. Easy-to-use regression-based norms, stratified by age and gender, are provided in and the results are discussed in detail below.
The nonlinear effect of years of education on AQT1 performance only (although AQT3 performance also correlated with years of education) is in line with previous findings that AQT is relatively independent of education once a certain level of attainment, around 8–10 years of schooling, has been reached (Nielsen & Wiig, Citation2006; Petrazzuoli et al., Citation2014; Wiig & Al-Halees, Citation2013). Processing speed tends to be less influenced by education than other cognitive domains, supporting a closer relation to neurobiological function than to acquired skills (Lu et al., Citation2013; Tucker-Drob et al., Citation2009). White matter tract myelin content has for example been put forth as a predictor of healthy adults individual variability in processing speed (Chopra et al., Citation2018).
Age has consistently been linked to AQT performance and linear age effects were found for all three AQT conditions even in the restricted age range of old-old individuals presented here. Previous studies have suggested a 1–6s increase (worsening) in AQT performance per decade (Nielsen & Wiig, Citation2006; Subirana-Mirete et al., Citation2014; Wiig et al., Citation2007) but the present results indicate steeper performance declines, with 3–20 s increases per decade, in the old-old. In AQT2 and AQT3, this was however only true for men: while their performance decreased with increasing age, women continued to perform on a par.
AQT gender effects have not been previously reported but the literature is not very extensive. As noted, we´ve only found three previous publications of normative data that include individuals above their seventies. These cover Spanish (Subirana-Mirete et al., Citation2014), Italian (Petrazzuoli et al., Citation2014), and multi-ethnic American (Wiig et al., Citation2007) samples and present traditional norms for discrete age-groups, with the elderly collapsed across age-spans of around 20 years or more (e.g., 60 to 85-year olds) and gender differences only examined by comparison of means over the entire samples. We have found no studies examining similar RAN tasks during aging; they are predominantly studied in children and dyslexics due to their capacity to predict reading ability and typically use other stimuli, such as letters. There is however a well-documented female advantage in verbal ability and processing speed as measured by other instruments (Daseking et al., Citation2017; Gerstorf et al., Citation2011; Irwing, Citation2012; Siedlecki et al., Citation2019). McCarrey et al. (Citation2016) found gender-dependent aging trajectories with steeper rates of decline in men as compared to women in visuospatial abilities and perceptuomotor speed and integration. Because women did not show steeper rates of decline than men in any domain, the results were interpreted to indicate a greater female resilience to cognitive aging. Other studies have found similar results, including in processing speed and executive function (Ritchie et al., Citation2016; Schaie, Citation1994; Zaninotto et al., Citation2018; Zelinski & Stewart, Citation1998) although results are mixed (e.g., Reas et al., Citation2017). If gender-dependent trajectories may also be indexed by AQT remains to be confirmed in longitudinal studies.
Women were faster than men at all ages in AQT1, while men were faster than women up to the age of around 83 to 85 years of age in AQT2 and AQT3, but not thereafter. These differences between AQT conditions are interesting. Speculatively, the consistent female advantage in color naming could reflect the female advantage in verbal performance and processing speed discussed above. AQT2 and AQT3 include naming of geometrical forms, arguably more related to visuospatial ability and presumably facilitated by life-long experience with naming of geometric forms. Men typically perform better than women in tasks loading on visuospatial ability and are more likely to have had technical jobs than women in these age cohorts, potentially explaining their initial advantage in AQT2 and AQT3 and subsequent decline (cf McCarrey et al., Citation2016). But it should be remembered that the regression models could only account for 3.5% to 12.9% of the total variation in performance and gender differences in z-scores did not exceed 1.4 SD. Indeed, the relatively low proportion of variance explained by demographic factors suggest AQT primarily captures differences in cognitive functioning.
Average performances of the present sample (collapsed across age groups for comparability) are 1–10s slower on AQT1, 3–13s slower on AQT2, and 18–29s slower on AQT3 than those of the oldest age groups of earlier normative studies (Petrazzuoli et al., Citation2014; Subirana-Mirete et al., Citation2014; Wiig et al., Citation2007). However, mean age is 6–12 years higher than that of the oldest age groups in the Mediterranean studies (not reported in the American) and sample size is almost double that of the Spanish study, which included 90 individuals at or above 60 years of age and is the largest of the three in terms of elderly participants. The normative values for individuals older than 60 years of age presented by Subirana-Mirete et al. (Citation2014) show that the recommended cutoffs for suspected impairment are within their normal performance ranges (i.e., within +1SD from the mean). Average performance of both men and women in the present sample were also consistently slower (worse) than recommended cutoffs for AQT2 and AQT3, with more than 55% qualifying for suspected impairment. The 35s cutoff for AQT1 is close to the +1SD predicted score for 80-year olds in the current sample and is exceeded by in total 14% of the participants. Similar cutoffs for AQT2 and AQT3 at around +1SD from predicted scores, 45s and 85s, would be exceeded by 15% and 22% of the participants.
While reliable detection of MCI requires high sensitivity, adequate specificity is equally important for an instrument to be clinically useful. Demographically adjusted norms increase specificity by reducing the influence of factors that are not disease specific, but at the same time reduce sensitivity when the demographic factors adjusted for are also risk-factors for the disease in question (Strauss et al., Citation2006). Age is indeed the most important risk factor for MCI and dementia, supporting arguments against using demographically adjusted norms, particularly for screening purposes where the intention is to identify all individuals at risk. On the other hand, if non-adjusted criteria, such as the recommended AQT cutoffs, are used as part of dementia diagnostics or as a basis for referral for in-depth investigation in specialized care, then there is an evident risk for misdiagnoses and over-investigation. This is especially true for a test like AQT which has also proved sensitive to non-dementia diseases that increase with aging (Dybjer et al., Citation2018; Nilsson et al., Citation2016, Citation2014; Tufvesson et al., Citation2013). The present data suggest that adjustment of AQT cutoffs for the old-old could increase specificity while retaining sensitivity as compared to the MMSE. While diagnostic studies are required to find optimum criteria with respect to specific diseases, availability of appropriate age-norms for the old-old is essential for a balanced clinical interpretation of individual test scores.
RAN tasks such as AQT index speeded integration of multiple neural processes: visual-verbal, attentional and executive together with motor response preparation and activation (Norton & Wolf, Citation2012). Processing speed has been found to directly contribute to RAN in children, with rate of articulation playing a minor role (Cutting & Denckla, Citation2001). Although similar neural networks seem to be engaged in older as in younger individuals, aging could differentially affect subprocesses such as speed of articulation, verbal retrieval, attentional or executive processes. Differences in processing demands between the AQT conditions during aging are however yet to be fully investigated. For example, AQT3 naming times are not simply an additive of AQT1 and AQT2 naming times. A separate measure, AQT3-(AQT1+AQT2), has been suggested to evaluate cognitive efficiency or shift cost (Nielsen & Wiig, Citation2011, Citation2013) but age-related slowing of single dimension naming times apparently distort the ratio (Nielsen & Wiig, Citation2011). These are interesting question for future studies, together with exploration of associations between AQT and other neuropsychological measures as well as brain activations in normal aging.
Strengths of the present study include the pseudorandomized recruitment from the aging population together with the careful screen of health status including a medical records search. The sample size is large for the age-range and the use of regression-based, as compared to traditional, norms avoids problems with arbitrary age-bands and varying subsample sizes (Knight et al., Citation2006). There are also limitations: number of participants decrease with increasing age, reflecting the challenges of recruiting participants at or above their eighties. Further, exploration of biomarkers or follow-up testing to rule out incipient cognitive disease was beyond our scope and sample selectivity differences can never be ruled out in cross-sectional designs – the educational level of the present sample is, for example, relatively high. Combined with exclusion criteria that may be considered stringent (e.g., MMSE <26p), the present norms may also be considered stringent, especially for less advantaged populations.
Conclusion
AQT is a short and sensitive test of processing speed that is well tolerated by the old-old but performance declines with increasing age, particularly in males, and motivate the complementary use of age- and gender adjusted norms for individuals above their seventies. The normative values presented in the present paper will aid clinical interpretation of AQT performance in elderly patients.
Acknowledgments
We would like to thank the participants for their collaboration, sharing personal information and devoting their time and interest to this project. We would also like to thank our colleagues at the Linköping university hospital memory clinic for their enthusiastic help with recruitment and data collection.
Disclosure statement
No potential conflict of interest was reported by the author(s).
Additional information
Funding
References
- Aarsland, D., Ballard, C., Walker, Z., Bostrom, F., Alves, G., Kossakowski, K., Leroi, I., Pozo-Rodriguez, F., Minthon, L., & Londos, E. (2009). Memantine in patients with Parkinson’s disease dementia or dementia with Lewy bodies: A double-blind, placebo-controlled, multicentre trial. The Lancet Neurology, 8(7), 613–618. https://doi.org/10.1016/s1474-4422(09)70146-2
- Andersson, M., Wiig, E. H., Minthon, L., & Londos, E. (2007). A quick test for cognitive speed: A measure of cognitive speed in dementia with Lewy bodies. American Journal of Alzheimer’s Disease and Other Dementias, 22(4), 313–318. https://doi.org/10.1177/1533317507303198
- Bäckman, L., Wahlin, A., Small, B. J., Herlitz, A., Winblad, B., & Fratiglioni, L. (2004). Cognitive functioning in aging and dementia: The Kungsholmen Project. Aging, Neuropsychology, and Cognition, 11(2–3), 212–244. https://doi.org/10.1080/13825580490511099
- Bergman, I., Johansson, K., Almkvist, O., & Lundberg, C. (2016). Health-adjusted neuropsychological test norms based on 463 older Swedish car drivers. Scandinavian Journal of Psychology, 57(2), 93–107. https://doi.org/10.1111/sjop.12273
- Bowerman, B. L., & O´Connell, R. T. (1990). Linear statistical models: An applied approach (2 ed.). Duxbury.
- Chopra, S., Shaw, M., Shaw, T., Sachdev, P. S., Anstey, K. J., & Cherbuin, N. (2018). More highly myelinated white matter tracts are associated with faster processing speed in healthy adults. Neuroimage, 171, 332–340. https://doi.org/10.1016/j.neuroimage.2017.12.069
- Classon, E., Fällman, K., Wressle, E., & Marcusson, J. (2016). Relations between concurrent longitudinal changes in cognition, depressive symptoms, self-rated health and everyday function in normally aging octogenarians. Plos One, 11(8), e0160742. https://doi.org/10.1371/journal.pone.0160742
- Cohen-Mansfield, J., Shmotkin, D., Blumstein, Z., Shorek, A., Eyal, N., Hazan, H., & Team, C. (2013). The old, old-old, and the oldest old: Continuation or distinct categories? An examination of the relationship between age and changes in health, function, and wellbeing. The International Journal of Aging and Human Development, 77(1), 37–57. https://doi.org/10.2190/AG.77.1.c
- Cullen, B., O’Neill, B., Evans, J. J., Coen, R. F., & Lawlor, B. A. (2007). A review of screening tests for cognitive impairment. Journal of Neurology, Neurosurgery, and Psychiatry, 78(8), 790–799. https://doi.org/10.1136/jnnp.2006.095414
- Cummine, J., Chouinard, B., Szepesvari, E., & Georgiou, G. (2015). An examination of the rapid automatized naming–reading relationship using functional magnetic resonance imaging. Neuroscience, 305, 49–66. https://doi.org/10.1016/j.neuroscience.2015.07.071
- Cutting, L. E., & Denckla, M. B. (2001). The relationship of rapid serial naming and word reading in normally developing readers: An exploratory model. Reading and Writing, 14(7–8), 673–705. https://doi.org/10.1023/a:1012047622541
- Daseking, M., Petermann, F., & Waldmann, H.-C. (2017). Sex differences in cognitive abilities: Analyses for the German WAIS-IV. Personality and Individual Differences, 114, 145–150. https://doi.org/10.1016/j.paid.2017.04.003
- Dsurney, J. (2007). Test review: Alzheimer’s Quick Test: Assessment Of Parietal Lobe Function. Applied Neuropsychology, 14 (3), 232–233. https://doi.org/10.1080/09084280701509257.
- Dybjer, E., Nilsson, P. M., Engstrom, G., Helmer, C., & Nagga, K. (2018). Pre-diabetes and diabetes are independently associated with adverse cognitive test results: A cross-sectional, population-based study. Bmc Endocrine Disorders, 18(1), 1-10. https://doi.org/10.1186/s12902-018-0318-3
- EuroQolGroup. (1990). EuroQol: A new facility for the measurement of health-related quality of life. Health Policy, (16)(3), 199–208. https://doi.org/10.1016/0168-8510(90)90421-9
- Finkel, D., McArdle, J. J., Reynolds, C. A., & Pedersen, N. L. (2007). Age changes in processing speed as a leading indicator of cognitive aging. Psychology and Aging, 22(3), 558–568. https://doi.org/10.1037/0882-7974.22.3.558
- Folstein, M. F., Folstein, S. E., & McHugh, P. R. (1975). “Mini-Mental State”: A practical method for grading the cognitive state of patients for the clinician. Journal of Psychiatric Research, 12(3), 189–198. https://doi.org/10.1016/0022–3956(75)90026-6
- Gerstorf, D., Ram, N., Hoppmann, C., Willis, S. L., & Schaie, K. W. (2011). Cohort differences in cognitive aging and terminal decline in the seattle longitudinal study. Developmental Psychology, 47(4), 1026–1041. https://doi.org/10.1037/a0023426
- Hebben, N., & Milberg, W. (2009). Essentials of neuropsychological assessment (2nd ed.). John Wiley & Sons, Inc.
- Humes, L. E., Kidd, G. R., & Lentz, J. J. (2013). Auditory and cognitive factors underlying individual differences in aided speech-understanding among older adults. Frontiers in Systems Neuroscience, 7, 55. https://doi.org/10.3389/fnsys.2013.00055
- Irwing, P. (2012). Sex differences in g: An analysis of the US standardization sample of the WAIS-III. Personality and Individual Differences, 53(2), 126–131. https://doi.org/10.1016/j.paid.2011.05.001
- Jalakas, M., Palmqvist, S., Hall, S., Svard, D., Lindberg, O., Pereira, J. B., Van Westen, D., & Hansson, O. (2019). A quick test of cognitive speed can predict development of dementia in Parkinson’s disease. Scientific Reports, 9(1). https://doi.org/10.1038/s41598-019-51505-1
- Kiernan, R. J., Mueller, J., Langston, J. W., & Vandyke, C. (1987). The neurobehavioral cognitive status examination: A brief but differentiated approach to cognitive assessment. Annals of Internal Medicine, 107 (4), 481–485. https://doi.org/10.7326/0003-4819-107-4-481.
- Knight, R. G., McMahon, J., Green, T. J., & Skeaff, C. M. (2006). Regression equations for predicting scores of persons over 65 on the rey auditory verbal learning test, the mini-mental state examination, the trail making test and semantic fluency measures. British Journal of Clinical Psychology, 45(3), 393–402. https://doi.org/10.1348/014466505x68032
- Kroenke, K., Spitzer, R. L., & Williams, J. B. W. (2001). The PHQ-9 - Validity of a brief depression severity measure. Journal of General Internal Medicine, 16(9), 606–613. https://doi.org/10.1046/j.1525-1497.2001.016009606.x
- Kvitting, A. S., Fällman, K., Wressle, E., & Marcusson, J. (2019). Age-normative MMSE data for older persons aged 85 to 93 in a longitudinal Swedish cohort. Journal of the American Geriatrics Society, 1–5.
- Kvitting, A. S., Wimo, A., Johansson, M. M., & Marcusson, J. (2013). A quick test of cognitive speed (AQT): Usefulness in dementia evaluations in primary care. Scandinavian Journal of Primary Health Care, 31(1), 13–19. https://doi.org/10.3109/02813432.2012.751699
- Lezak, M. D., Howieson, D. B., Bigler, E. D., & Tranel, D. (2012). Neuropsychological assessment (5th ed.). Oxford University Press, Inc.
- Lu, P. H., Lee, G. J., Tishler, T. A., Meghpara, M., Thompson, P. M., & Bartzokis, G. (2013). Myelin breakdown mediates age-related slowing in cognitive processing speed in healthy elderly men. Brain and Cognition, 81(1), 131–138. https://doi.org/10.1016/j.bandc.2012.09.006
- Makizako, H., Shimada, H., Doi, T., Tsutsumimoto, K., Lee, S., Hotta, R., Nakakubo, S., Harada, K., Lee, S., Bae, S., Harada, K., & Suzuki, T. (2015). Cognitive functioning and walking speed in older adults as predictors of limitations in self-reported instrumental activity of daily living: Prospective findings from the obu study of health promotion for the elderly. International Journal of Environmental Research and Public Health, 12(3), 3002–3013. https://doi.org/10.3390/ijerph120303002
- McCarrey, A. C., An, Y., Kitner-Triolo, M. H., Ferrucci, L., & Resnick, S. M. (2016). Sex differences in cognitive trajectories in clinically normal older adults. Psychology and Aging, 31(2), 166–175. https://doi.org/10.1037/pag0000070
- Menard, S. (1995). Applied logistic regression analysis. Sage.
- Misra, M., Katzir, T., Wolf, M., & Poldrack, R. A. (2004). Neural systems for rapid automatized naming in skilled readers: Unraveling the RAN-reading relationship. Scientific Studies of Reading, 8(3), 241–256. https://doi.org/10.1207/s1532799xssr0803_4
- Mitchell, A. J., & Malladi, S. (2010). Screening and case finding tools for the detection of dementia. Part I: Evidence-based meta-analysis of multidomain tests. American Journal of Geriatric Psychiatry, 18(9), 759–782. https://doi.org/10.1097/JGP.0b013e3181cdecb8
- Nasreddine, Z. S., Phillips, N. A., Bedirian, V., Charbonneau, S., Whitehead, V., Collin, I., Cummings, J. L., & Chertkow, H. (2005). The montreal cognitive assessment, MoCA: A brief screening tool for mild cognitive impairment. Journal of the American Geriatrics Society, 53(4), 695–699. https://doi.org/10.1111/j.1532-5415.2005.53221.x
- Nielsen, N. P., & Wiig, E. H. (2006). Alzheimer’s quick test cognitive screening criteria for West African speakers of Krio. Age and Ageing, 35(5), 503–507. https://doi.org/10.1093/ageing/afl058
- Nielsen, N. P., & Wiig, E. H. (2011). An additive model for relations between AQT single- and dual-dimension naming speed. Perceptual and Motor Skills, 112(2), 499–508. https://doi.org/10.2466/22.27.Pms.112.2.499-508
- Nielsen, N. P., & Wiig, E. H. (2013). Validation of the AQT color-form additive model for screening and monitoring pharmacological treatment of ADHD. Journal of Attention Disorders, 17(3), 187–193. https://doi.org/10.1177/1087054711428075
- Nilsson, E. D., Elmstahl, S., Minthon, L., Nilsson, P. M., Pihlsgard, M., & Nagga, K. (2016). Associations of central and brachial blood pressure with cognitive function: A population-based study. Journal of Human Hypertension, 30(2), 95–99. https://doi.org/10.1038/jhh.2015.33
- Nilsson, E. D., Elmstahl, S., Minthon, L., Nilsson, P. M., Pihlsgard, M., Tufvesson, E., & Nagga, K. (2014). Nonlinear association between pulse wave velocity and cognitive function: A population-based study. Journal of Hypertension, 32(11), 2152–2157. https://doi.org/10.1097/hjh.0000000000000329
- Norton, E. S., & Wolf, M. (2012). Rapid automatized naming (RAN) and reading fluency: Implications for understanding and treatment of reading disabilities.
- O’Brien, J. T., & Thomas, A. (2015). Vascular dementia. The Lancet, 386 (10004), 1698–1706. https://doi.org/10.1016/S0140-6736(15)00463-8.
- Palmqvist, S., Minthon, L., Wattmo, C., Londos, E., & Hansson, O. (2010). A Quick Test of cognitive speed is sensitive in detecting early treatment response in Alzheimer’s disease. Alzheimers Research & Therapy, 2(5), 29. https://doi.org/10.1186/alzrt53
- Palmqvist, S., Terzis, B., Strobel, C., & Wallin, A. (2013). MMSE-SR manual version 2.0. http://www.demenscentrum.se/globalassets/arbeta-med-demens_bild/skalor_instrument/mmse-sr-manual-2-0.pdf
- Park, S., Suyeon, P., Seong, A. S., Yeon, L. J., Kyeong, K. Y., Hyeon-Ju, P., Park, L., Lee, J.-Y., & Jun-Young, J.-H. (2018). A quick test of cognitive speed in older adults with Alzheimer’s disease and mild cognitive impairment: A preliminary behavioral and brain imaging study. Psychiatry Research-Neuroimaging, 280, 30–38. https://doi.org/10.1016/j.pscychresns.2018.08.004
- Petrazzuoli, F., Palmqvist, S., Thulesius, H., Buono, N., Pirrotta, E., Cuffari, A., Cambielli, M., D’Urso, M., Farinaro, C., Chiumeo, F., Marsala, V., & Wiig, E. H. (2014). A quick test of cognitive speed: Norm-referenced criteria for 121 Italian adults aged 45 to 90 years. International Psychogeriatrics, 26(9), 1493–1500. https://doi.org/10.1017/s1041610214000787
- Pfeffer, R. I., Kurosaki, T. T., Harrah, C. H., Chance, J. M., & Filos, S. (1982). Measurement of functional activities in older adults in the community. Journal of Gerontology, 37(3), 323–329. https://doi.org/10.1093/geronj/37.3.323
- Reas, E. T., Laughlin, G. A., Bergstrom, J., Kritz-Silverstein, D., Barrett-Connor, E., & McEvoy, L. K. (2017). Effects of sex and education on cognitive change over a 27-year period in older adults: The Rancho Bernardo study. American Journal of Geriatric Psychiatry, 25(8), 889–899. https://doi.org/10.1016/j.jagp.2017.03.008
- Ritchie, S. J., Tucker-Drob, E. M., Cox, S. R., Corley, J., Dykiert, D., Redmond, P., Pattie, A., Taylor, A. M., Sibbett, R., Starr, J. M., & Deary, I. J. (2016). Predictors of ageing-related decline across multiple cognitive functions. Intelligence, 59, 115–126. https://doi.org/10.1016/j.intell.2016.08.007
- Salthouse, T. A. (1996). The processing-speed theory of adult age differences in cognition. Psychological Review, 103(3), 403–428. https://doi.org/10.1037/0033-295x.103.3.403
- Schaie, K. W. (1994). The course of adult intellectual development. American Psychologist, 49(4), 304–313. https://doi.org/10.1037/0003-066x.49.4.304
- Siedlecki, K. L., Falzarano, F., & Salthouse, T. A. (2019). Examining gender differences in neurocognitive functioning across adulthood. Journal of the International Neuropsychological Society, 25(10), 1051–1060. https://doi.org/10.1017/s1355617719000821
- Small, B. J., Dixon, R. A., & McArdle, J. J. (2011). Tracking cognition-health changes from 55 to 95 years of age. Journals of Gerontology Series B-Psychological Sciences and Social Sciences, 66(Suppl. 1), 153–161. https://doi.org/10.1093/geronb/gbq093
- Spitzer, R. L., Kroenke, K., & Williams, J. B. W. (1999). Patient health questionnaire study group. Validity and utility of a self-report version of PRIME-MD: The PHQ primary care study. Journal of the American Medical Association, 282(18), 1737–1744. https://doi.org/10.1001/jama.282.18.1737
- Strauss, E., Sherman, E. M. S., & Spreen, O. (2006). A compendium of neuropsychological tests: Administration, norms, and commentary (3rd ed.). Oxford University Press.
- Subirana-Mirete, J., Bruna, O., Virgili, C., Signo, S., & Palma, C. (2014). Processing speed in the aging process: Screening criteria for the spanish quick test of cognitive speed. Perceptual and Motor Skills, 119(2), 417–429. https://doi.org/10.2466/22.PMS.119c22z2
- Takahashi, F., Awata, S., Sakuma, N., Inagaki, H., & Ijuin, M. (2012). Reliability and validity of A quick test of cognitive speed for detecting early-stage dementia in elderly Japanese. Psychogeriatrics, 12(2), 75–82. https://doi.org/10.1111/j.1479-8301.2011.00388.x
- Tucker-Drob, E. A., Johnson, K. E., & Jones, R. N. (2009). The cognitive reserve hypothesis: a longitudinal examination of age-associated declines in reasoning and processing speed. Developmental Psychology, 45(2), 431–446. https://doi.org/10.1037/a0014012
- Tufvesson, E., Melander, O., Minthon, L., Persson, M., Nilsson, P. M., Struck, J., & Nagg, K. (2013). Diabetes mellitus and elevated copeptin levels in middle age predict low cognitive speed after long-term follow-up. Dementia and Geriatric Cognitive Disorders, 35(1–2), 67–76. https://doi.org/10.1159/000346292
- Van Der Elst, W., Van Boxtel, M. P. J., Van Breukelen, G. J. P., & Jolles, J. (2006). The stroop color-word test - Influence of age, sex, and education; and normative data for a large sample across the adult age range. Assessment, 13(1), 62–79. https://doi.org/10.1177/1073191105283427
- Venkatraman, V. K., Aizenstein, H. J., Newman, A. B., Yaffe, K., Harris, T., Kritchevsky, S., Ayonayon, H. N., & Rosano, C. (2011). Lower digit symbol substitution score in the oldest old is related to magnetization transfer and diffusion tensor imaging of the white matter. Frontiers in Aging Neuroscience, 3. https://doi.org/10.3389/fnagi.2011.00011
- Warkentin, S., Erikson, C., & Janciauskiene, S. (2008). rCBF pathology in Alzheimer’s disease is associated with slow processing speed. Neuropsychologia, 46(5), 1193–1200. https://doi.org/10.1016/j.neuropsychologia.2007.08.029
- Wiig, E. H., & Al-Halees, Y. (2013). A quick test of cognitive speed: Preliminary screening criteria for arabic-speaking adults, ages 40 to 80 years. Perceptual and Motor Skills, 117(2), 615–626. https://doi.org/10.2466/03.22.PMS.117x20z3
- Wiig, E. H., Nielsen, N. P., & Jacobson, J. M. (2007). A quick test of cognitive speed: Patterns of age-groups 15 to 95 years. Perceptual and Motor Skills, 104(3), 1067–1075. https://doi.org/10.2466/PMS.104.3.1067-1075
- Wiig, E. H., Nielsen, N. P., Minthon, L., & Warkentin, S. (2002a). Alzheimer’s quick test: Assessment of parietal function. Harcourt Assessment.
- Wiig, E. H., Nielsen, N. P., Minthon, L., & Warkentin, S. (2002b). A quick test of cogntiive speed (AQT). Pearson/PsychCorp.
- Wiig, E. H., Nielsen, N. P., Minthon, L., & Warkentin, S. (2005). AQT screenigninstrument för bedömning av kognitiv snabbhet. Manual. Psykologiförlaget AB.
- Zaninotto, P., Batty, G. D., Allerhand, M., & Deary, I. J. (2018). Cognitive function trajectories and their determinants in older people: 8 years of follow-up in the english longitudinal study of ageing. Journal of Epidemiology and Community Health, 72(8), 685–694. https://doi.org/10.1136/jech-2017-210116
- Zelinski, E. M., & Stewart, S. T. (1998). Individual differences in 16-year memory changes. Psychology and Aging, 13(4), 622–630. https://doi.org/10.1037/0882-7974.13.4.622