
Abstract
Objective
This portion of the 2020 survey updates practice information, beliefs, and income data of clinical neuropsychologists who practice within the United States. Methods: Doctoral-level neuropsychology practitioners were invited via numerous methods, with multiple reminders, to participate in a web-based survey from January 17 through April 2, 2020. The useable U.S. sample of 1677 doctoral-level practitioners was 6.2% larger than the comparable group in the prior 2015 practice survey. Results: Whereas women practitioners predominate, which continues a steeply increasing trend across time, increases in overall ethnic/racial diversity continue at a slow pace. Median age has remained very similar over the last 30 years, reflecting a continuous influx of young practitioners. A relatively small minority of neuropsychologists work part time. The proportion of board-certified neuropsychologists continues to show meaningful increase; interest in subspecialization certification is relatively high. Reliance on technicians remains popular, especially for neuropsychologists who work in institutions or are board certified. Although implementation of new CPT codes in 2019 and related payor policies appear to have had more negative than positive effects, psychology-related annual incomes of neuropsychologists have again increased compared to prior surveys. Variables such as specific work setting, state, region, years in practice, forensic practice hours, board certification, and basis for determining income (e.g. hours billed, revenue collected, relative value units) have an impact on income. More than half of practitioners engage in forensic neuropsychology, with the number of related practice hours per week again increasing. There is very high agreement regarding the use of response validity measures in clinical practice and forensic practice. Neurologists remain the number one referral source whether working in an institution, private practice, or a combination of both, and regardless of maintaining a pediatric, adult, or lifespan practice. Career satisfaction ratings for income, job, and work-life balance remain high, with the majority of ratings regarding the future of the specialty in the positive range. Additional data summaries related to a wide range of professional and practice topics are provided. Conclusions: Updating and comparing survey information at five-year intervals continues to provide insights and perspectives regarding relative stabilities and changes in practice activities, beliefs, and incomes of U.S. clinical neuropsychologists. Such information also provides guidance regarding the future of the specialty.
The present clinical neuropsychology practice survey continues a five-year cycle of information gathering from specialty practitioners and postdoctoral trainees. Survey content in 2020 included items that allow comparison to prior survey data, as well as items that reflect new or more specific topics of interest. This article will address general findings of U.S. practitioners, primarily related to practice settings, characteristics of practitioners, variables related to income, and beliefs and interests. Additional articles will follow, addressing specific information regarding practice in Canada, postdoctoral training, and gender and diversity issues. Whenever deemed informative, comparisons will be made to prior survey data or external sources of information. Such comparisons in the past provided context for understanding present data, as well as justification for continued surveying of the specialty, given that other survey-based descriptions relevant to psychology’s practitioners, (e.g. those provided by the American Psychological Association (APA) regarding income) have at times been at odds with our specialty-specific data (Sweet et al., Citation2011). The present survey was planned and nearly fully executed prior to the onset of the COVID-19 national emergency.
As noted previously when reporting prior survey results, the terms “salary survey” in the title of the survey instrument and this publication were originally used by Putnam (Citation1989) and have been retained over the years primarily because of the recognition value to neuropsychology practitioners. In short, many colleagues continue to refer to this project as “the salary survey.” We understand that monies earned related to professional work activities can be more accurately identified as income, rather than salary, which is commonly understood as compensation to employees of an organization or practice who receive a predetermined annual payment from an employer.
Method
Survey planning began in 2018, with eventual instrument development in the summer and fall of 2019. The project was approved by the Institutional Review Board of NorthShore University HealthSystem (EH19-206) in July 2019. Primary funding for the project was secured in equal amounts from the American Academy of Clinical Neuropsychology (AACN), National Academy of Neuropsychology (NAN), and Society for Clinical Neuropsychology (SCN; Division 40 of APA). Additional funding was provided by the APA Health Care Financing Office to support specific survey content related to business practices. To facilitate comparisons, many items from the most recent comparable survey (Sweet et al., Citation2015) were retained in their original format. Items that had become less relevant or had not been found to provide useful information regarding change in beliefs or practices over time were deleted (e.g. items related to retirement and standardized versus flexible battery). A subset of items was modified to increase information value or resolve previously problematic data issues. A relatively small number of items were added to address specific interests and emerging practice issues, such as those related to billing and reimbursement experiences, gender, and subspecialty practice. With the intent that the project would include Canadian colleagues in the 2020 survey, a number of Canadian colleagues were relied on as consultants, providing initial ideas regarding content, as well as piloting the initial draft of the instrument. The survey instrument was also piloted by board members or committee members of all three sponsoring organizations. In response to feedback, survey structure and content were adjusted when possible in the final version of the survey (see Appendix, available as online supplement at TCN website, to view the entire 2020 survey instrument).
Based on prior successful online survey experience in 2005, 2010, and 2015, PsychData (http://psychdata.com/) was again selected for the web-based survey. Respondent information was anonymous. After the data collection phase ended, participant data were downloaded from the PsychData website directly into an SPSS file precluding data entry error.
On January 17, 2020 at 9:00 a.m. Central Time, the survey was opened online in concert with the electronic distribution of invitations (e.g. listserv announcements, e-mail blasts; see acknowledgements for specifics). In addition, an initial postcard invitation was mailed to the integrated U.S. mail address list compiled from separate lists provided by the Society for Clinical Neuropsychology (SCN; APA Division 40), the International Neuropsychological Society (INS), and the National Academy of Neuropsychology (NAN). The combination of these individual lists yielded 5,359 unique names and mailing addresses. In March, a reminder postcard was mailed to each U.S. mail address with the expectation that if electronic communications had not been received or perhaps not noticed, the physical postcard arriving via the U.S. postal service would be noticed. It should be noted that AACN communicates with its membership exclusively by e-mail, which prevented mailing postcards to their members. A specific query asking each respondent to identify the means by which they learned of the survey (checking as many as apply) revealed the following (n = 1317): email 58.8%; listserv announcement 47.5%; postcard 16.7%; word of mouth 7.4%; other 1.3%. There were no incentives offered for participation, which was strictly voluntary. The survey instrument was constructed and available only in English.
All survey information received by the morning of April 2, 2020 at 10 a.m. Central Time was examined for usability. From January 17 through April 2, potential respondents accessed the survey and entered at least some data a total of 2,069 times. Two individuals requested access to complete the survey on April 4 and April 5, and were allowed to do so, making a total of 2071. We relied on the same “data cleaning” procedures used in 2015. Specifically, five individuals were removed because they were not doctoral-level psychologists, and 77 additional individuals were removed based on having spent insufficient time responding to survey items or providing insufficient data or being identified as duplicates through visual analysis of individual item responses. After moving Canadian and postdoctoral trainee respondents into separate databases, to be analyzed and published separately, the remaining useable final sample of U.S. practitioners was 1,677.
The PsychData website automatically records the amount of time each participant spends with the survey open. We had anticipated, and noted in instructions, that time to completion could be approximately 25 minutes. With outliers removed and tails trimmed, the actual mean recorded time was 30 minutes, with a median of 29.7 minutes. Undoubtedly, these times are influenced at the low end by respondents who completed only part of the survey and at the high end by those who kept the website logged in while multitasking and completing the survey in stages (e.g. at the high end of the distribution, durations were measured in hours).
Because the online survey was set to allow many items to be completed or skipped at the discretion of the respondent, sample sizes will vary across tables and sometimes within tables. Under the basic assumption that most meaningful survey results will be apparent to the reader, statistical analyses have been carried out sparingly. Because of the large sample size, where statistics have been utilized, statistical significances of p < .01 or p < .001 are reported. Two significance cutoffs were selected, in part, to increase the amount of information available to readers and, in part, to maintain consistency and ease of comparison with our prior three surveys. In this instance, we view p < .01 as a minimal threshold for meaningful statistical significance, and we view p < .001 as providing the added benefit of reducing false or trivial discovery. Related to statistical analyses, readers will note that, for some variables, the means do not evenly divide the reported Min-Max values or, similarly, that there are large discrepancies between means and medians, indicating a non-normal distribution and possibly the presence of outliers. Because a comparison of parametric and non-parametric analyses of these variables produced very similar results, we have used parametric statistics, as was the case in past surveys. Occasional exceptions occurred when comparing Pearson and Spearman correlations, resulting in inclusion of both types of correlations within two specific tables ( and ).
At various points within this article, data collected in prior surveys are provided for comparison. To reduce the need for recurrent citations at these points, readers should note that the survey years 2005, 2010, and 2015 refer to survey information published as Sweet et al. (Citation2006), Sweet et al. (Citation2011), and Sweet et al. (Citation2015), respectively.
Readers should also note that unlike prior iterations of our survey publications, information pertaining to postdoctoral trainees is the subject of a separate publication (Sweet, Klipfel, Nelson, & Moberg, Citationin press). Also, data from the first-time inclusion of Canadian neuropsychologists will be described in a separate publication. Fundamental information related to gender will be presented, but the more elaborate discussion of this information, and additional detail regarding ethnic/racial diversity is planned for a separate publication. The present article focuses exclusively on the U.S. practitioner sample.
Results
Response rate
When reporting on past surveys, we provided estimates regarding how well the respondent sample approximated the total pool of clinical neuropsychologists who had been invited to participate. In 2020 we attempted to reach all U.S. doctoral-level members of the sponsoring organizations, as well as all doctoral-level practitioners within the broader U.S. community of neuropsychologists who may not belong to one of these organizations. Because many invitations were conveyed electronically and intended to be easily forwarded to as many additional individuals as possible, there is no means of precisely specifying the total number of invitations received by licensed practitioners, who are the true target of this survey. There is also no means of accounting with certainty for membership overlap between the many organizations and listservs whose members received the invitation, to identify the number of unique individuals who received the invitation to participate. For all of these reasons, an exact computation of response rate is not possible. If we were to simply assume that the 5359 unique names and mailing addresses identified in 2020 represent the entire intended number of participants, using the number of 1677 current participants yields a response rate of 31.3%.
In the same timeframe as this survey project, an independent search for our specialty’s total population was also underway (Chris Morrison, personal communication, May 27, 2020). Using data from AACN, American Board of Professional Psychology (ABPP), American Board of Neuropsychology (ABN), INS, NAN, and SCN/D40, Dr. Morrison arrived at an estimate of 5,765 unique names within the 50 states and the District of Columbia, a number slightly higher than our estimate. If accurate, this number as applied to the current survey sample would result in a response rate of 29.1%. We and Dr. Morrison, independently, experienced similar difficulties identifying duplicate entries across membership rosters due to the possibility of multiple addresses or different versions of a person’s name being listed for the same individual. Also, Dr. Morrison noted that even after removing names of individuals whose membership status was categorized as “senior” or “emeritus,” additional manual deletions were required for individuals known to be retired or deceased. Such observations underscore that organizational membership rosters can be inaccurate in terms of deriving total membership numbers.
Perhaps more noteworthy regarding response rate and generalization to the entire specialty is the fact that the current sample of 1677 respondents in the present U.S. doctoral-level practitioner portion of the survey represents a 6.2% increase compared to the 2015 survey. The previous increase in useable sample size from 2010 to 2015 was 5.5%. There have been no larger samples surveyed within the specialty of clinical neuropsychology.
Separate from the consideration of overall response rate, comparisons can be made to subgroups of respondents, when estimates or exact numbers are available. For example, the number of neuropsychologists working within the VA health system has been estimated to be 387 (Young et al., Citation2016). Acknowledging that this number may have risen or fallen in subsequent years, using this estimate, the current sample would represent 31.5% (122/387) VA neuropsychologists, a percentage that is nearly identical to our overall response rate estimate of 31.4%. Also, with regard to representativeness of the largest board-certification enterprise, as of the date of the 2020 survey launch, the total number of ABCN board certifications ever granted was 1397, with 1163 current active and senior members, who might still be engaged in the specialty in some manner (Linas Bieliauskas, personal communication, June 29, 2020). Thus, the 2020 response rate for ABCN participants is 56.1% (652/1163). Finally, we can estimate the representativeness of the number of ABN participants, who represent a separate longstanding board-certification enterprise. Based on personal communication with ABN president Dr. Paula Cooper (August 24, 2020) there were 444 active ABN members at the time of the survey, which yields a response rate of 23.4% (104/444) for ABN board-certified neuropsychologists.
Major neuropsychology organization memberships
shows a breakdown of respondent memberships in the four largest neuropsychology organizations (AACN, INS, NAN, SCN) whose members are U.S. neuropsychologists. More than 96% belong to at least one of these organizations, and the vast majority belong to multiple organizations. Of these four organizations, none has more than a 6.5% exclusive membership (i.e. members who do not also belong to at least one additional organization).
Table 1. Major neuropsychology organization memberships.
Characteristics of U.S. sample
As can be seen in , a typical U.S. practitioner in clinical neuropsychology is likely to be a woman who has attained a Ph.D., with the area of doctoral study being clinical psychology. Practice is likely to be fulltime and located in an urban area. General work setting for more than half of the sample is exclusively within an institution, whereas an additional 21% work in both an institution and in private practice. For most respondents in this latter group, their institutional work is more primary, with private practice representing a secondary supplementary position. Thus, the prominence of employment in institutions is greater than it first appears. Those working exclusively in private practice comprise approximately 24% of respondents. When combined with those who concurrently work in both settings, approximately 76% of neuropsychologists spend part of their work week in institutions, whereas approximately 45% spend part of their work week in private practice. Practitioners with an adult neuropsychologist identity predominate, with approximately 20% having a pediatric neuropsychologist identity and another 20% having a lifespan neuropsychologist identity. With regard to race/ethnicity, the sample is predominantly Caucasian/White, with the next two largest groups, Asian or Pacific Islander and Hispanic/Latino(a), nearly equivalent in the range of 4–5%.
Table 2. Characteristics of overall 2020 U.S. practice samplea: Snapshot of participants.
A comparison of general sample characteristics from 2005, 2010, 2015, and 2020 surveys is presented in . The average age has been quite stable across this time period, indicating that a substantial number of young neuropsychologists continue to join the specialty. A notable trend from 2005 to 2020 has continued for type of degree, with the percent of Ph.D. holders decreasing as a function of a percentage increase in Psy.D. holders. Not depicted in the table, the trend for gender has also continued, from women as a slight minority in 2005 to nearly 21% more women than men in 2020. Diversity has been changing meaningfully across time, but not in all categories. A shift is evident in the decrease of Caucasian/White from 92.9% in 2005 to 84.5% in 2020. Ethnicity types that have increased the most in this same 15-year period are Asian or Pacific Islander and Hispanic/Latino(a). Work status (e.g. full time versus part time versus full time plus part time) has been quite stable across time, with the vast majority working in a single full-time position. The percentage of practitioners working in institutions is now higher than reported in the three previous surveys, dating back to 2005. Interestingly, the percentage of private practitioners is slightly lower than in 2005, but slightly higher than in 2015.
Table 3. Comparison of overall sample characteristics from 2005 through 2020.
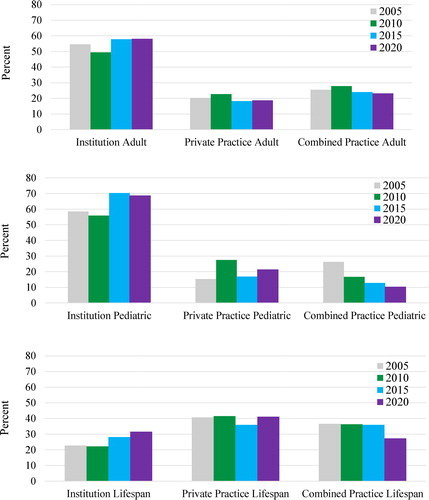
Regarding professional identity, the percentage of lifespan neuropsychologists has declined steadily from 2005 to 2020. In contrast, identity as a pediatric neuropsychologist has increased steadily at each time point. Identity as an adult neuropsychologist is predominant at each time point, but has remained stable from 2015 to 2020. shows comparisons of work setting by practitioner identity. Across the 15-year span, pediatric neuropsychologists appear to have navigated toward institutions, and away from work in combined settings. In the 2020 data, lifespan neuropsychologists appear to show a similar pattern. There is no obvious trend for adult neuropsychologists.
Figure 1. Professional identify and general work setting: Chronological comparison of practicing clinical neuropsychologists.
shows the primary practice locations of survey respondents among the 50 United States, District of Columbia, and Puerto Rico. As was the case in 2015, the number of neuropsychologists in a given state is highly related to that state’s population, with nine states again accounting for more than half of the sample. The 23 lowest frequency entries (22 states and Puerto Rico) at the bottom of account for only 10% of the sample. shows the same primary practice location data aggregated into common U.S. regions.
Table 4. State of licensure and primary employment.
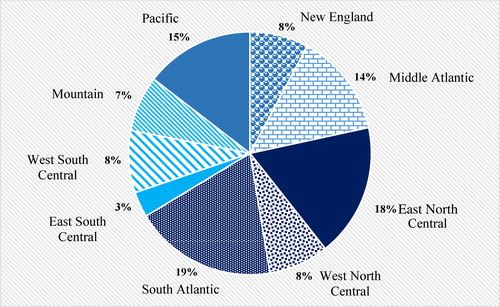
Figure 2. Regions of residence (n = 1560): New England = Connecticut, Maine, Massachusetts, New Hampshire, Rhode Island, Vermont; Middle Atlantic = New York, New Jersey, Pennsylvania; East North Central = Illinois, Indiana, Michigan, Ohio, Wisconsin; West North Central = Iowa, Kansas, Minnesota, Missouri, Nebraska, North Dakota, South Dakota; South Atlantic = Delaware, District of Columbia, Georgia, Florida, Maryland, North Carolina, Puerto Rico, South Carolina, Virginia, West Virginia; East South Central = Alabama, Kentucky, Mississippi, Tennessee; West South Central = Arkansas, Louisiana, Oklahoma, Texas; Mountain = Arizona, Colorado, Idaho, Montana, Nevada, New Mexico, Utah, Wyoming; Pacific = Alaska, California, Hawaii, Oregon, Washington.
provides a breakdown of weekly professional activities. Because such data are necessarily restricted to individuals working at least full time for purposes of comparison, additional information regarding age and years of licensed practice is provided to give readers more perspective on this subsample. The average age of licensed practitioners working full time or more is 46.0 (Min–Max = 29–78), with licensed practice having begun an average of 13.5 years ago (Min–Max = .5–49). Not surprisingly, clinical neuropsychology practice activities predominate among other professional activities, with a common range being 25–30 hours per week. Additionally, general clinical practice hours (i.e. non-neuropsychology practice hours) are present on a weekly basis for a subset of practitioners, showing a mean of five hours with a large standard deviation of 8.5, median of one, and mode of zero. Based on similar comparisons of central tendency measures, non-clinical administration appears more evenly represented within the sample, averaging 5 and 6 hours, respectively. Supervision of support personnel and volunteer activities are less common among weekly activities in this sample of licensed practitioners who are working full time or more.
Table 5. Weekly hours of professional activities: Clinical, research, administrative, and volunteer activities.
Income from professional activities
Throughout the remainder of the manuscript, whenever the term income is used, it refers to annual personal gross income earned only from psychology (and therefore also neuropsychology) activities. Income does not refer to billings or to revenue collected from services or to joint income with spouse or legal life partner. This is true for all respondents, including private practitioners, such that numbers reflect personal income (i.e. amount paid to an individual before taxes or other withholdings).
Starting salaries
Common areas of discussion amongst postdoctoral trainees and their training directors, as well as employers offering starting positions to new postdoctoral graduates, involve entry-level income. shows starting and early career incomes, limited to sufficient sample sizes set at minimum of 10, by work setting and years in practice. Understandably, many starting positions are in institutions, for which we have a greater amount of data, showing mean and median of approximately $1,00,000 for those still within their first year of independent licensed practice. For those already in practice for one and two years, there appears to be an increase of approximately $5,000, with an additional increase of approximately $3,000 in year three. Combining all institution-based practitioners in the first three years of practice, the mean and median incomes are approximately $104,000. Although the samples are small, individuals within the first year of private practice and those within the first three years of working concurrently in both an institution and a private practice appear to earn substantially higher incomes.
Table 6. Income: “Starting salaries” in initial years of clinical practice by work setting.
Years in clinical practice
shows income increases in five-year practice increments. Acknowledging that median incomes due to skewness and/or outliers are often a better indicator when reporting income data, mean values are also presented for historical comparisons. Across all intervals of practice years spanning 25 years, with the exception of years 16–20, there has been a steady, linear increase of income means and medians. From the first interval of less than one to five years to the last interval of more than 25 years, income more than doubled. Beginning with the interval of 16–20 years of practice and continuing in higher practice year ranges (i.e. the “second half” of careers in clinical neuropsychology), income variability increases and there are some very high incomes reaching over a million dollars.
Table 7. Income: Years in clinical practice.
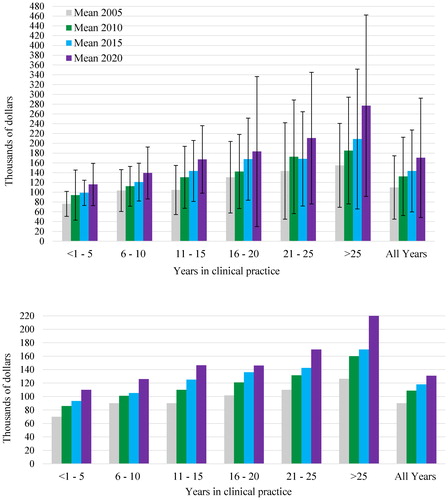
Of equal interest is whether incomes related to years of experience are increasing over time. shows a comparison of mean and median incomes in 2005, 2010, 2015, and 2020 across intervals of years of practice experience. As was the case when reported in 2010 and 2015, all practice intervals again reported higher incomes when compared to five years ago. In fact, nearly all comparisons show a greater amount of increase in the most recent five-year epoch compared to prior interval data.
Figure 3. Income: Five-year comparisons at varying intervals of years in clinical practice.
Geography and income
Region of United States
Incomes by regions of the United States are shown in . Because some of the SDs are very large, medians should be given greater consideration when examining regional incomes. The range of mean incomes across regions is nearly $68,000. The range of median incomes is $25,000. The mean and median incomes are highest for the Pacific region.
Table 8. Income: Region of the United States.
Rural versus urban practice environment
Depicted in are incomes by practice environment, which is divided into rural, urban, and time in both. Again, the high SDs warrant attention. Straightforwardly, individuals who practice exclusively or partially in urban areas report higher mean incomes, but medians tell a different story, showing no meaningful difference between exclusively urban and exclusively rural practice incomes. Median income appears to be the highest for individuals who practice in both environments. Readers will also note the much smaller number of individuals engaged exclusively in rural practice, comprising only 6.4% of respondents shown in .
Table 9. Income: Practice environment.
State of licensure and practice
For those with sufficient sample size to warrant consideration, 18 individual states and associated incomes are reported in . This table also shows 0-100 ratings of satisfaction with income, job, and work-life balance by state, as well as reported increases and decreases in income compared to five years earlier. The highest median income is a tie between California and Washington, with the lowest median income in North Carolina. The vast majority of individuals in each of the 18 states listed in reported that current incomes represented an increase compared to five years ago, with six states (Arizona, Florida, Massachusetts, New York, Tennessee, Washington) having 10% or more of the respondents reporting that current incomes had decreased compared to five years ago.
Table 10. Income: Income change and career satisfaction ratings by state of licensure for primary employment.
Regarding satisfaction ratings, no state had income, job, and work-life balance satisfaction ratings that were all at or above 80 on a 0-100 rating scale. Only Michigan, Pennsylvania, and Washington had two of the three types of satisfaction rated at 80 or above, with income satisfaction at 80 or above in each of these. Although there 13 of 18 states with job satisfaction ratings at 80 or above, the work-life balance satisfaction ratings of all states were below 80.
Income correlates
shows correlates of income, clinical practice hours, years in practice, and forensic work hours per week, to investigate relationships among these four variables and specific work activities. Number of peer-reviewed publications has a weak negative relationship to income, but a moderate relationship to involvement in funded research and weak relationship to non-funded research. Involvement in activities such as teaching/training, and supervision of clinical or support personnel, and administrative duties generally has negligible relationship to fundamental variables such as income, clinical practice hours, years in practice, and forensic work or with other specific work duties shown in . Professional volunteerism is weakly correlated with scholarly pursuits of peer-review publishing, funded research, and non-funded research.
Table 11. Income: Additional correlates – clinical practice hours, years in practice, specific work activities.
Income versus income satisfaction
shows categories of income satisfaction, with associated actual psychology incomes. Overall, satisfaction regarding income is more common than dissatisfaction. Of the 1010 licensed clinicians who were employed at least full time and provided both income and categorical job satisfaction information, very few (n = 23; 2.28%) are “completely dissatisfied” with their incomes, whereas more respondents (n = 150; 14.85%) are “completely satisfied.”
Table 12. Income: Actual income versus categorical income satisfaction ratings.
The pattern of relationships of income satisfaction to actual income is relatively straightforward in that income satisfaction generally rises as incomes rise, with the exception of the “completely dissatisfied” group, which reported higher mean and median incomes than most individuals who are reporting higher satisfaction based on lower income. For example, the mean income of the “completely dissatisfied” group is higher than the mean incomes of all other groups, except for the “completely satisfied” group. Noteworthy also is the fact that one individual in the “completely dissatisfied” group reported an income of $660,000 which, referring back to , is near the 99th percentile of the current sample.
Career Satisfaction: Income, Job, and Work-Life Balance Satisfaction.
Using 0–100 rating scales, licensed practitioners working at least full time expressed relatively high income satisfaction (M = 75.3; Mdn = 80.0; SD = 22.8) and high job satisfaction (M = 80.6; Mdn = 85.0; SD = 18.7). Comparatively, again excluding part-time workers, overall work/life balance ratings appear to express a somewhat lower level of satisfaction (M = 70.2; Mdn = 78.0; SD = 24.8).
Correlates of specific career satisfactions (i.e. income satisfaction, job satisfaction, and work-life balance satisfaction) are shown in , which includes both Pearson’s and Spearman’s correlations due to the fact that distributions of the variables vary considerably and in some instances are non-normally distributed. In most instances, the Pearson and Spearman correlations of the variables of interest are comparable. Those that appear different numerically are, with only two exceptions, in the same range (e.g. weak versus moderate). Readers will note that because of large sample sizes for some individual item responses, even weak correlations as small as .10 are considered significant (p < .001) from a statistical perspective.
Table 13. Career satisfaction: Correlates of income satisfaction, job satisfaction, and work-life balance satisfaction.
The three satisfaction variables range from weak to strong relationships with each other. Income satisfaction and job satisfaction are strongly correlated, whereas income satisfaction and work-life satisfaction are weakly correlated. Job satisfaction is moderately correlated with work-life balance satisfaction.
Within , the variable labeled clinical practice hours represents a sum of neuropsychology practice hours and general clinical practice hours. Interestingly, clinical practice hours have a weak to moderate relationship to all variables, all of which are negative relationships. Not surprisingly, the strongest negative relationship is between clinical practice hours and peer-review publications. More surprising, number of clinical practice hours has a weak negative relationship to income, whereas the number of years in practice and number of forensic work hours are positively correlated with income.
Income shows the only difference in correlation range size between Pearson and Spearman correlations, with both in the weak range with income satisfaction and years in practice for the former, but in the moderate range for both variables with the latter. Notably, income has a small-moderate relationship with income satisfaction, negligible relationship with job satisfaction, and very low, nearly zero relationship to work-life balance satisfaction.
Not shown in , relationships between full-time-equivalency (FTE) and the three types of career satisfaction were investigated using Spearman’s correlations for individuals who are licensed and currently practicing. FTE showed a near-zero relationship to the three satisfactions: FTE and income satisfaction = 0.03 (n = 1102); FTE and job satisfaction = 0.02 (n = 1103); and FTE and work-life balance satisfaction = −.01 (n = 1090).
provides means and mean differences for the three types of satisfaction ratings (0-100 scale) by general work setting and professional identity. (Readers should note that inclusion of the self-designated professional identity that conveys not being a neuropsychologist is for general comparison only; statistical comparisons did not include this group.) Income satisfactions are roughly in the mid-70s for all work settings, with no significant differences between groups. Job satisfaction ratings are significantly higher for private practice than the other work settings, with ratings by respondents in institutions significantly higher than combined institution/private practice. Not surprisingly, respondents working concurrently in two practice settings have lower work-life balance ratings than those working in a single practice setting. Professional identity appears to have no relationship to income satisfaction, with each identity showing an average rating in the mid-70s. The job satisfaction ratings for lifespan identity respondents are significantly higher than the adult neuropsychologists. Work-life balance ratings are significantly higher for adult compared to pediatric neuropsychologists.
Table 14. Career satisfaction: General work setting and professional identity.
Obstacles to career satisfaction
Multiple survey questions addressed the identification of obstacles to the three specific types of career satisfaction. provide information related to the separate categories of personal/family and work environment obstacles, both across and within general work settings and professional identity. Reporting of personal/family obstacles to income satisfaction appear comparable across work settings. Respondents working in institutions exclusively or in the combined setting for part of their work week appear more likely to report personal/family obstacles to job satisfaction. Regarding work environment obstacles, higher reporting appears associated with working exclusively or partly in institutions. Pediatric neuropsychologists report higher frequencies of personal/family obstacles to income satisfaction and job satisfaction, as well as higher frequencies of work environment obstacles to income satisfaction. Lifespan neuropsychologists report the lowest frequencies of work environment obstacles to job satisfaction. and provide detailed breakdowns of specific types of obstacles, showing frequency counts by each of the three general work settings and each of the three major professional identities. What is apparent across these breakdowns is that the factors of establishing and maintaining family life and dual career family appear to be associated with much higher frequency of obstacles to career satisfaction. Interestingly, a hostile work environment is consistently more likely to be reported as an obstacle to job satisfaction than to income satisfaction, with the reported frequency of hostile work environment most often being lower than nearly all personal/family obstacles to income satisfaction. Overall, there appear to be more work/environment than personal/family obstacles across work settings and professional identities.
Table 15. Career satisfaction: Personal/family and work/environment obstacles to income and job satisfaction.
Table 16. Career satisfaction: Personal/family and work environment obstacles within the last five years by general work setting.
Table 17. Career satisfaction: Personal/family and work environment obstacles within the last five years by professional identity.
Number of positions held and perceived mistreatment
Data presented within suggest a highly stable work force in which 85.1% of respondents have held only 1, 2, or 3 positions in their careers. Unfortunately, 16.8% of the respondents have changed jobs in response to perceived unfairness or mistreatment. The specific negative reasons for these job changes vary in type and frequency, with the most common reasons related to problematic employers, unethical or exploitative work environment, pay, and abuse from employers or colleagues. Regarding the latter, the most frequent type of abuse involved sexism.
Table 18. Career satisfaction: Number of positions as a neuropsychologist and perceived unfairness or mistreatment.
Professional identity
Self-assigned professional identity was noted by respondents as: pediatric, adult, lifespan, or not a neuropsychologist. Although this survey was again intended for neuropsychologists, based on past experience, we continued to offer an option for the small group of individuals who each time indicated that they do not consider themselves to be neuropsychologists. This latter group is now too small to provide meaningful comparisons in most instances and as such can easily be omitted from future surveys. Only select tables currently include this group. presents data by four self-identified identities broken down by work status, general and specific work setting, practice environment, and use of testing assistants. Across identities it is apparent that the vast majority of clinical neuropsychologists work full time, with comparable numbers between groups who work part time versus both full time and additional part time. Comparison of pediatric and lifespan respondents shows the former are the most likely to be exclusively employed in institutions, whereas the latter are the least likely to be employed only in institutions and the most likely to be engaged exclusively in private practice. In terms of specific work settings, medical settings and private practice are the locations of 82.5% of positions, which is true across professional identities. With modest variations, the three lowest employment locations across professional identities are relatively consistently rehabilitation, psychiatric, and colleges/universities. The practice environment is overwhelmingly urban, with only approximately 7% of the total sample practicing exclusively in a rural environment.
Table 19. Professional identity: Work status, general and specific work settings, and practice environment.
Wide-ranging information pertaining to professional identity is presented in . Pediatric neuropsychologists have a younger mean age compared to both adult and lifespan neuropsychologists, and, adult neuropsychologists are significantly younger than lifespan neuropsychologists. Accordingly, pediatric neuropsychologists have spent significantly fewer years in practice, whereas the difference between adult and lifespan practitioners is not statistically significant. Beyond these differences, pediatric practitioners appear different from their colleagues on a number of additional variables. The number of pediatric neuropsychologists who indicated involvement in forensic work is much lower than for the other two identities. Additionally, for pediatric neuropsychologists who are involved in forensic work, the average weekly number of forensic hours is significantly lower than for lifespan practitioners. The number of hours required to complete a typical pediatric clinical evaluation is significantly higher than both adult and lifespan neuropsychologists. Lifespan neuropsychologists invest more hours in a typical clinical evaluation than adult neuropsychologists. Pediatric neuropsychologists also spend more hours completing an evaluation when the goal is more narrowly focused on treatment planning. However, when carrying out a more focused evaluation related to educational purposes, pediatric neuropsychologists on average invest fewer hours per evaluation than lifespan practitioners. When the goal is to address a forensic issue or related to establishing baseline for subsequent comparison, the number of hours per typical evaluation is comparable across the three major practice identities. Mean clinical hourly fees are significantly higher for pediatric neuropsychologists than for adult and lifespan practitioners. Forensic fees are not significantly different across professional identities, and in each instance are approximately one hundred dollars per hour higher than clinical fees.
Table 20. Professional identity: Basic demographics and time spent in practice activities.
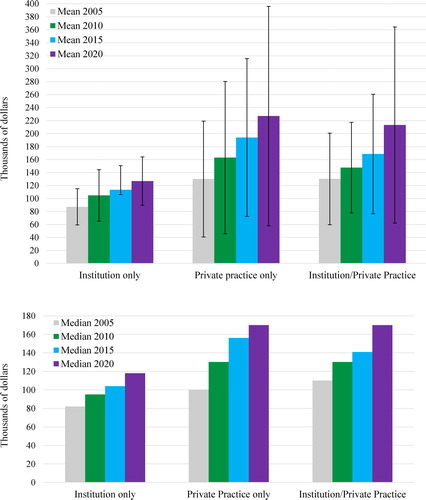
contains income information pertinent to professional identity. Although mean and median incomes again offer quite different perspectives on absolute dollar values, they are in this instance in agreement with regard to rankings and meaningful income differences between all identities. Mean and median incomes are highest for lifespan neuropsychologists, followed by adult neuropsychologists and pediatric neuropsychologists, in that order. The significantly higher age and weekly forensic hours for lifespan neuropsychologists may explain their higher incomes. At the high end of the income range, adult and lifespan neuropsychologists have a much higher maximum income. The much smaller group that does not identify as being a neuropsychologist has the lowest reported incomes.
Table 21. Professional identity: Income.
Figure 4. Professional identity: Five-year income comparisons. Top portion shows means with embedded bars showing SDs; bottom portion shows medians.
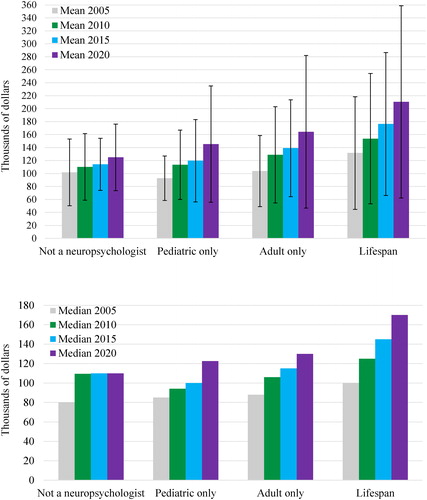
shows graphic comparisons of 2005, 2010, 2015, and 2020 mean incomes (top of figure) and median incomes (bottom of figure), as a function of professional identity. Whether referring to means or medians, all four groups show increased incomes compared to 2005. Setting aside the smaller comparison group that does not identify as a neuropsychologist, all three neuropsychology identities show increased mean and median incomes at each five-year interval, including the most recent from 2015 to the present. At each timepoint, lifespan neuropsychologists appear to have the highest incomes.
General work settings
Income related to general work setting is presented in . Mean and median incomes are substantially lower for the largest group of respondents, who are working in institutions, with much higher, comparable mean and median incomes reported by those who are exclusively or partially in private practice. For those associated with private practice, the maximum incomes reported are at least three times higher. The fact that the SDs are 5-6 times higher in these groups again denotes much greater income variability, which at the highest level surpasses a million dollars.
Table 22. General work setting: Income.
compares 2005, 2010, 2015, and 2020 income data by work setting. Obvious increases are evident across each five-year interval of mean and median incomes for all three general work settings. By comparison, the interval increases appear considerably smaller in the institution group at each timepoint.
Figure 5. General work setting: Five-year income comparisons by neuropsychology practice setting. Top portion shows means with embedded bars showing SDs; bottom portion shows medians.
shows incomes associated with years in licensed clinical practice by general work setting. In this more fine-grained breakdown, at every level of years in practice, the incomes of institutional respondents again lag behind respondents who engage in at least some degree of private practice as part of their fulltime or more practice. For institution respondents, there does not appear to be meaningful growth in mean or median incomes in the span of 11 to 25 years in practice. Hypothetically, during these years, the effects of inflation may have even caused a loss in the spending value of these incomes. For those working in institutions, income growth finally occurs in the highest span above 25 years, but, even then, is merely comparable to decades earlier incomes of respondents associated with private practice.
Table 23. General work setting: Income and years in clinical practice.
Specific work settings
Related to work in institutions, shows a detailed breakdown of specific employment positions, including specific type of institution, department, academic rank, and position title. The largest specific employers are primary university hospital/academic medical centers and academic affiliate hospital/medical centers, which account for 51.5% of institutional employment. At the bottom of the table are listed a number of non-medical setting institutions (e.g. prisons, non-hospital research foundation, undergraduate colleges and universities without doctoral programs, etc.), which clearly are not common sites of employment for clinical neuropsychologists. Of these, the largest non-medical setting employment site is colleges and universities with a doctoral program, at 3.8%. The top five departments in which respondents are most frequently employed are: psychology (21.5%), neurology (20.1%), psychiatry (18.1%), neuropsychology (10.3%), and rehabilitation (10.1%). Academic rank is applicable to approximately 80% of the 853 individuals responding to the related survey question, with the rank of assistant professor being by far the most common at 36.7%. Finally, regarding position titles, the title of staff neuropsychologist/psychologist is held by 67.5%, with clinical program director the second most common, at a much lower 8.8%.
Table 24. Specific institution work settings: Department, academic rank, and position titlea.
list incomes related to specific institutional settings, primary department of employment, academic rank, and position title, respectively. Again for these tables, median incomes likely offer more reliable results, which, when also considering min-max values, are wide ranging. Readers should also note the likely unreliability associated with small sample sizes in some specific work settings, such as non-hospital military service, governmental/municipal hospital or clinic, outpatient free-standing clinic (general), and “other.” By department, the highest mean and median incomes were reported by a very small group of six respondents working in neurosurgery departments, who have a very wide range of incomes. By comparison, departments with the largest numbers of respondents by far are neurology, psychiatry, and psychology, within which there are reasonably comparable mean and median incomes. The lowest mean and median incomes are associated with pediatrics departments, which also show a relatively low range of incomes. With regard to academic rank, individuals indicating lecturer/instructor/educator titles are very comparable in income to assistant professors. From that point, rising in rank to associate professor and professor is associated with incremental increases in income. Notably, among respondents employed in institutions, only 19.4% report that academic rank is not applicable. Finally, with regard to institutional employment, incomes vary by position title. By far, the most common position title is staff neuropsychologist/psychologist, related to which the lowest mean and median salaries are reported. The highest mean and median incomes are associated with the position title of department chair.
Table 25. Specific institution work setting: Income.
Table 26. Institution departmenta: Income.
Table 27. Institution academic rank: Income.
Table 28. Institution position title: Income.
For individuals who work concurrently in institutions and in private practice and whose work in institutions is at least an FTE of .8, shows the additional economic impact in terms of added income from engaging in extra private practice work. This table shows four specific institution work settings, with large enough sample sizes to be meaningful. Clearly, the combination of working in both settings has a powerful impact on income. For example, of the respondents shown in , approximately 55% work in primary or affiliated academic non-VA medical centers. In these two groups, mean incomes are $60,000–$100,000 higher and median incomes are $40,000–$60,000 higher when concurrently working in institutions and private practice.
Table 29. Institution employment versus concurrent institution and private practice employment: Income comparison.
As with different employment roles within institutional settings, the specific roles in private practice shown in can affect income. By a substantial margin, the primary role in private practice is that of sole proprietor or owner, representing 64% of respondents who completed this item. This role is associated with the highest mean and median incomes. The next largest group is that of employee of a private practice, which is associated with much lower mean and median incomes. Partners of a private practice, representing only 7.3%, also report high incomes, more comparable to sole proprietors.
Table 30. Private practice roles: Income.
Bases for determining income
Bases for determining income can vary across and within work settings, and have the potential to influence the upper limit of a clinician’s income. shows the frequency of individuals reporting five possible bases that an employer might use to determine an individual’s income. Of the 998 individuals who completed this item, a relatively small number endorsed RVUs as the basis, which is associated with generally lower mean and median incomes than most other bases. Amount of money collected was associated with the highest mean and median incomes. Number of hours billed was associated with the second highest mean and median incomes. Notably, the most common basis for determining income is, by far, one that does not involve productivity (35.8%), which might be understood as a guaranteed income. Although the specifics of the category of “other” are not known, what is clear is that mean and median incomes for this group are the numerically lowest reported and comparable to the low paid RVU-based group.
Table 31. Income by basis of determination.
Additional information can be gleaned with regard to productivity expectations and specific work settings, the top five of which account for 71.9% of neuropsychologists whose income is not dependent on some form of productivity. In rank order, these specific work settings are: primary university hospital or academic medical center, academic affiliated hospital or medical center (non-VA), VA hospital or VA medical center (no academic affiliation), academic affiliated VA hospital or VA medical center, and outpatient free-standing specialty clinic (e.g. psychiatric, rehabilitation, neurological, epilepsy, etc.).
Career satisfaction ratings can also be compared for individuals whose incomes are not based on productivity. Mean and median satisfaction ratings for this group are: income satisfaction mean = 76.95, median = 85; job satisfaction mean = 81.68, median = 85; work-life balance satisfaction mean = 74.89, median = 80. Combining career satisfaction ratings for the four other bases for income, the means and medians for individuals whose incomes are based on some form of productivity are: income satisfaction mean = 75.26; median = 80; job satisfaction = 82.02, median = 89.5; work-life balance satisfaction = 68.35, median =75). Independent sample t-tests comparing ratings from both groups were not statistically significant at p < .01, although the difference for work-life balance satisfaction ratings approach (p=.02) the pre-determined threshold value for this project.
Work load
contains details regarding annual RVU expectations and reported actual production of RVUs. Notably, the reported production is quite near the employer target expectation. This table also shows RVU production associated with gradations of FTE work status.
Table 32. Workload: Relative value units (RVUs) annually and by full-time-equivalency (FTE).
Workload analysis can extend beyond productivity measures, such as RVUs, to include time spent on activities that are not reflected in typical productivity measures. contains data reflecting time spent on an evaluation that is greater than time billed, as well as pro bono activities. Approximately 55% of practicing neuropsychologists report a discrepancy between hours billed versus hours invested in completing an evaluation. The mean discrepancy is 3.5 hours, with a median of 3 hours, per evaluation. Although all three phases of the evaluation (preparation, delivery, post-service) may generate lost time, this is most likely to occur during delivery of services, and is much more likely to be associated with professional services, rather than technician services. The primary reasons identified include Medicare or other payor limitations approximately 44% of the time, but approximately 68% of the time are unrelated to insurance coverage. Pro bono work is not a common reason for the discrepancy, with relatively few neuropsychologists involved in such activity. Regardless of professional identity, on an annual basis, the percentage of time spent on pro bono work is under 6%, with an overall mean across identities of 4.1% and mode of zero.
Table 33. Workload: Lost billing time and pro bono services.
Understanding workload can include a consideration of clinical demand for a clinician’s services, which can be reflected in “wait time” for a routine outpatient appointment (i.e. time from scheduling contact with clinician’s office to actual date of clinical service). These data are shown in , both from the perspective of an acceptable upper limit of wait time for a routine outpatient evaluation and reported actual wait time for a routine outpatient evaluation, broken down by professional identity and general work setting. Acceptable median upper limits are 15 days higher for pediatric neuropsychologists working in institutions and 20 days higher for pediatric neuropsychologists in private practice, when compared to adult and lifespan neuropsychologists practicing in the same settings. Across settings, in each instance, upper limit wait times are substantially higher for institutions than for private practice. Interestingly, the reported actual median wait times are all 60 days for those working in institutions, regardless of professional identity, whereas in private practice all actual wait times are lower than for institutions, with pediatric identity at 45 days, adult identity at 22 days, and lifespan identity at 21 days. Clearly, private practice neuropsychologists set a lower upper limit regarding what is acceptable for patient wait times and by their report are more responsive to patients in terms of actual wait times prior to routine clinical evaluations.
Table 34. Workload: Wait times in days by professional identity and specific work setting.
Clinical productivity expectations
Somewhat separate from bases of income, such as revenue and RVU productivity, employers can set expectations regarding targets for such variables. presents data from the perspective of respondents who have or do not have clinical productivity expectations, as well as productivity contingencies that can increase or decrease income. Confirming data from a separate question reported in , 57.6% of the 1017 respondents who provided information on this topic appear to have a guaranteed income that is not dependent on a quota or clinical productivity expectation. These individuals have higher mean and median incomes. However, for those reporting productivity expectations, contingencies for increasing or decreasing income based on productivity appear to produce higher incomes. In other words, in keeping with decades of behavioral research, contingencies (e.g. ability to gain greater reward or avoid loss) can alter behavior related to generating income. Without such contingencies, such as merely setting a productivity target that does not actually impact earnings, income is lower. It is notable that such differences in income are not associated with different hourly fees, given that identical median fees are reported in all groups, regardless of presence or absence of productivity expectations or contingencies. Perhaps not surprisingly, income satisfaction, job satisfaction, and work-life balance satisfaction appear somewhat higher for those with apparent guaranteed income, whereas for the other groups these types of career satisfaction ratings are comparable.
Table 35. Clinical productivity expectations: Income, hourly fee, and career satisfaction.
Table 58. Validity testing: Beliefs regarding the empirical foundation of performance validity tests (PVTs) and symptom validity tests (SVTs).
Influence of current procedural terminology (CPT) changes on clinical practice
In 2019, the primary CPT billing codes used by clinical neuropsychologists were completely changed, and the overall billing code approach was also modified to use of a base code with add-on codes. Also, specific codes were identified for use when supervised technicians administered tests. Related to these changes, payor policies evolved. begins with data addressing the general question of whether these changes had an effect on practice, and then provides a rank-order listing of possible positive and negative effects of recent healthcare changes on clinical practice. A majority of practitioners reported that the code change affected their practice. Of the 12 possibilities offered for ranking, two negative effects had much higher endorsement rates – increased time related to billing procedures and decreased reimbursement, both endorsed by well over half of respondents (67.9% and 54.3%, respectively). All other choices were endorsed by under 30% of respondents. A comparison of positive and negative effect choices shows much higher endorsement of negative effects. For example, 3.3% reported increased income, whereas 16.8% reported decreased income and 13% reported difficulty maintain income. Similarly, whereas 3.3% reported increased access to patients and referrals, 24.6% reported being excluded from seeing patients and receiving referrals from specific sources.
Table 36. Influence of change in Current Procedural Terminology (CPT) codes and payor policies on clinical practice.
Billing issues
Medicare participation and associated payment programs
In the U.S., Medicare and Medicaid Services (CMS) is the largest payor for health care services. With an aging U.S. population to be served, participation in Medicare becomes an increasingly meaningful question for neuropsychologists, and particularly for those whose practice serves senior citizens. Excluding Medicaid from consideration, which varies in coverage of services by psychologists state-by-state, survey participants were queried specifically regarding Medicare participation, with responses shown in . Varying by professional identity, with the highest among adult neuropsychologists, the overall participation rate is approximately 70%. Among those who are not participating, approximately 30% had previously been participants. Reasons for dropping Medicare participation are varied, with the most common reason being low reimbursement.
Table 37. Billing issues: Medicare participation and related payment programs.
In 2015, federal law related to Medicare payments changed, which could have caused significant payment rate cuts to clinicians. To offset this possibility, the new law, known as the Medicare Access and CHIP Reauthorization Act of 2015 (MACRA), required that CMS implement an incentive program, which is referred to as the Quality Payment Program (QPP). This program provides a Merit-based Incentive Payment System (MIPS), which allows clinicians to earn additional monies by supplying additional information related to quality, improvement activities, and use of electronic health record platforms. Awareness of, and having sufficient knowledge regarding, the QPP and, specifically, Medicare’s MIPS are low. Approximately 65% are not aware of whether they are eligible and, separately, report not being aware of whether they are required to participate in such programs. Unfortunately, the program developed by the American Psychological Association, the Mental and Behavioral Health Registry, to facilitate decision-making and potential involvement in such Medicare programs is not known to nearly 84% of neuropsychologists. However, among those who are not aware, approximately 25% of practitioners indicate that their employer institutions take care of such matters, negating the need to know.
Facility-based billing, telehealth services, technician services, and feedback sessions
There are aspects of billing for services that can be important to the livelihood of practitioners that are complex to understand and accommodate. A number of these topics are shown in . The first item relates to a specific payment consideration by Medicare. For individuals who do some portion of their work in an institution, Medicare has in the past provided additional payment for what is termed “facility-based” billing. Although Medicare is discontinuing this payment category after many years, more than one fourth of respondents working in institutions do not know whether their billing has been processed as facility based.
Table 38. Billing issues: Facility-based billing, multiple-day evaluations, technician services and telehealth services.
Neuropsychological evaluations can take place on a single date of service or over multiple dates. Interestingly, although 27.1% of practitioners report that completion of evaluations does not require multiple days, 27.2% report that multiple days are required to complete more than half of all evaluations. Test administration is identified by many as the reason. Related to billing, 30.1% of the overall sample has experienced billing difficulties related to having provided services on multiple dates. Removing from consideration those who indicated that billing or collection difficulties for multiple dates of service do not apply to their practice, 38% of those to whom it is relevant have had difficulties.
Beginning in 2019, feedback sessions were officially included in the new CPT code set used by neuropsychologists. Billing difficulties related to providing feedback services were reported by 26.7% of the sample. Removing from consideration those who indicated that feedback services do not apply to their practice (i.e. billing does not occur or feedback does not occur), the percentage reporting billing difficulties rises to 34.2%. The seriousness of this problem was previously conveyed by approximately 68% of respondents (see ) who reported having to devote time to tracking and billing of feedback sessions provided on a date after the evaluation was completed. In data contained within , the seriousness of the problem is also conveyed when considering that the vast majority of neuropsychologists plan to provide feedback for the vast majority of their evaluations. For example, only 3.6% never plan to provide feedback and 77.5% report planning to provide feedback for more than 70% of their cases. Whereas just over one-third of neuropsychologists report having no problem in providing feedback services, almost two thirds report varying degrees of difficulty. The primary obstacles to completing planned feedback sessions are distance (of patient residence, with telehealth services not covered) and patient unwillingness/lack of interest.
In the section that follows, there is extensive information regarding use of technicians. As noted in , 19.8% of the overall sample reported difficulty with billing for technician services. Removing the very sizeable portion of the sample that report technician billing does not apply to their practice, the percentage reporting technician billing difficulty rises to 35.1%.
Finally, in , there are data addressing the provision of telehealth services. This topic is one that became particularly relevant after the onset of the COVID-19 pandemic, which upended normal clinical service delivery. Knowing the official announcement of that nationwide U.S. pandemic emergency was on March 13, 2020, and having the date stamp of the survey website for each participant allows identification of the 292 individuals (17.4%) of respondents who completed the survey on that date or in the approximately three weeks afterward before we closed the survey website. With the vast majority of respondents having completed the survey prior to the pandemic, it is not surprising that there was a low percentage of involvement in telehealth by neuropsychologists, with 84.1% not providing such services. Although 29.2% reported that insurance coverage is the reason for not providing telehealth services, a much higher percentage (60.9%) reported that if insurance coverage was provided specifically for telehealth feedback services, this coverage would allow completion of a greater number of planned feedback sessions.
As became broadly known for the vast majority of healthcare services, the move to telehealth was rapid and massive in the weeks to months following the onset of the pandemic. Chi-square and Phi comparing response frequencies related to telehealth prior to March 13 (142/944 = 15%) versus on or after that date (68/164 = 41.5%) were significant (Chi-square = 37.6; p < .001; Phi = −.169; p < .001; Hedge’s g = .34), indicating that the transition had likely already begun by the time the survey website was closed. This finding is consistent with contemporaneous INS webinar survey findings showing that by April 2, 2020 a substantial portion of neuropsychologists internationally had either already begun moving to provision of telehealth services or intended to do so (Hammers et al., Citation2020).
Use of paid technicians and other testing assistants
As is evident in , more than half of practitioners use technicians, psychometricians, or some other type of testing assistant to collect patient test data. The current survey included a number of new questions on this topic, with the majority of these focused on paid technicians. For neuropsychologists using some form of testing assistant, the monthly frequency of paid technician use varies considerably, with approximately 75% of practitioners using paid technicians for 1-20 evaluations per month, and the remaining 25% reporting usage of 21 to greater than 40 times per month. For many clinicians, technicians are not used for all their cases. For example, approximately 30% of practitioners rely on paid technicians for 60% or fewer of their overall cases, with approximately 46% of practitioners relying on paid technicians for nearly all or all (90-100%) of patient testing. By far, endorsed by 53.3% of respondents who rely on paid technicians, the most common reason for their use is to increase productivity (i.e. increase patient volume). However, this is not the only reason; substantial numbers of practitioners use paid technicians as a means of freeing up their time for administrative, teaching or training, and research or scholarly activities.
Table 39. Technicians: Frequency of use and reasons for use.
compares a number of practice and satisfaction variables for respondents who use paid technicians versus those who do not. Respondents using paid technicians report significantly fewer hours to complete a single neuropsychological evaluation, but no difference in weekly clinical hours. Paid technician use is associated with higher hourly fees, but no difference in reported annual income. The discrepancy in hours spent on a case versus hours billed is significantly smaller for respondents using paid technicians. There is no statistically significant difference in income satisfaction, job satisfaction, or work-life balance satisfaction between respondents who use or do not use paid technicians.
Table 40. Technicians: Associated findings.
Chronological data in indicates that reliance on technicians, psychometricians or other testing assistants has remained quite stable across the last 15 years. Related to practitioner identity, there is a nearly equal reliance on testing assistants by pediatric and adult practitioners, with a lesser degree of reliance by lifespan practitioners. The small group of respondents who self-identify as not being a neuropsychologist are much less likely to rely on testing assistants (i.e. more than 70% do not).
Table 41. Technicians: Use from 2005 through 2020 in overall samples and in 2020 by professional identity.
Factors determining duration of evaluation
shows the hours needed to complete evaluations, associated with referral questions and referral context. Given the illness acuity and time pressures associated with relatively brief, highly compressed inpatient admissions, it is not surprising that mean and median times for neuropsychological evaluations are briefer in duration when compared to outpatient evaluations for establishing diagnosis, treatment planning, and baseline functioning. Hours reported for educational evaluation are comparable to outpatient diagnostic evaluations. Forensic evaluations are much longer than other types of evaluation, with a mean and median of 14 hours.
Table 42. Hours needed to complete evaluations related to referral question and referral venue.
There is a complex set of individual case factors that affect time needed to complete a neuropsychological evaluation, as shown in , which identifies the “top five” relevant factors. Of 13 choices, the five most frequently endorsed factors affecting evaluation time were, in order: (1) the goal of evaluation; (2) age of examinee; (3) stamina/health of examinee; (4) sensory, motor, cognitive limitation; and (5) context (clinical vs. forensic).
Table 44. Factors affecting the length of an evaluation by professional identity.
shows the percentages of item endorsements for the same 13 factors that may affect evaluation length, broken down by professional identity, revealing both similarities and some select differences. Related to differences, age is the number one factor for pediatric neuropsychologists, but ranks third for adult and second for lifespan neuropsychologists. Stamina/health of examinee ranks fourth for pediatric, second for adult, and third for lifespan. Context (clinical vs. forensic) ranks ninth for pediatric, fifth for adult, and fourth for lifespan identities. Whereas orientation/confusion ranks 13th for pediatric, this factor ranks 6th for adult practitioners, whose elderly patients can be much more susceptible in this regard. With all three professional identities, such factors as reimbursement, employer limits, and scarcity of relevant norms are rated near the bottom of factors that affect evaluation length.
Most common referral sources
General work setting and professional identity have the potential to affect referral sources. As shown in , across work settings and professional identities, neurology was the number one referral source, as was the case in 2010 and 2015. Primary care medicine ranked second for respondents working in institutions exclusively and institutions concurrently with private practice, and also ranked second for adult and lifespan neuropsychologists. Those solely in private practice ranked primary care medicine third. Psychiatry was in the top five for all three general work settings, as well as adult and lifespan identities. Physiatry was also well represented, being in the top five for all but private practice work setting and lifespan identity. Attorneys also appear in four of six top five rankings, as high as second for private practice work setting, but not in the rankings of those working in institutions exclusively and pediatric neuropsychologists.
Table 45. Top five rankings of referral sources related to neuropsychological assessment by general work setting and professional identity.
Most common bases for referral to neuropsychologists
shows chronological top rankings of common diagnostic considerations made at time of referral for neuropsychological evaluation, which are commonly referred to as establishing “medical necessity.” Most comparisons across time show impressive stability of referral diagnoses. For example, adult neuropsychologists have produced the same first and second ranked diagnoses, elderly dementia and head injury/brain injury, at all four time points. For lifespan neuropsychologists, head injury/brain injury has been ranked first at all four time points, and for pediatric neuropsychologists attention deficit hyperactivity disorder (ADHD) has been first since 2010. In 2020, head injury/traumatic brain injury, seizure disorder, and the broad category of “other medical/neurological conditions” appear in all three sets of rankings. Among the few changes in 2020, adult neuropsychologists no longer rank ADHD in the top five, which had occurred in 2010 and 2015. Not shown in , by collapsing across professional identity, in 2020 the overall rank of most common referral diagnoses is 1. Elderly Dementia, 2. Closed head injury/traumatic brain injury (CHI/TBI), 3. ADHD, 4. Seizure Disorder, 5. Other medical/neurological conditions.
Table 46. Diagnostic conditions serving as bases for neuropsychological evaluation: Top five rankings in 2005, 2010, 2015, and 2020 delineated by professional identity.
Knowing that head injury/traumatic brain injury is a common referral basis for neuropsychological evaluation, provides more specific information in the form of percentages, showing that the vast majority of practitioners evaluate TBI, in most instances over 90% for the variables examined. This table also provides a delineation of injury severity by general work setting, professional identity, and with regard to whether practitioners are involved in forensic work. Regardless of general work setting, professional identity, and forensic involvement, most injured examinees referred because of head injury/traumatic brain injury are categorized as mild, and the frequencies across these variables are relatively comparable, with most near 70%. Moderate brain injury is also comparably represented across variables, but much lower at or near 17%. The frequency of severe injury varies, but is generally low, with greater frequency seemingly associated with working exclusively in institutions, having a pediatric and lifespan identity, and not being involved in forensic work.
Table 47. Traumatic brain injury (TBI): Severity level by general work setting, professional identity, and forensic involvement.
Board certification
More so than any other psychology practice specialty, clinical neuropsychology has developed an expectation that its specialists should become board certified, an expectation that began decades ago (cf. Division 40 Executive Committee, Citation1989; Hannay et al., Citation1998) and has predominated (Cox, Citation2010; Lucas et al., Citation2014; Morrison, Citation2020). provides a detailed breakdown of board certification status of respondents. A clear indication of the importance of board certification within the specialty is that 45.2% of the overall sample (n = 1677) reported having attained some form of board certification. Additionally, among neuropsychologists working in institutions, 21.4% (211 of 998) report that board certification is a requirement of their employment.
Table 48. Board certification: Clinical neuropsychology and other specialties in overall sample.
Of 686 ABPP board-certified respondents, 95% reported ABCN board certification either exclusively or with additional board certifications. Of the overall sample, 6.7% reported ABN board certification either exclusively or with additional board certifications. As shown in this table, it is uncommon for neuropsychologists to have more than one board certification. Finally, in this sample only 20 neuropsychologists reported having a board certification that is not in clinical neuropsychology.
ABCN board certification in clinical neuropsychology
ABCN is the largest board certification enterprise in the specialty of clinical neuropsychology (cf. Cox, Citation2010; Morrison, Citation2020), and also appears to be the most active under the auspices of the American Board of Professional Psychology, which currently has 15 specialty boards. The present survey sample included the largest sample of ABCN board-certified neuropsychologists to date (n = 652). For these reasons, we provide detailed relevant findings.
Characteristics of ABCN respondents
shows some of the basic characteristics of the ABCN sample. Because preliminary analyses indicated that ABCN respondents were in many ways comparable with the overall sample, the small number of ABCN respondents who have additional certifications were retained within the ABCN sample. Average age is 47.9 years, with an average of 16.1 years of experience post licensure. Women comprise 58% of the ABCN sample. The doctoral degree type of Ph.D. is predominant at 85%, with the doctoral specialty having been in clinical psychology for 84.4%. Practice environment is urban for 83.7%, and practice is full-time for 84.5%.
Table 49. Board certification: American Board of Clinical Neuropsychology (ABCN) respondent characteristics.
The general work setting for ABCN respondents strongly favors institutions, where 54% work exclusively and another 26.9% work at least part-time. Comparatively, private practice is less well represented, with 29% working solely in private practice, with an additional 26.9% working at least part-time in that setting. Whereas these percentages are not all that different from the overall survey sample, specific work settings are somewhat different. In both the overall sample and the ABCN sample, there are two specific work settings that account for most respondents – medical settings and solo private or group private practice settings. For ABCN respondents, these two specific work settings account for 85.9%, with 62.7% working in medical settings and 23.2% working in solo private or group private practice settings. In the overall 2020 survey sample, the same two specific work settings account for a lesser percentage of employment; for ABCN respondents, working in medical settings accounts for a higher percentage of employment compared to the overall survey sample.
Compared to the overall sample, professional identity among ABCN respondents appears higher for those whose services are provided exclusively to adults, at 65.9%. Pediatric neuropsychologists represent 17% and lifespan neuropsychologists (serving both pediatric and adult patients) represent another 17%. Use of technicians or other testing assistants, at 66.2%, as well as provision of forensic services, at 55.8%, are higher than the overall sample..
Income of ABCN respondents
provides additional information regarding ABCN incomes with regard to practice environment, region, and general work setting. As is true for the overall sample, there is substantial variability in means, standard deviations, and Min-Max values. Among these, region and general work setting appear associated with the largest income differences. For example, 8 of 9 regions have mean incomes that are under $2,00,000 with most well under that amount, whereas the Pacific region mean income of $2,58,700 is $62,500 higher than the Middle Atlantic region, which has the second highest mean income.
Table 50. Board certification: American Board of Clinical Neuropsychology (ABCN) practitioner income by practice environment, region, and general work setting.
Respondents who work exclusively in private practice or concurrently work in private practice and an institution report far higher incomes, which are over $2,50,000 and $2,00,000 respectively, whereas the mean income for the largest group of respondents whose work is entirely in institutions is in many instances more than $1,00,000 lower. The Max value for the institution group is approximately one-fourth that of the private practice group.
Comparisons of ABCN and non-ABCN respondents
contrasts ABCN board-certified and non-ABCN-board-certified respondents for eight salient variables, six of which are significantly different from the overall sample. Because income, peer-reviewed publications, and professional meeting presentations could simply reflect greater number of years in practice, ANCOVAs using years in practice as a covariate were carried out. These results remained significant at p < .001. Although income satisfaction was significantly different, job satisfaction and work-life balance satisfaction were not.
Table 51. Board certification: Comparisons of American Board of Clinical Neuropsychology (ABCN) and non-ABCN income, years of clinical practice, scholarly activities, volunteer activities, and career satisfaction.
Interest in ABCN board certification and obstacles to attainment
As shown in , for respondents not board certified, interest in becoming board certified by ABCN was expressed by 63.2% (523/872). These respondents were also asked to identify as many obstacles to attainment of board certification as applied to their personal circumstances. Among the specific item choices offered, there are two primary obstacles: (1) prohibitive time commitment (i.e. insufficient time to prepare for the examination) and (2) limited incentive (e.g. lack of employer support). Among the remaining offered items, availability of mentorship, and especially availability of postdoctoral training sites or ability to move to a postdoctoral training site, were not commonly identified as obstacles. Interestingly, the category offered for “other” reasons was endorsed by more than one-third of respondents to this item. The “other” response choice also offered an optional free text space to provide an explanation. Many of these 160 “other” explanations for individuals who expressed interest without current attainment of board certification can be grouped as: nearing retirement or the perception of being too late in career, already in the application process or currently progressing through the stages, not eligible because of training background, perception that pediatric candidates must learn too much about adult practice, and ambivalence or anxiety.
Table 52. Interest in and obstacles to pursuing American Board of Clinical Neuropsychology (ABCN) board certification and subspecialization.
ABCN subspecialization interest
Also presented in , within the large subset of respondents not board certified by ABCN, interest in the currently available pediatric subspecialization is 23.7%, and interest in pursuing a possible future forensic subspecialization is 18.6%. As one might expect, within the subset of pediatric practitioners, interest in pursuing pediatric subspecialization is much higher at 75.2%. Similarly, although not nearly as pronounced an effect, within the subset already engaged in forensic practice, interest in pursuing forensic subspecialization is 30.3%. Understandably, ABCN respondents who are currently involved in forensic work have a higher degree of interest (44.1%) in forensic subspecialization. Interest in pediatric subspecialization is much higher among pediatric practitioners than among lifespan practitioners, and, interestingly, even among those who already hold pediatric subspecialty certification over one-fourth also have an interest in forensic subspecialization. Given that percentages representing very different size samples can be difficult to integrate and fully understand, the actual numbers of interested respondents contained just within the current sample are also of interest. The non-overlapping sums in represent 256 respondents interested in pursuing the currently available pediatric subspecialization and 342 respondents who are interested in a possible future forensic subspecialization.
Finally, with regard to subspecialization, we investigated the possibility that practitioner age was a relevant variable, using point-biserial correlations to examine expressed interest (i.e. yes = 1, no = 2) across the age range of respondents. For practitioners who provide pediatric services, there was a moderate or medium size correlation (r = .465, p.000, n = 447) between interest in pediatric subspecialization and age (i.e. older practitioners are less interested), whereas for practitioners providing forensic services there was a small or weak size negative correlation (r = −.136, p < .001, n = 1312) between interest in forensic subspecialization and age (i.e. greater interest associated with being older), with the latter likely to have reached significance only because of the large sample size.
ABN board certification in clinical neuropsychology
provides information pertaining to neuropsychologists who are board certified by ABN, for the104 respondents who have this certification, whether or not they also have a board certification from ABCN or any other ABPP specialty. The average age of these respondents is more than ten years higher than the general sample, and is also higher than the ABCN sample. Years in practice and income are also ten years higher for the ABN sample compared to the ABCN sample. The ABN sample has almost three times as many men as women, which is quite discrepant from the overall sample and the ABCN sample. For the smaller subgroup of 24 individuals who report fewer than 15 years in practice, the gender composition includes 34.6% men, whereas the larger subgroup of 72 individuals who report 15 or more years in practice consists of 84.7% men. Similar to the overall sample and the ABCN sample, the majority of ABN respondents have a Ph.D. in clinical psychology and practice fulltime in an urban area. Different than the overall and ABCN samples, the majority of ABN specialists practice in the specific work setting of solo or group private practice. Additional differences appear in professional identity, with 57.1% adult, 37.3% lifespan, a single individual self-identifying as pediatric, and, oddly, one individual self-identifying as not a neuropsychologist. Under half of the ABN respondents use a technician or other assistant to collect test data, which is again different than the overall sample and ABCN sample. A higher percentage, at 73.8%, engage in forensic evaluations.
Table 53. American Board of Neuropsychology (ABN) respondent characteristics.
Forensic neuropsychology practice
Characteristics of participants in forensic neuropsychology practice
Basic comparisons of respondents engaged in forensic practice and those not engaged in forensic practice can be found in . Women are less likely to engage in forensic practice, although, as seen in an upcoming table, this finding is confounded by years in practice, with women the vast majority of new entrants into the specialty. Practitioners who spend at least a portion of their work week in private practice are much more likely to be engaged in forensic practice. The breakdown of specific work settings is informative in demonstrating that the lowest involvement in forensic practice occurs in medical settings, where, nevertheless, one-third of practitioners are involved in forensic practice. Respondents working in rehabilitation, psychiatric, college/university, and “other” specific work settings all participate in forensic practice in the range of approximately 40-48%, with solo or group private practice the highest at approximately 75% or 3 of every 4 practitioners! Professional identity is associated with widely-ranging forensic involvement, with pediatric neuropsychologists much less likely, at approximately 20%, than their adult and lifespan colleagues, whose involvement is approximately 47% and 70%, respectively.
Table 54. Forensic practice: Gender, general work setting, specific work setting, and professional identity.
Forensic training background is shown in . Among the broad sample of current survey respondents, 65.2% report having received training in forensic neuropsychology practice, either during the training process en route to becoming a neuropsychologist or subsequently in the form of continuing education. As a group, approximately half of this forensic training occurred before entering the field and approximately half after doing so. By far, the assignment of importance by respondents reveals that forensic training while a postdoctoral trainee and after beginning practice via continuing education are viewed as the most important.
Table 55. Forensic practice: Training background.
shows the general foci and specific referral questions/topics of interest among forensic neuropsychology cases; the greatest interest is head injury/traumatic brain injury. Forensic neuropsychology practice most frequently focuses on civil matters (such that a vast majority are in civil litigation, disability determination, and worker’s compensation), with criminal proceedings much less frequently at issue.
Table 56. Types of forensic neuropsychology practice and disorders of interest.
Additional information regarding key variables of interest with regard to involvement in forensic neuropsychology practice is shown in . Compared to individuals who do not participate in forensic practice, forensic practitioners have been in practice significantly longer, have significantly higher income satisfaction, and significantly higher actual income. The effect sizes for years in practice and income are large. Job satisfaction and work-life balance satisfaction are not significantly different, nor are numbers of peer-review publications. Readers should note that the relatively high mean number of peer-review publications is in the context of very high SDs, which, along with the median and mode, indicate a non-normal distribution, consistent with the well-known fact that most psychologists do not engage in peer-review publishing. Thus, the high means in this instance reflect the prolific activity of a minority of practicing neuropsychologists.
Table 57. Forensic activity: Years in clinical practice, number of publications, career satisfaction, and income.
Use of performance validity tests (PVTs) and symptom validity tests (SVTs)
Response validity tests, known as PVTs and SVTs, are now part of general practice, although historically these were initially highly associated with forensic practice. Specific survey questions addressed beliefs regarding whether there is sufficient empirical research/knowledge to support use of PVTs and SVTs. These results are shown in , divided into those who do or not engage in forensic practice. Of the 1526 individuals who responded to the question of whether scientific evidence supported PVT use, only a single individual (with no involvement in forensic practice) strongly disagreed. In both groups, less than 3% chose the “disagree” option. Those choosing “agree” or “strongly agree” represent at least 95% of respondents in both groups.
compares forensic neuropsychology practitioners and non-forensic neuropsychology practitioners in terms of actual usage of stand-alone and embedded validity measures. The vast majority of respondents not engaging in forensic practice report using validity measures, with 69% reporting use of single or multiple PVTs, 68.1% using multiple embedded PVTs, and 50.9% using SVTs. Only 3.8% of non-forensic practitioners do not use PVTs or SVTs within their clinical evaluations. Among respondents with forensic practices, only 1.7% are not using PVTs or SVTs within their clinical evaluations; these practitioners are much more likely to use multiple stand-alone and embedded PVTs, as well as more likely to use SVTs in clinical evaluations. Within their forensic evaluations, only 1.2% do not use PVTs or SVTs, with 94.4% using single or multiple stand-alone PVTs, 90.5% reporting use of single or multiple embedded PVTs, and 75.5% reporting use of SVTs.
Table 59. Validity testing: Actual use associated with typical clinical and forensic practice.
provides a graph of weekly hours of forensic work by professional identity and, using data from prior surveys, across time. At each five-year reporting interval, the number of weekly forensic work hours has increased for all three professional identities, even for the traditionally less-involved pediatric neuropsychologists. Related to increasing forensic hours across survey intervals, demonstrates two persistent patterns pertaining to income of practitioners who are employed full time or more. As income in general has risen at each time point over the last 15 years (see also ), neuropsychologists involved in forensic work have a substantially higher income at each time point compared to practitioners who have no involvement in forensic work.
Figure 6. Forensic practice: Chronological comparison of weekly forensic hours by forensic practitioners with a specific professional identity. The above shows only positive standard deviation bars.
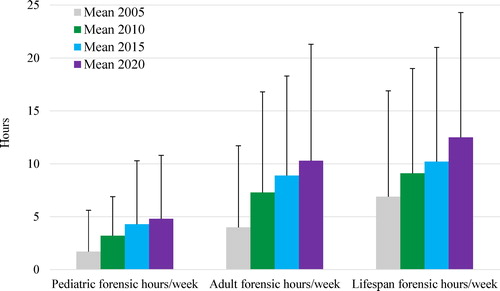
Figure 7. Forensic practice: Chronological comparison of annual income among neuropsychologists with and without involvement in the practice of forensic neuropsychology.
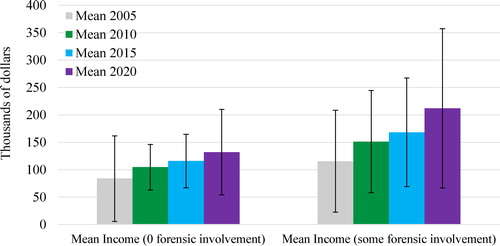
Two interesting, opposing trends appear in . Mean hours necessary to complete outpatient diagnostic evaluations decreased from 2010 to 2015 and again have decreased from 2015 to 2020. One could speculate, based on survey responses depicted in , that shortened evaluation times may reflect negative effects of recent U.S. healthcare changes. In contrast, mean hours necessary to complete forensic evaluations, which are not dependent on third-party payor policy, increased from 2010 to 2015 and again have increased from 2015 to 2020. Median hours for these clinical and forensic activities, which are not shown, depict nearly identical patterns.
Figure 8. Forensic practice: Chronological comparison of clinical outpatient diagnostic versus forensic outpatient mean evaluation times.
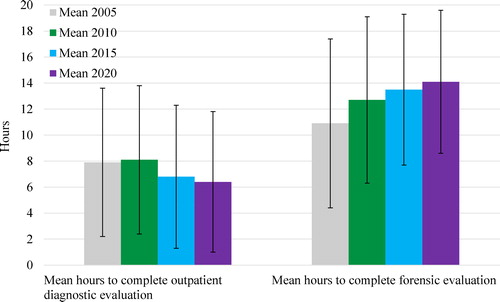
Scholarly activity
A subset of clinical neuropsychologists is involved in scholarly activities. provides additional information related to specific scholarly activities by professional identity and general work setting. All professional identities appear to have substantial involvement in publishing articles and making conference presentations. Looking more closely at possible differences, adult neuropsychologists appear to have the greatest involvement in these activities and pediatric neuropsychologists appear to be engaged in less scholarly activity. However, all variables show widely discrepant means and medians, indicating non-normal distributions that represent considerable variability across respondents. With this caveat also in mind for general work settings, both higher means and medians suggest that concurrent work in an institution and in private practice is associated with considerably more peer-reviewed publications and more conference presentations than working exclusively in an institution or exclusively in private practice.
Table 60. Scholarly activities: Peer reviewed publications and presentations by professional identity and general work settinga.
Also related to scholarly activity, shows the non-clinical activities of teaching/training, funded research, and non-funded research that are often associated with scholarly outcomes, such as publishing and presenting at conferences. These data indicate that clinical neuropsychologists are engaged in an average of five hours per week in teaching/training, which is also the modal response. Research involvement, whether funded or unfunded, is much less common in terms of mean and median hours per week, with both modal responses at zero.
Table 61. Scholarly activities: Teaching/training and research hours per week.
Realizing that the means and medians noted above could be attributable to a small subset of neuropsychologists that is very prolific when it comes to scholarly activities, we also computed percentages who are involved versus not, from which to possibly derive a better understanding of the degree to which the broader “community” of neuropsychology participates. With different numbers of respondents per activity, the following percentages represent active involvement in scholarly activities at some point in their careers: publications 84.5% (1196/1415), conference presentations 88.5% (1232/1392), teaching/training 75.1% (918/1223), funded research 31.7% (338/1065), and nonfunded research 53.4% (589/1104). Clearly, one could conclude that the specialty of clinical neuropsychology has a culture of scholarly activity, rather than just a few prolific scholars.
Perspective on the future of clinical neuropsychology
New to the 2020 survey was a query regarding the degree to which respondents forecast a positive or negative outlook for the specialty of clinical neuropsychology. As shown in , more than 80% reported at least a somewhat positive perspective, with only 6.6% choosing “completely positive,” and more than half of respondents choosing “mostly positive.” Notably, not a single person chose the “completely negative” option. With the possibility that general views regarding the future might be related to factors such as years in practice, board certification, general work setting, or professional identity, these data are also shown in . With the exception that a lifespan identity appeared more likely to be associated with a completely positive viewpoint, none of these other factors appeared associated with sentiment regarding the future of clinical neuropsychology.
Table 62. Perspective on the future of clinical neuropsychologya.
Table 43. Ranking of “top five factors” affecting the length of an evaluation.
Satisfaction with survey instrument
The final survey item asked respondents to rate degree of satisfaction or dissatisfaction with the survey instrument, in terms of coverage of income and practice activities. A total of 1317 respondents provided a rating. The results were completely satisfied (11.5%), mostly satisfied (58.8%), somewhat satisfied (19.9%), somewhat dissatisfied (6.5%), mostly dissatisfied (2.4%), completely dissatisfied (.9%). Combining all respondents with some degree of satisfaction or some degree of dissatisfaction, 90.2% were at least somewhat satisfied and 9.8% were at least somewhat dissatisfied.
Discussion
These 2020 survey results are the latest in the recurring five-year cycle that provides key characteristics of clinical neuropsychologists, and their incomes and practices. This iteration represents the largest survey of U.S. clinical neuropsychologists to date. The majority of numbers and graphics described in the results section are straightforward and do not require additional analysis. Moreover, topics previously discussed extensively, such as comparisons to other aspects of the U.S. labor market, other psychology specialties, and other healthcare specialties, were comparable in 2010 and 2015, and are unlikely to have changed in 2020. Instead, we will focus on a brief description of salient trends in survey data over time and likely directions for the continuation of this project in 2025. As a reminder to readers, there are separate publications that address 2020 survey results regarding postdoctoral trainees and Canadian neuropsychologists, respectively.
Key perspectives of clinical neuropsychologists in 2020
There is a healthy and robust growth in the specialty, with a continued influx of new postdoctoral graduates entering the field. Despite changes in healthcare since 2015 that survey respondents reported as decidedly negative overall, incomes have once again increased, although clinical hourly fees and forensic hourly fees did not! The overall outlook regarding the future of the specialty, a topic not queried in prior surveys, is positive, with only 19.5% endorsing some degree of negative expectation regarding the specialty’s future and not a single respondent endorsing a “completely negative” outlook. With each five-year survey interval, the proportion of men continues to decline substantially, to the point now that men can aptly be described as a declining minority of U.S. clinical neuropsychologists. Changing gender representation contrasts sharply with ethnic/racial diversity, which is changing ever so slowly across time, and is difficult to identify without careful comparisons back to 2005. The percentage in the category of Caucasian/White has declined from 92.9% in 2005 to 84.5% in 2020. For comparison, the segment of the general U.S. population identified by the US Census Bureau estimates as “White alone (non-Hispanic)” was 66.5% in 2005 and is 60.1% in 2019, according to estimates by the US Census Bureau (U.S. Census Bureau Citation2011, Citation2019). Clearly, there have been and are ongoing attempts to increase diversity among our doctoral-level specialists, as well as to prepare all of the specialty’s clinicians for effective assessment of ethnic/racial minorities and increasing cultural diversity (e.g. Byrd et al., Citation2010; Fernandez, Citation2019; Fujii, Citation2018; Mindt et al., Citation2010; Romero et al., 2009). There appears to have been more progress made regarding improving services to increasingly diverse clientele, compared to the endpoint of the diversity “pipeline” that leads directly to becoming a doctoral-level clinical neuropsychologist. That is, there has been and remains limited output with regard to increasing ethnic/racial diversity.
Employment of clinical neuropsychologists in institutions, primarily academic medical centers and various types of hospitals, has been prominent historically and appears to be increasing over time proportionate to a decreasing involvement in private practice. The percentage of neuropsychologists working exclusively in institutions has increased from 42.9% in 2010 to 54.9% in 2020. Additionally, more than half of the 21% who work concurrently in an institution and in a private practice perform more than 80% of that work in an institution. Moreover, in 2020 more than 68% of pediatric and more than 58% of adult neuropsychologists are employed in medical/hospital and other types of institutional settings, and only practitioners providing lifespan services (an older, smaller subset of practitioners that is decreasing over time) are more likely to be employed in private practice than in an institution. These facts make the strong point that practice in institutions increasingly shapes the mainstream of clinical neuropsychology practice and the beliefs of specialty practitioners. This point is underscored when considering that clinical neuropsychologists in institutions are responsible for almost all predoctoral internship and postdoctoral training related to the specialty, as well as a significantly greater amount of scholarly and professional volunteer activity. When compared to private practice, employment in institutions is associated with higher use of technicians, longer wait times between setting of appointment and providing service, less forensic practice, more pediatric practice, more practice-related research and teaching, lower incomes (but comparable income satisfaction), lower job satisfaction, and comparable work-life balance satisfaction.
Although the professional identity of maintaining a practice exclusively serving adults is by far the most common, identity as a pediatric neuropsychologist has increased steadily, from 13.5% in 2005 to 19.5% in 2020. The proportion of men who self-identify as pediatric neuropsychologists is even lower than clinical neuropsychology in general.
The number of board-certified clinical neuropsychologists continues to increase, with an impressive 45.2% of the present sample being board certified, the vast majority under the auspices of ABCN. Noting the ongoing annual addition of newly board-certified neuropsychologists to these numbers, and the related trajectory over time for our specialty that is so different from all of the 14 other ABPP specialties, clinical neuropsychology appears distinct in valuing this level of peer review. Similarly, interest in subspecialization, initially in pediatric neuropsychology (Baron, Wills, Rey-Casserly, Armstrong, & Westerveld, Citation2011) and currently being explored in forensic neuropsychology, conveys a viewpoint regarding professional development in clinical neuropsychology that our specialty is maturing at a different rate than psychology’s other specialties.
Evaluation of response validity through use of PVTs and SVTs has increasingly been considered essential to neuropsychological practice. In 2015, and again in 2020, the largest samples to weigh in on this topic (i.e. whether there is scientific evidence supporting PVT and SVT usage, as well as identifying actual frequency of usage) to date have conveyed impressively near-consensual viewpoints. Specifically, the percentages of disagreement are so low that it is fair to characterize current practitioner opinion as “almost no one disagrees” with the proposition that scientific evidence supports PVT and SVT use for clinical and forensic use and nearly all neuropsychologists use and rely on both types of measures to assure response validity in clinical and forensic practice.
Future directions and predictions for 2025
Survey data collected at multiple intervals across time allows for semi-objective predictions regarding the direction and future of clinical neuropsychology. In fact, the important contributions of surveys within the specialty of clinical neuropsychology have been appropriately underscored in a systematic review of surveys within the specialty (Marcopulos et al., Citation2020) and a critique of methods (Guterbock & Marcopulos, Citation2020). There is no reason to believe that such self-analysis by clinical neuropsychologists will cease. The major caveat in this instance is the occurrence of a global pandemic, the timing of which occurred in the final weeks of 2020 practice survey data collection. As noted previously, with the exception of content related to telehealth services, there is little reason to believe that the pandemic had much influence on present data, given that 82.6% of respondents completed the survey prior to the declaration in the U.S. of the COVID-19 pandemic. Annual psychology incomes reported in 2020, by design, reflect income from the prior year, and thus were unaffected by the pandemic. However, as the pandemic continues to ravage health and economies around the world, there surely are effects on current incomes and professional practices that would be reported if surveyed in 2021. Given that each of our prior surveys at five-year intervals has identified meaningful income increases, and the time allowed for development of vaccines and treatments of COVID-19 before the next planned survey, we might reasonably expect economic recovery and perhaps a normal income increase for clinical neuropsychologists in 2025. Evidence supporting this belief includes that a significant nationwide recession occurred between the prior 2005 and 2010 surveys, and, yet, 2010 incomes were meaningfully higher than in 2005. Additionally, in 2010 there was no indication of a rise in unemployment among clinical neuropsychologists. Nevertheless, in 2025, to the extent that interest is ongoing, we can confidently use the portion of the 2020 database prior to March 13, 2020 for pre-pandemic comparisons. At present, readers can find neuropsychological practice information pertinent to the pandemic in recent issues of The Clinical Neuropsychologist (e.g. Marra et al., Citation2020; Postal et al., Citation2020).
Each of the three major membership organizations that sponsored this survey project in 2015 and again in 2020 appear to have a strong and enduring place in the specialty, each serving important general professional education and advocacy needs for U.S. and Canadian neuropsychologists. In the next iteration of this survey, one can imagine that these particular funding sources no longer need to be named in the project title, which at present could give the erroneous impression that the survey serves only their organizational needs, rather than the needs of all practicing neuropsychologists, whether members or not. Related, INS has a similar role in the U.S. and Canada, with a larger global involvement. Funding for this recurring project has been required in recent iterations because of its size and scope, related to which the activities of the survey team span a very substantial professional time commitment over a two- year period. In 2025, funding could be sought more broadly than from large general membership organizations, such as AACN, NAN, and SCN, given that specific survey coverage affects the missions of smaller specialty organizations as well (e.g. the interest of the Association of Postdoctoral Programs in Clinical Neuropsychology (APPCN) in tracking postdoctoral experiences, this year published separately).
The topic of gender will undoubtedly continue to be of interest in 2025. However, the vantage point of that interest, even statistically, will likely pivot somewhat to the male side. That is, as the entrance of male neuropsychologists into the specialty continues to decline, questions will emerge regarding areas of practice that still show continued, even if diminishing, participation by male neuropsychologists. Unfortunately, in 2025, it is very likely that there will be continued evidence of a gender pay gap within the specialty, which is very likely to remain and is most likely tied to societal roles and social policy. That said, there is currently a strong interest in understanding the participation of women in clinical neuropsychology (cf. Rohling et al., Citation2020), which the current survey team will pursue in separate publication.
Beyond gender, involvement in the specialty of clinical neuropsychology that reflects increased ethnic/racial diversity will also continue to be of interest in 2025. The 2020 seminal events in the U.S. relevant to social unrest and social injustice have elevated and transformed psychology’s previously more scholarly and broad interest in, and support for, social justice and equality into an unadulterated position of stronger engagement and advocacy. All four major neuropsychological organizations have identified and stated their awareness of these important issues and their intent to make a positive difference in the future. INS initially distributed a statement by email in June 2020, and by the time the present survey publication is available in print form will have posted an official statement on the INS website (https://www.the-ins.org/). INS has also established a Justice and Equity Task Force. Readers can find the statements from AACN and NAN related to antiracism at the following web pages:
AACN:
https://theaacn.org/aacn-abcn-statement-on-racial-justice/
NAN:
Antiracism statement https://nan.informz.net/informzdataservice/onlineversion/ind/bWFpbGluZ2luc3RhbmNlaWQ9Nzk1OTI1NSZzdWJzY3JpYmVyaWQ9Nzc2MTQwMTI2
Organization statements and resources related to ethnic/racial and cultural diversity can be found at the following web pages:
AACN: https://theaacn.org/relevance-2050/
SCN: Ethnic Minority Affairs Committee https://scn40.org/piac-ema/
In order to maintain and potentially improve the relevance of clinical neuropsychology to society, the sharpening and heightening of our specialty's focus on these issues will undoubtedly remain in 2025 and beyond.
Terms used to identify ethnicity and race have changed over time. For the sake of our own comparisons across surveys, we have typically maintained the original terms we used years ago or stayed close to those terms. However, in 2025, in order to facilitate direct comparisons with the overall US population, the surveyors will need to use the same terms to identify ethnic/racial groups as are used by the U.S. government.
To date, the survey content has become increasingly broader. For example, the present iteration included a set of specific questions of interest to the APA Health Care Financing Office, based on communications with Director, Dr. Stephen Gillaspy. In fact, specific funding was provided to support this portion of the survey. Such targeted questions about key details of business operations and practice experiences (e.g. CPT code experiences, use of paid technicians, telehealth, Medicare participation, third party payor effects on practice) are likely to become even more important in 2025. As these and other topics come to the fore of attention among specialists in clinical neuropsychology, increased elimination of broader survey queries and entire topics carried forward for comparison purposes from past surveys will occur (e.g. elimination of the topic of retirement after the 2015 survey). Even topics that remain salient may well be reduced in coverage in 2025, if they continue to produce stable results over time, as has occurred for career satisfaction ratings in 2015 and 2020. Secondarily, because new items have been added with each iteration, the overall survey item pool will need to be substantially reduced in 2025 to assure a high level of interest and participation by busy practitioners.
TCN-OA_20-251-File001.docx
Download MS Word (139.8 KB)Acknowledgments
The survey team is grateful and extends thanks for the cooperation and assistance of the sponsoring organizations, as well as numerous other organizations and individuals who assisted in distributing invitations to participate in the survey. These organizations include the Association of Postdoctoral Programs in Clinical Neuropsychology, International Neuropsychological Society, Be Ready for Accreditation in Clinical Neuropsychology, AACN’s Pediatric Neuropsychology Special Interest Group, the NPSYCH listserv, and numerous regional and state neuropsychology organizations. Finally, the survey team wishes to thank all the respondents who took time to participate.
Disclosure statement
No potential conflict of interest was reported by the authors.
Correction Statement
This article has been republished with minor changes. These changes do not impact the academic content of the article.
Additional information
Funding
References
- Baron, I., Wills, K., Rey-Casserly, C., Armstrong, K., & Westerveld, M. (2011). Pediatric neuropsychology: Toward subspecialty designation. The Clinical Neuropsychologist, 25(6), 1075–1086. https://doi.org/10.1080/13854046.2011.594455
- Byrd, D., Razani, J., Suarez, P., Lafosse, J. M., Manly, J., & Attix, D. (2010). Diversity Summit 2008: Challenges in the recruitment and retention of ethnic minorities in neuropsychology. The Clinical Neuropsychologist, 24(8), 1279–1291. https://doi.org/10.1080/13854046.2010.521769
- Cox, D. (2010). Board certification in professional psychology: Promoting competency and consumer protection. The Clinical Neuropsychologist, 24(3), 493–505. https://doi.org/10.1080/13854040902802947
- Division 40 Executive Committee. (1989). Definition of a Clinical Neuropsychologist. The Clinical Neuropsychologist, 3, 22.
- Fernandez, L. (2019). Modern neuropsychological tests for a diversity of cultural contexts. The Clinical Neuropsychologist, 33(2), 438–445. https://doi.org/10.1080/13854046.2018.1560501
- Fujii, D. E. M. (2018). Developing a cultural context for conducting a neuropsychological evaluation with a culturally diverse client: The ECLECTIC framework. The Clinical Neuropsychologist, 32(8), 1356–1392. https://doi.org/10.1080/13854046.2018.1435826
- Guterbock, T. M., & Marcopulos, B. A. (2020). Survey methods for neuropsychologists: A review of typical methodological pitfalls and suggested solutions. The Clinical Neuropsychologist, 34(1), 13–31. https://doi.org/10.1080/13854046.2019.1590642
- Hammers, D. B., Stolwyk, R., Harder, L., & Cullum, C. M. (2020). A survey of international clinical teleneuropsychology service provision prior to and in the context of COVID-19. The Clinical Neuropsychologist, 34(7-8), 1267–1283. https://doi.org/10.1080/13854046.2020.1810323
- Hannay, J., Bieliauskas, L., Crosson, B., Hammeke, T., Hamsher, K., & Koffler, S. (1998). Proceedings of the Houston Conference on specialty education and training in clinical neuropsychology. Archives of Clinical Neuropsychology, 13, 157–250.
- Lucas, J. A., Mahone, E. M., Westerveld, M., Bieliauskas, L., & Baron, I. S. (2014). The American Board of Clinical Neuropsychology and American Academy of Clinical Neuropsychology: Updated milestones 2005-2014. The Clinical Neuropsychologist, 28(6), 889–906. https://doi.org/10.1080/13854046.2014.935484
- Marcopulos, B. A., Guterbock, T. M., & Matusz, E. F. (2020). Survey research in neuropsychology: A systematic review. The Clinical Neuropsychologist, 34(1), 32–55. https://doi.org/10.1080/13854046.2019.1590643
- Marra, D. E., Hoelzle, J. B., Davis, J. J., & Schwartz, E. S. (2020). Initial changes in neuropsychologists’ clinical practice during the COVID-19 pandemic: A survey study. The Clinical Neuropsychologist, 34(7-8), 1251–1266. https://doi.org/10.1080/13854046.2020.1800098
- Martin, P., Schroeder, R., & Odland, A. (2015). [Formula: see text]Neuropsychologists’ validity testing beliefs and practices: A survey of North American professionals. The Clinical Neuropsychologist, 29(6), 741–776. https://doi.org/10.1080/13854046.2015.1087597
- Mindt, M., Byrd, D., Saez, P., & Manly, J. (2010). Increasing culturally competent neuropsychological services for ethnic minority populations: A call to action. The Clinical Neuropsychologist, 24, 429–453. https://doi.org/10.1080.13854040903058960
- Morrison, C. (2020). AACN President’s annual statement of the academy report. The Clinical Neuropsychologist, 34(1), 1–12. https://doi.org/10.1080/13854046.2019.1694704
- Postal, K. S., Bilder, R. M., Lanca, M., Aase, D. M., Barisa, M., Holland, A. A., Lacritz, L., Lechuga, D. M., McPherson, S., Morgan, J., & Salinas, C. (2020). Inter-Organizational practice committee guidance/recommendation for models of care during the novel coronavirus pandemic. The Clinical Neuropsychologist. https://doi.org/10.1080/13854046.2020.1801847
- Putnam, S. (1989). The TCN salary survey: A salary survey of neuropsychologists. The Clinical Neuropsychologist, 3(2), 97–115. https://doi.org/10.1080/13854048908403283
- Rohling, M. L., Ready, R. E., Dhanani, L. Y., & Suhr, J. A. (2020). Shift happens: The gender composition in clinical neuropsychology over five decades. The Clinical Neuropsychologist. https://doi.org/10.1080/13854046.2020.1778791
- Romero, H. R., Lageman, S. K., Kamath, V. V., Irani, F., Sim, A., Suarez, P., Manly, J. J., & Attix, D. K, Summit Participants. (2009). Challenges in the neuropsychological assessment of ethnic minorities: Summit proceedings. The Clinical Neuropsychologist, 23(5), 761–779. https://doi.org/10.1080/13854040902881958
- Sweet, J., Giuffre Meyer, D., Nelson, N., & Moberg, P. (2011). The TCN/AACN 2010 “Salary Survey”: Professional practices, beliefs, and incomes of U.S. neuropsychologists. The Clinical Neuropsychologist, 25(1), 12–61. https://doi.org/10.1080/13854046.2010.544165
- Sweet, J. J., Klipfel, K. M., Nelson, N. W., & Moberg, P. J. (in press). Professional Practices, Beliefs, and Incomes of Postdoctoral Trainees: The AACN, NAN, SCN 2020 Practice and “Salary Survey.” Archives of Clinical Neuropsychology.
- Sweet, J., Nelson, N., & Moberg, P. (2006). The TCN/AACN 2005 “Salary Survey”: Professional practices, beliefs, and incomes of U.S. neuropsychologists. The Clinical Neuropsychologist, 20(3), 325–364. https://doi.org/10.1080/13854040600760488
- Sweet, J. J., Benson, L. M., Nelson, N., & Moberg, P. (2015). The American Academy of Clinical Neuropsychology, National Academy of Neuropsychology, and Society for Clinical Neuropsychology (APA Division 40) 2015 TCN professional practice and 'Salary Survey': Professional practices, beliefs, and incomes of U.S. neuropsychologists. The Clinical Neuropsychologist, 29(8), 1069–1162. https://doi.org/10.1080/13854046.2016.1140228
- U.S. Census Bureau. (2011). Table 2. Intercensal estimates of the resident population by sex race and Hispanic origin for the United States: April 1, 2000 to July 1, 2010. Release date September 2011. Downloaded from www.census.gov on August 20, 2020.
- U.S. Census Bureau. (2019). Table 1. Population by sex, age, Hispanic origin, and race: 2019. Current Population Survey, Annual Social and Economic Supplement, 2019. Downloaded from www.census.gov on August 20, 2020.
- Young, J. C., Roper, B. L., & Arentsen, T. J. (2016). Validity testing and neuropsychology practice in the VA healthcare system: Results from recent practitioner survey (.). The Clinical Neuropsychologist, 30(4), 497–514. https://doi.org/10.1080/13854046.2016.1159730