
 ?Mathematical formulae have been encoded as MathML and are displayed in this HTML version using MathJax in order to improve their display. Uncheck the box to turn MathJax off. This feature requires Javascript. Click on a formula to zoom.
Abstract
Objective: To generate normative data (ND) for executive functions tests in the Waranka minority population of Ecuador. Method: Four-hundred participants aged 6–17 completed the Symbol-Digit Modalities Test (SDMT), Trail-Making Test (TMT), Modified-Wisconsin Card Sorting Test (M-WCST), and Test of Colors-Words (STROOP). Scores were normed using multiple linear regressions, including age, age2, natural logarithm of mean parent education (MPE), sex, bilingualism, and two-way interactions as predictors. Results: Age by MPE and Age2 by MPE interactions arose for SDMT, so that children with illiterate parents scored lower than those with literate parents. Girls scored higher in SDMT. All TMT and M-WCST scores were influenced by age2. Age by MPE interaction was found for TMT–A, so that children with higher MPE went faster; and age by bilingualism interaction for TMT–B, so that more bilingual children needed less time. Stroop-Word and Color were influenced by age2 by MPE interaction, so that children, while older, scored higher, especially those with higher MPE. Also, age2 by sex interaction arose, so that girls increased scores curvilinearly while boys linearly. Word-Color was influenced by age, while Stroop-interference by age2. Age by MPE interaction was found for MCST-Categories and Perseveration, so that perseverations decreased to then increased, especially in those with illiterate parents. M-WCST-Category scores increased to then decrease later on age in children with illiterate parents. Z-scores calculated through indigenous ND were significantly lower than generated through non-indigenous norms. Conclusions: ND for minority populations are critical since Waranka sample performed worse when using non-indigenous norms for z-score calculation.
Introduction
Executive functions (EF) encompass a set of cognitive functions (e.g. attentional control, working memory, inhibition, or cognitive flexibility) that allow the planning and organization of goal-directed behavior (Lezak et al., Citation2012; Muir et al., Citation2023; Stuss, Citation2011). EF development occurs during childhood and adolescence, parallel to the maturation of the human brain, especially the frontal lobes (Petersen & Posner, Citation2012; Posner & Petersen, Citation1990; Ribeiro et al., Citation2023). Indeed, recent evidence suggests that adequate EF development depends on coordinated changes in large-scale functional organization in the brain systems of ventral attention, dorsal attention, and frontoparietal control (Keller et al., Citation2022). It also requires an appropriate balance between an integrated connectivity and a segregated connectivity pattern (Lopez et al., Citation2020; Wang et al., Citation2020). Integration between areas would allow more efficient neural communication (Baum et al., Citation2020; Oligschläger et al., Citation2017), while segregation would enable more specialized processing (Chen et al., Citation2017; Murphy et al., Citation2019).
Adequate EF during childhood and adolescence is a hallmark of healthy development, may be important for resilience to psychopathology (Keller et al., Citation2022), and is essential for adaptive behavior, particularly in novel situations with complex task demands. Deficits in any of the EF domains are found in several disorders such as traumatic brain injury (e.g. Shah et al., Citation2017), attention deficit hyperactivity disorder (e.g. Kingdon et al., Citation2016), autism spectrum disorder (e.g. Christoforou et al., Citation2023), learning difficulties (e.g. Pullen et al., Citation2023) and conduct disorder (e.g. Gioia et al., Citation2002). Furthermore, deficits in EF are prominent in almost all mental illnesses, suggesting that poor EF may be a transdiagnostic vulnerability factor for various forms of psychopathology (Shanmugan et al., Citation2016).
Currently, neuroimaging techniques may fail in detecting brain network deficits crucial for EF (Horowitz-Kraus et al., Citation2023). In turn, an adequate neuropsychological assessment that includes EF tests might allow clinicians to detect deficits in different domains of EF in childhood and adolescence. Among Latin American neuropsychologists, the most widely used instruments are the Modified Wisconsin Card Sorting Test (M-WCST), Stroop Color and Word Test (SCWT), Trail Making test (TMT), and Digit and Symbol Modalities Test (SDMT) (Oliveras-Rentas et al., Citation2020). Several studies have been conducted to generate normative data for children and adolescents for these tests in Spanish-speaking countries, including Spain (e.g. del Pino et al., Citation2016; Peña-Casanova et al., Citation2009, Citation2012), Argentina, Bolivia, Chile, Cuba, El Salvador, Guatemala, Honduras, Mexico, Paraguay, Perú and Puerto Rico (e.g. Arango-Lasprilla et al., Citation2015a, Citation2015b, Citation2015c; Rivera et al., Citation2015).
Neuropsychology in Ecuador is currently growing, with greater availability of services and research efforts (Ramos-Galarza, Citation2017). In Citation2021, Rodríguez-Lorenzana et al. provided specific normative data for the aforementioned tests of attention and EF in Ecuadorian adults. It was an important milestone with relevant clinical and research implications for the country because due to the lack of normative data in Ecuador, many neuropsychologists used norms from other countries, which may not hold for Ecuadorians (Mascialino et al., Citation2022). However, their sample was composed of monolingual people from urban areas in the metropolitan district of Quito, which could lead, as they acknowledge, to the overestimation or underestimation of normative data from other population areas of Ecuador (Rodríguez-Lorenzana et al., Citation2020). Although Spanish is the official language, approximately 34% of the population is indigenous and speak their own languages (around 18 native languages), with Kichwa/Quichua (86.2%) being the predominant one (Haboud et al., Citation2016).
Bilingualism influence on EF measures is still on debate. Recently, a systematic review conducted by Giovannoli et al. (Citation2020) concluded that the current evidence is not enough to sustain the existence of a bilingual effect, or even to identify the factors involved in the bilingual effect, mostly due to the wide differences between the studies (e.g. sample size, neuropsychological tests, methodological aspects, EF subdomains measured). Moreover, bilingual effect is difficult to study as bilingual populations included in the studies differ (e.g. language competence, use, exposure) (Leivada et al., Citation2021), and also because bilingualism has been treated as categorical variable when it is not (Anderson et al., Citation2020).
There is a particular dearth of standards for underrepresented minority (URM) populations (Mindt et al., Citation2019). The evidence suggests that the use of neuropsychological tests, even those with good psychometric properties, in these populations entails measurement errors in, for example, diagnosis and interpretation of the results (Antinori et al., Citation2007). It is well known that a different cultural background will result in the development of different patterns of abilities (Ardila & Moreno, Citation2001). This is particularly problematic because studies such as Valcour et al. (Citation2006) and Shimizu et al. (Citation2011) found a significant association between minority status and worse neurocognitive outcomes.
Also, most neuropsychological tests have been developed according to Western culture values, so the constructs that are relevant for Western culture may not be for others. Given the impact that culture has on cognitive test performance (Al-Jawahiri & Nielsen, Citation2021; Li et al., Citation2022; Mendoza et al., Citation2022), the generation of normative data for non-Western populations becomes essential (Ardila et al., Citation2010; Fujii, Citation2018).
In fact, Fujii (Citation2018) reported that cross-cultural neuropsychological evaluation should not be limited to quantitative factors, but also to cultural factors included in his ECLECTIC model. These factors are, first, level and quality of education, with special attention to illiterate population, as these people may not be familiar with neuropsychological testing that fit more with a Western academic environment (Ardila et al., Citation2010). Second, acculturation, as the closer a URM culture is to Western culture, the more valid the test will be (Arentoft et al., Citation2015; Boone et al., Citation2007; Coffey et al., Citation2005; Flores et al., Citation2017). Third, language, considering how many languages the people speak and which is(are) their main language(s). Economic level of the country is other relevant factor, as well as communicative style, that is, whether the people remain silent out of shame or out of respect for the authority that the neuropsychologist constitutes. The last two factors are the testing situation (the familiarity they may have with this type of evaluation) and the culture's conception of intelligence (whether or not the functions evaluated are relevant for them).
There are very few studies that explore neuropsychological performance in URM in Latin America and they are mostly limited to the 2000s. In 2001, Ardila & Moreno administered a set of neuropsychological tests, including the M-WCST, to a sample of 20 indigenous people from Arauco, Colombia. They found that, on some tests, indigenous people's performance was adequate, while in others (e.g. M-WCST) participants were unable to understand the task, and, therefore, it was impossible to administer. Educational level, age, and cultural relevance were related to performance such that the higher the education level, the younger the age, and the more the test was culturally meaningful and relevant, which lead to better understanding of the task, the better participants performed.
Ostrosky-Solís et al. (Citation2004b) analyzed the influence of education and culture on the NEUROPSI test battery in a sample Maya indigenous people compared to non-indigenous people from Mexico. They found that illiterate indigenous people showed better performance in visuoperceptive tasks, but worse performance in verbal memory. Similar results were obtained when exploring the performance of 7 non-indigenous, 14 Maya and 6 indigenous Pame people from Mexico. Illiterate indigenous people showed better performance in visuoperceptive and constructive tasks, but lower scores in verbal memory compared to non-indigenous illiterate people. Moreover, Maya indigenous people with 1 to 4 years of education obtained higher scores in visual detection, visual memory and delay verbal memory compared to Maya indigenous people with no education (Ostrosky-Solís et al., Citation2004a). In both studies, the results were explained in terms of the demands imposed by the cultural environment or education. In this lens, skills related to verbal memory are not used in the daily life of indigenous people, but visuospatial skills are of great relevance. On the contrary, in the urban context, skills related to verbal memory are used to a greater extent than visuoperceptive skills. Finally, Fierro et al. (Citation2018) studied the performance of 29 indigenous adolescents from Guaranda, Ecuador on the NEUROPSI test battery. They found participants performed below what was expected according to age and level of education in language, attention and reading. In contrast, orientation and writing were within normal ranges.
As can be seen, studies that address the influence of culture on the neuropsychological profile of URM populations have shown a different performance pattern compared to non-indigenous people. Therefore, collecting normative data specific to URM is essential. For these reasons, the purpose of this study was to generate normative data for four tests that evaluate EF in a group of 400 children and adolescents from the Ecuadorian indigenous community of Waranka. The Waranka people are geographically distributed in the Bolívar province of Ecuador. They are located at an altitude of 2500 to 3500 meters above sea level. They represent 40% of the total population of Bolívar, are distributed in 216 communities, and their native language is Northern Quichua (CONAIE, Citation2014). Waranka children and adolescents attend to intercultural bilingual schools, where teaching is taught in Spanish and Kichwa/Quichua. It integrates an intercultural vision in accordance with the geographical, cultural and linguistic diversity of the country. It promotes the respect, care and preservation of communities and nationalities identities (Constitución de la República del Ecuador [Constitution of The Republic of Ecuador], 2021).
Method
Participants
The sample consisted of 417 healthy indigenous children and adolescents who were recruited from the Waranka indigenous community of Ecuador. Two participants were removed due to incomplete information; therefore, the final sample size was 415. The majority of the sample was female (53.7%), the age average was 11.66 (SD = 3.23), and all attended public intercultural schools. The mean parent education (MPE) was 7.9 (SD = 3.61) years. Households reported an average income of US$299.52, (SD = US$197.74; Median = US$245; range = US$50–US$1700). Participants lived at an altitude between 2980 to 4250 meters above sea level.
Bilingualism was assessed using the Language and Social Background Questionnaire (LSQB) for children (Anderson et al., Citation2020) that includes questions about languages' proficiency, use and exposure. A composite score is calculated by computing the sum of these domains, ranging from 0 to 15, with higher composite score values corresponded to more balanced bilingualism (Anderson et al., Citation2020). Language proficiency mean score was 1.66 (SD = 0.81; range = 0.60–3); mean use score was 2.34 (SD = 1.54; range = 0–6), mean exposure score was 2.87(SD = 1.56, range = 0–6), and mean total composite score was 6.88 (SD = 3.45; range = 1–15). More demographic characteristics of the sample are shown in .
Table 1. Demographic characteristics of the sample (N = 415).
To be eligible for study, all participants must have met the following requirements: a) be between 6 to 17 years old, b) be born and live in the Waranka indigenous community, c) have an IQ ≥80 on the Test of Non-verbal Intelligence (TONI-2; Brown et al., Citation2000), and d) have a score of <19 on the Children's Depression Inventory (CDI; Kovacs, Citation1992). Participants were excluded if they reported: (a) learning problems, (b) a history of psychoactive substance use (among adolescents), and (c) a score < 5 in the Alcohol Use Disorder Identification Test (AUDIT-C; Bush et al., Citation1998).
Measures
Symbol digit modalities test (SDMT; Smith, Citation2002)
The SDMT is an experimental task for the detection of possible brain dysfunctions in children and adults (Ramos-Galarza et al., Citation2018). It evaluates processing speed, visual-motor coordination, divided memory, and attention. The test takes 90 s to scan an array of symbols and substitute them with a number associated with each symbol (Arango-Lasprilla et al., 2017a). The total score is the number of correct substitutions from 0 to 110.
Trail making test (TMT A-B; Reitan & Wolfson, Citation1985)
The TMT evaluates attentional processes and visual-motor tracking (Lezak, Citation1995). The TMT is a brief paper-and-pencil test, consisting of two parts: TMT-A and B. In the first part, the participant must draw a line, as fast as possible, connecting 25 numbers in ascending order. In TMT-B, the participant alternates between numbers and letters (1-A, 2-B, 3-C, etc.), which is significantly more difficult than part A (Drane et al., Citation2002). The final score is the time, in seconds, to complete the task in each part.
Modified Wisconsin card sorting test (M-WCST; Schretlen, Citation2010)
The M-WCST is considered a complex planning and execution test that assesses EF (Arango-Lasprilla et al., Citation2017b). The test is individual, does not require previous training, and does not have a time limit, although it usually lasts between 10 and 15 min. The M-WCST contains 48 attribute cards and 4 stimulus cards to assess perseveration and abstract reasoning. Scores are obtained for the number of correct categories, number of perseverative errors, and total number of errors (Schretlen, Citation1997).
Test of colors and words (STROOP; Golden, Citation2007)
The Stroop test measures different aspects of EF, such as cognitive flexibility, information processing speed, selective attention, and cognitive inhibition (Rivera et al., Citation2017). The test consists of 100 stimuli, divided into three parts. In the first part, the participant must read as many words as possible in 45 s, where the score is the number of words read correctly. In the second part, the number of correctly named color items is scored. Finally, in the third part, the participants must name the color of the ink, inhibiting the reading of the word, so that an interference index is calculated.
Procedure
The participants completed the following tests as a part of a neuropsychological battery: SDMT, TMT, M-WCST, and Stroop. Several methods were used to reduce bias and maintain consistency, such as randomizing the order in which the tests were administered to each participant and using a template in Microsoft Excel to limit biased input information. This study was approved by the Ethics Committee of the Public University of Navarre, considering the declaration of Helsinki.
The research group from Public University of Navarre trained the data collection research group from Ecuador, led by M.J., a neuropsychologist researcher, in the administration and scoring of the test. For recruitment, the research team first made an appointment with community leaders to explain the project. Once community leaders accepted, they called the parents from the community so that the researcher could explain the study and answer questions about the process. The parents/guardians who agreed to participate signed the informed consent and completed a sociodemographic, medical history, and health status questionnaire for their child.
The test was administered individually in the intercultural bilingual schools and lasted approximately between 90 and 120 min. Data collection started in July 2022 and ended in December 2022. All the participants were volunteers and received no financial compensation.
Statistical analyses
Demographic variables' effect on neuropsychological performance
The sample was divided into sub-sample 1 (n = 337) and sub-sample 2 (n = 78) for cross-validation. This is a method that helps to ensure the accuracy of model predictions with new data that have not been used to create the model. Subsample 1 was used to determine the effects of demographic variables on the SDMT, the TMT A-B, the Stroop Color and Word Test (Total Word, Total Color, and Word-Color interference), and the M-WCST (Categories, Perseverations, and Total Errors) using means of multiple linear regression analyses (Rivera et al., Citation2017, Citation2019, 2021), where for each test scores were assumed as and
. The full regression models included the following predictors: age, age2, ln(MPE), sex, bilingualism, and two-way interactions between these variables. To avoid multicollinearity, age and quadratic age were calculated through orthogonal polynomials of second-degree, warranting the independence assumption between covariables (Kennedy & Gentle, Citation1980). Natural logarithm (ln) of MPE was examined assuming that scores do not increase linearly as a function of MPE; instead each MPE one-point increase supposed a slower neuropsychological score increase each time. Given that illiterate people were included (MPE = 0), and natural logarithm of 0 is minus infinitive, a constant (
) was included for each MPE value. Sex was coded as girls = 0 and boys= 1, and treated as factor. This equation represents the full regression model: Yi = β0 + βi ⋅ (age)i + β2 ⋅ (age)i2 + β3 ⋅ [In(MPE)i] + β4 ⋅ (sex)i + β5 ⋅ (bilingualism)i + βk ⋅ Interactionsi + εi, with the term
referring to all two-way interactions between the fixed effects. The model assumes that the residuals
are normally distributed with mean 0 and variance
, i.e.
. A square root or natural logarithm transformation was used for the control of the lack of normality in the models.To select the predictors of the final model, we used the best subset selection method. Best subset selection involves trying out all possible combinations of the p predictors (
, assessing their goodness of fit using performance metrics, and selecting the model with the best performance as the final model. This study used the performance metrics Bayesian information criterion (BIC) (James et al., Citation2013). The following assumptions were evaluated for the multiple linear regression models: (a) the absence of multicollinearity by computing the Variance Inflation Factor (VIF) (≤10) and the collinearity tolerance values (≤1), (b) homoscedasticity by applying the Breusch Pagan test, (c) normality of the standardized residuals by using the Kolmogorov Smirnov test, and (d) a lack of influential values by computing maximum Cook's distance. For a linear regression model's prediction to be as accurate and unbiased as possible, it is important that four key assumptions hold and, if not, transformations will be used to make models fit these assumptions.
Normative data procedure
To generate normative data, we followed the four steps described by Rivera et al. (Citation2019). First, using the final regression model, the predictive value of the score was calculated . Second, the residual value of the model was obtained
. Third, the residual value obtained was standardized
. For the M-WCST Perseverative errors, M-WCST Total errors, and TMT (A and B) scores, it is necessary to multiply the standardized residual value by minus one because a higher score reflects worse performance
. Finally, the percentile value was obtained by using the standard normal cumulative distribution function (if the assumption of normal residuals in the normative sample was fulfilled) or the empirical cumulative distribution function of the standardized values (if the standardized residuals were not normally distributed in the normative sample).
Comparative z-scores
The Z-scores for subsample 2 were calculated using the final regression model obtained from subsample 1. These
were used to perform comparisons between Waranka indigenous people who lived in rural communities in Guaranda versus non-indigenous people from Quito who lived in an urban area (Arango-Lasprilla et al., 2017a, Citation2017b, Citation2017c) using the Wilcoxon signed-rank test. R Project for Statistical Computing for Linux (version 4.3.3; R Development Core Team, Citation2021) was used for all analyses.
Results
Demographic variables' effect on neuropsychological performance
Assumptions
All final models had no multicollinearity (maximum generalized and scaled VIF value was 4.29, which does not exceed the cutoff of 10). The maximum Cook's distance was 0.13, meaning there were no influential values on the models. The Breusch Pagan test suggested homoscedasticity in all models (p' values >.01), except for √SDMT and √Stroop Color. The lack of homoscedasticity in these two models was corrected by estimating the residual standard deviation value in each quartile of the predicted scores in each regression model (see , last column). The Kolmogorov–Smirnov test suggested normality in all models' scores (p' values >.01) except for the √Stroop—interference, ln(M-WCST Categories), and ln(M-WCST Total errors). As a result, the empirical cumulative distribution function of the standardized residual was used for these scores.
Table 2. Final multiple linear regression models.
SDMT
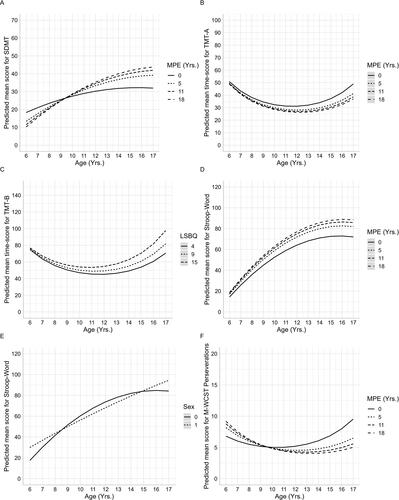
The final multiple linear regression model for √SDMT was significant. Age by ln(MPE), and Age2 by ln(MPE) interactions were found, so that, children with illiterate parents scored higher before age 9, but later their performance stayed below those children with literate parents (see ). Also, sex was related to √SDMT, such that girls achieved higher scores than boys. The predictor model explains 47% ( = .470) of the participants' performance (see ).
Figure 1. Predicted mean scores for test-scores. (A) Predicted mean scores for SDMT as a function of Age by ln(MPE) interaction. (B) Predicted mean scores for TMT-A as a function of Age by ln(MPE) interaction. (C) Predicted mean scores for TMT-B as a function of Age by LSBQ interaction. (D) Predicted mean scores for Stroop-Word test as a function of Age by ln(MPE) interaction. (E) Predicted mean scores for Stroop-Word test as a function of Age by Sex interaction. (F) Predicted mean scores for M-WCST Perseveration as a function of Age by ln(MPE) interaction.Note. SDMT = Symbol Digit Modalities Test; TMT = Trail Making Test; M-WCST = Modified Wisconsin Cart Sorting Test; MPE = Mean Parent Education; LSQB = Language and Social Background Questionnaire.
TMT A-B
The final multiple linear regression models for ln(TMT—A) and ln(TMT—B) were significant. ln(TMT—A) was influenced by quadratic age, and age by ln(MPE) interaction, so that, children with higher MPE went faster than those with less MPE, but around age 11–12 these differences increased (see ). The predictor model explained 18% ( = .185) of the participants' performance. ln(TMT—B) was also affected by quadratic age, and age by bilingualism interaction, so that children with higher bilingualism score at LSBQ needed less time in the task compared those with lower LSBQ score (see ). The predictor model explained 16% (
= .168) of the participants' performance (see ).
Stroop test
The final multiple regression models for √Stroop Word, √Color, and √Color-word scores were significant. √Stroop Word and √Color scores were influenced by age2 by ln(MPE) interaction, so that children, while getting older, achieved higher scores, especially those with higher MPE (see ). Also, age2 by sex interaction arose, so that girls increased their scores curvilinearly while boys linearly (see ). √Color-Word scores were influenced by linear age, while Stroop interference was by age2. The models explained between 50% and 16% of the participants' performance (see ).
M-WCST
The final multiple regression models for the M-WCST ln(Categories) score, ln(M-WCST Perseveration), and ln(Total errors) scores were significant. All scores were affected by age2. Moreover, M-WCST ln(Categories) and ln(M-WCST Perseveration) were affected by age by ln(MPE) interaction, so that perseverations decreased until around aged 9 to then increased, especially in those children with illiterate parents (see ). Regarding M-WCST ln(Categories), number of completed categories increased until around aged 13 to then decrease, for children with literate parents; while in the case of children with illiterate parents, this decreased started later, around 11 years old. The final models explained between 4% and 9% of the participants' performance (see ).
Calculator of normative data
The four-step normative procedure explained above offers the clinician the ability to determine a z-score and percentile for a participant who has a specific test score. To enhance user-friendliness, the authors created a calculator in Microsoft Excel in which the clinician must include the following information: age, education, raw score and sex. This tool is freely available for all users and can be downloaded at https://neuropsychologylearning.com/datos-normativos-archivos-descargables/.
Comparative z-scores
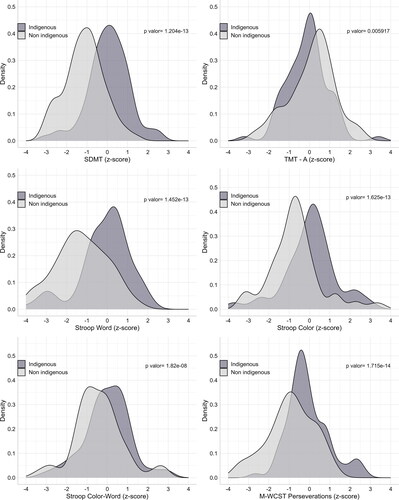
Wilcoxon Signed-Rank Tests showed significant differences between z-score distributions depending on indigenous or non-indigenous normative data used for their estimation (see ). Specifically, z-scores calculated through indigenous normative data were significantly lower (p value were between 1.715 × 10⁻¹⁴ and 5.9 × 10⁻³) in comparison to z-scores generated through non-indigenous norms. Moreover, across all test-scores, the estimated z-scores derived from norms established with the indigenous population were consistently centered around zero. This consistency enhances the reliability of the model, aligning with expectations for a clinically healthy sample.
Figure 2. Comparison between z-scores generated through indigenous versus non-indigenous normative data.
Discussion
Due to the roles that EF play in healthy development for children and adolescents, the importance of neuropsychological tests in measuring EF, and the lack of normative data for these tests among URM populations in Latin America, this study generated normative data for four EF tests (the SDMT, TMT A-B, Stroop Color and Word Test, and M-WCST) from a sample of 400 children and adolescents from the Waranka Ecuadorian indigenous community. We found significant differences between the z-score distribution based on normative data for the Waranka sample compared to the z-score distribution based on non-indigenous normative data for all tests, suggesting the importance of collecting normative data for specific Latin American URM groups. The lower z-score distributions are most likely due to cultural differences that lead to lower performance on neuropsychological tests predominately designed for Western culture rather than neuropsychological deficits, which is consistent with previous research (Al-Jawahiri & Nielsen, Citation2021; Li et al., Citation2022; Mendoza et al., Citation2022). We also found that age and/or squared age were consistent predictors of performance on the four neuropsychological tests such that generally performance increased with age, although we did observe a curvilinear relationship between age and performance on several of the tests. Sex and parental educational levels were not consistent predictors of EF test performance across tests as single variables, although there were some significant interactions between age and parental education for several of the tests and sex and age for the Stroop Word and Color tests, suggesting the importance of collecting these variables for normative data estimation.
In terms of age effects, for the SDMT, quadratic age positively impacted performance, although the effect plateaued around 14–15 years. For the TMT, both parts A and B were associated with quadratic age, displaying a curvilinear relationship between age and scores where scores initially decline until around ages 11–13 and then begin increasing. A quadratic age was associated with better Stroop Word, Color and Color-Word scores, while both age and quadratic age were associated with Stroop Interference. Finally, quadratic age was also a significant predictor of performance on the M-WCST, exhibiting a clear curvilinear pattern where scores decreased until around ages 11–13 and then began increasing after that. While this effect of age on EF performance in children and adolescents is common in the broader neuropsychological literature, the only known study connecting age to EF test performance in indigenous children and adolescents is that of Ardila and Moreno (Citation2001), who found that younger children and adolescents in their indigenous sample from Arauco, Colombia performed better than older adolescents and young adults up to age 30 on many neuropsychological tests, including the M-WCST. However, it is important to note that in their study, the relatively older participants had 0 years of education and were focused on agriculture and household activities, so the effect was likely due to Western cultural socialization rather than age. As a result, the current study's findings are the first in the literature finding either increasing EF with increasing age or a curvilinear relationship between age and scores across several neuropsychological tests in a sample of indigenous children and adolescents, suggesting that age should serve as a covariate in normative assessments with this and similar communities.
In contrast to age, standalone variables for sex and parental educational levels generally were not significantly associated with performance on the various EF tests. This finding corresponds with other studies assessing neuropsychological performance among Latin American URM populations, as none of the other similar studies found sex or parental education level to be important predictors of performance (Ardila & Moreno, Citation2001; Fierro et al., Citation2018; Ostrosky-Solís et al., Citation2004a, Citation2004b). The exception for parental education was the Stroop-Word test, where scores were higher for children whose parents had more education. As found in previous research (Ardila & Moreno, Citation2001; Ostrosky-Solís et al., Citation2004b), these children might have performed better because they were more exposed to a home learning environment or because their parents' level of education was correlated with their own, both of which would better prepare them for cognitive tests and the Western academic environment these tests are modeled after. The exception for sex was the SDMT, where girls performed significantly better than boys. The better performance of girls is consistent with findings from Paraguay and Spain (Arango-Lasprilla et al., Citation2017c; Jinabhai et al., Citation2004). According to Roivainen's (Citation2011) review regarding gender differences in processing speed, these differences may be due to females having better visual processing speed, as well as females having an advantage in reading and writing. In addition, Roivainen (Citation2011) hypothesized that one of the mechanisms by which gender and education affect processing speed is through reading and writing speed.
Regarding interaction terms, for the SDMT, TMT-A, Stroop-Word, M-WCST Preservations, and M-WCST Total Errors tests, parental education had a significant interaction with age, such that children whose parents had more education generally performed better. As discussed above, the increased performance for children whose parents have more education is likely due to their parents' education level being correlated with them having more educational opportunities or schooling, which would better prepare them for cognitive tests (Ardila et al., Citation2010; Ardila & Moreno, Citation2001; Ostrosky-Solís et al., Citation2004b). For the TMT-B test, we found a significant interaction between age and bilingualism, where children with a higher level of bilingualism completed the task faster. While other studies have both not been able to establish a consistent relationship between bilingualism and neuropsychological test performance nor explain why bilingualism might impact performance on these tests (Anderson et al., Citation2020; Giovannoli et al., Citation2020; Leivada et al., Citation2021), our finding highlights the importance of measuring bilingualism when generating normative data for these assessments, and are in line with previous studies that showed the better performance of bilinguals in some EF subdomains (Bialystok et al., Citation2012). We also found a quadratic age and sex interaction for the Stroop Word and Color tests in which female performance increased nonlinearly with age while male performance increased linearly. As discussed above, this finding is consistent with literature identifying that girls perform better than boys on other similar cognitive tests (Arango-Lasprilla et al., Citation2017c; Jinabhai et al., Citation2004; Roivainen, Citation2011).
All models met the assumptions for no multicollinearity and no overly influential values based on the diagnostic tests run. The results from the Breusch Pagan test showed all models were homoscedastic except for the SDMT and Stroop-Word. We corrected this heteroskedasticity by estimating the residual standard deviation value for each quartile of the predicted scores in the affected models. Based on the Kolmogorov-Smirnov test, the standardized residual values of all models followed the normal distribution except for the Stroop—Interference, M-WCST Categories and Total errors. To address this non-normality for these two models, we used the empirical cumulative distribution function of the standardized residual when estimating scores rather than the standard normal cumulative distribution function. We also used a square root transformation and ln(Y) for the test scores so that the data distribution from these models would better fit the standard normal distribution.
Clinical and research implications
One key finding from the present study was that the norms for the Waranka indigenous child and adolescent population on three of the four neuropsychological tests in this study were significantly lower than the non-indigenous population. This highlights the importance for future research to collect normative data for neuropsychological tests for other Latin American URM and indigenous groups. In order for clinicians who work with these populations to obtain the most accurate representations of patients' cognitive abilities, they should calculate their scores for neuropsychological tests based on the norms generated specific to that larger demographic group. To this end, the current study's normative data calculator for the Warankan population can help clinicians input basic demographic information about their patient (age, education, raw score and sex) and receive a z-score and percentile for them on any of the four EF tests considered. These norms could be used for Waranka children and adolescents who live in other regions. Likewise, they could be used for Ecuadorian Kichua/Quichua speakers who present similar sociodemographic data (especially those referring to socioeconomic status, educational level and linguistic competence).
This study would not be possible without a respectful community-based approach to working with the minority community through collaborating with Waranka community leaders. In Ecuador, these leaders respond to their own hierarchical organization (Altmann, Citation2017). They are elected in a general assembly, and their duty is to represent and oversee the wellbeing of their community. Therefore, any activity that is intended to engage the indigenous community must first be approved by these community leaders. Respecting Warankan customs and lifestyle is necessary to promote inclusive and meaningful research. We encourage future research to promote similar community engagement when working with minority communities.
Constraints on generality, limitations and future directions
One limitation of the present study is that it only collected normative data for the Waranka community, so these norms might not apply well to other indigenous Latin American communities. However, if no norms exist, the current norms may be the best available until more accurate norms can be created—in this case, the z-scores and percentages derived for individual patients' performance should be interpreted with extreme caution. Another limitation is that the present study only collected normative data for four neuropsychological tests that assess EF, and there are many other tests that will need to be normed. A final limitation is that the current sample is relatively young with a maximum age of 17, so the normative data collected will not apply to older individuals.
Conclusion
Despite these limitations, the present study underscores the importance of collecting normative data for neuropsychological tests specific to Latin American URM and indigenous groups, as we found the Warankan sample consistently performed worse on three of the four neuropsychological tests considered relative to the non-indigenous population. Given this finding, it is important that researchers collect normative data for other neuropsychological tests and Latin American URM and indigenous populations so that clinicians can better serve these patients by more accurately identifying those at need of additional treatment, supports and rehabilitation. To collect these norms, we recommend neuropsychologists take a similar approach to the present study by building meaningful researcher-community partnerships that foster mutual trust, community engagement and may provide a strong foundation for future clinician-patient relationships. When collecting normative data, it is critical researchers assess the assumptions underlying their regression models and perform transformations to make these assumptions hold when necessary so that the normative data can be as accurate and unbiased as possible. To obtain the best assessment of cognitive ability when working with indigenous patients, clinicians should use norms specific to their demographic group. The normative data calculator we release can aid clinicians in obtaining normalized scores for the Waranka community, and future research should create similar normative data calculators for other Latin American URM populations and neuropsychological tests.
Supplemental Material
Download MS Excel (32.1 KB)Acknowledgements
Open access funding provided by Universidad Pública de Navarra.
Disclosure statement
No potential conflict of interest was reported by the authors.
Additional information
Funding
References
- Al-Jawahiri, F., & Nielsen, T. R. (2021). Effects of acculturation on the cross-cultural neuropsychological test battery (CNTB) in a culturally and linguistically diverse population in Denmark. Archives of Clinical Neuropsychology, 36(3), 381–393. https://doi.org/10.1093/arclin/acz083
- Altmann, P. (2017). Una breve historia de las organizaciones del Movimiento Indígena del Ecuador. Antropología Cuadernos de Investigación, 12(12), 105–121. https://doi.org/10.26807/ant.v0i12.76
- Ardila, A., Bertolucci, P. H., Braga, L. W., Castro-Caldas, A., Judd, T., Kosmidis, M. H., Matute, E., Nitrini, R., Ostrosky-Solis, F., & Rosselli, M. (2010). Illiteracy: The neuropsychology of cognition without reading. Archives of Clinical Neuropsychology, 25(8), 689–712. https://doi.org/10.1093/arclin/acq079
- Arentoft, A., Byrd, D., Monzones, J., Coulehan, K., Fuentes, A., Rosario, A., Miranda, C., Morgello, S., & Rivera Mindt, M. (2015). Socioeconomic status and neuropsychological functioning: Associations in an ethnically diverse HIV + cohort. The Clinical Neuropsychologist, 29(2), 232–254. https://doi.org/10.1080/13854046.2015.1029974
- Anderson, J. A., Hawrylewicz, K., & Bialystok, E. (2020). Who is bilingual? Snapshots across the lifespan. Bilingualism: Language and Cognition, 23(5), 929–937. https://doi.org/10.1017/S1366728918000950
- Antinori, A., Arendt, G., Becker, J. T., Brew, B. J., Byrd, D. A., Cherner, M., Clifford, D. B., Cinque, P., Epstein, L. G., Goodkin, K., Gisslen, M., Grant, I., Heaton, R. K., Joseph, J., Marder, K., Marra, C. M., McArthur, J. C., Nunn, M., Price, R. W., & Wojna, V. E. (2007). Updated research nosology for HIV-associated neurocognitive disorders. Neurology, 69(18), 1789–1799. https://doi.org/10.1212/01.WNL.0000287431.88658.8b
- Arango-Lasprilla, J. C., Rivera, D., Aguayo, A., Rodríguez, W., Garza, M. T., Saracho, C. P., Rodríguez-Agudelo, Y., Aliaga, A., Weiler, G., Luna, M., Longoni, M., Ocampo-Barba, N., Galarza-del-Angel, J., Panyavin, I., Guerra, A., Esenarro, L., García De La Cadena, P., Martínez, C., & Perrin, P. B. (2015a). Trail making test: Normative data for the Latin American Spanish speaking adult population. NeuroRehabilitation, 37(4), 639–661. https://doi.org/10.3233/NRE-151284
- Arango-Lasprilla, J. C., Rivera, D., Garza, M. T., Saracho, C. P., Rodríguez, W., Rodríguez-Agudelo, Y., Aguayo, A., Schebela, S., Luna, M., Longoni, M., Martínez, C., Doyle, S., Ocampo-Barba, N., Galarza-del-Angel, J., Aliaga, A., Bringas, M., Esenarro, L., García-Egan, P., & Perrin, P. B. (2015b). Hopkins verbal learning test–Revised: Normative data for the Latin American Spanish speaking adult population. NeuroRehabilitation, 37(4), 699–718. https://doi.org/10.3233/NRE-151286
- Arango-Lasprilla, J. C., Rivera, D., Longoni, M., Saracho, C. P., Garza, M. T., Aliaga, A., Rodríguez, W., Rodríguez-Agudelo, Y., Rábago, B., Sutter, M., Schebela, S., Luna, M., Ocampo-Barba, N., Galarza-del-Angel, J., Bringas, M. L., Esenarro, L., Mar8Tínez, C., García-Egan, P., & Perrin, P. B. (2015c). Modified Wisconsin Card Sorting Test (M-WCST): Normative data for the Latin American Spanish speaking adult population. NeuroRehabilitation, 37(4), 563–590. https://doi.org/10.3233/NRE-151280
- Arango-Lasprilla, J. C., Rivera, D., Nicholls, E., Aguayo Arelis, A., García De La Cadena, C., Peñalver Guia, A. I., Vergara-Moragues, E., Rodriguez-Lorenzana, A., Marín-Morales, A., Soto-Añari, M., Lara, L., Rodríguez-Agudelo, Y., Alcazar Tebar, C., Galarza-del-Angel, J., Rodriguez-Irizarry, W., Ibañéz-Alfonso, J. A., García-Guerrero, C. E., Delgado-Mejía, I. D., Pohlenz Amador, S., & Sánchez-SanSegundo, M. (2017s). Modified Wisconsin Card Sorting Test (M-WCST): Normative data for Spanish-speaking pediatric population. NeuroRehabilitation, 41(3), 617–626. https://doi.org/10.3233/NRE-172242
- Arango-Lasprilla, J. C., Rivera, D., Ramos-Usuga, D., Vergara-Moragues, E., Montero-López, E., Adana Díaz, L. A., Aguayo Arelis, A., García-Guerrero, C. E., García De La Cadena, C., Llerena Espezúa, X., Lara, L., Padilla-López, A., Rodriguez-Irizarry, W., Alcazar Tebar, C., Irías Escher, M. J., Llibre Guerra, J. J., Torales Cabrera, N., Rodríguez-Agudelo, Y., & Ferrer-Cascales, R. (2017b). Trail making test: Normative data for the Latin American Spanish-speaking pediatric population. NeuroRehabilitation, 41(3), 627–637. https://doi.org/10.3233/NRE-172247
- Arango-Lasprilla, J. C., Rivera, D., Trapp, S., Jiménez-Pérez, C., Hernández Carrillo, C. L., Pohlenz Amador, S., Vergara-Moragues, E., Rodríguez-Agudelo, Y., Rodriguez-Irizarry, W., García De La Cadena, C., Galvao-Carmona, A., Galarza-del-Angel, J., Llerena Espezúa, X., Torales Cabrera, N., Flor-Caravia, P., Aguayo Arelis, A., Saracostti Schwartzman, M., Barranco Casimiro, R., & Albaladejo-Blázquez, N. (2017c). Symbol digit modalities test: Normative data for Spanish-speaking pediatric population. NeuroRehabilitation, 41(3), 639–647. https://doi.org/10.3233/NRE-172243
- Ardila, A., & Moreno, S. (2001). Neuropsychological test performance in Aruaco Indians: An exploratory study. Journal of the International Neuropsychological Society: JINS, 7(4), 510–515. https://doi.org/10.1017/S1355617701004076
- Baum, G. L., Cui, Z., Roalf, D. R., Ciric, R., Betzel, R. F., Larsen, B., Cieslak, M., Cook, P. A., Xia, C. H., Moore, T. M., Ruparel, K., Oathes, D. J., Alexander-Bloch, A. F., Shinohara, R. T., Raznahan, A., Gur, R. E., Gur, R. C., Bassett, D. S., & Satterthwaite, T. D. (2020). Development of structure–function coupling in human brain networks during youth. Proceedings of the National Academy of Sciences, 117(1), 771–778. https://doi.org/10.1073/pnas.1912034117
- Bialystok, E., Craik, F. I., & Luk, G. (2012). Bilingualism: Consequences for mind and brain. Trends in Cognitive Sciences, 16(4), 240–250. https://doi.org/10.1016/j.tics.2012.03.001
- Boone, K., Victor, T., Wen, J., Razani, J., & Ponton, M. (2007). The association between neuropsychological scores and ethnicity, language, and acculturation variables in a large patient population. Archives of Clinical Neuropsychology, 22(3), 355–365. https://doi.org/10.1016/j.acn.2007.01.010
- Brown, L., Sherbenou, R. J., Johnsen, S. K., & de la Cruz, M. V. (2000). TONI-2: Non-verbal intelligence test: Appreciation of cognitive ability without influence of language. Tea Editions.
- Bush, K., Kivlahan, D. R., McDonell, M. B., Fihn, S. D., & Bradley, K. A, Ambulatory Care Quality Improvement Project (ACQUIP). (1998). The AUDIT Alcohol Consumption Questions (AUDIT-C) an effective brief screening test for problem drinking. Archives of Internal Medicine, 158(16), 1789–1795. https://doi.org/10.1001/archinte.158.16.1789
- Chen, Y., Wang, S., Hilgetag, C. C., & Zhou, C. (2017). Features of spatial and functional segregation and integration of the primate connectome revealed by trade-off between wiring cost and efficiency. PLoS Computational Biology, 13(9), e1005776. https://doi.org/10.1371/journal.pcbi.1005776
- Christoforou, M., Jones, E. J. H., White, P., & Charman, T. (2023). Executive function profiles of preschool children with autism spectrum disorder and attention-deficit/hyperactivity disorder: A systematic review. JCPP Advances, 3(1), e12123. https://doi.org/10.1002/jcv2.12123
- Coffey, D., Marmol, L., Schock, L., & Adams, W. (2005). The influence of acculturation on the Wisconsin Card Sorting Test by Mexican Americans. Archives of Clinical Neuropsychology, 20(6), 795–803. https://doi.org/10.1016/j.acn.2005.04.009
- CONAIE. (2014). Confederación de Nacionalidades Indígenas del Ecuador. Recuperado de Waranka: https://conaie.org/2014/07/19/waranka/
- Constitución de la República del Ecuador. (2021). https://jprf.gob.ec/wp-content/uploads/2023/03/1.-Constitucion-de-la-Republica-del-Ecuador-2.pdf
- del Pino, R., Peña, J., Ibarretxe-Bilbao, N., Schretlen, D. J., & Ojeda, N. (2016). Modified Wisconsin Card Sorting Test: Standardization and norms of the test for a population sample in Spain. Revista de Neurologia, 62(5), 193–202.
- Drane, D. L., Yuspeh, R. L., Huthwaite, J. S., & Klingler, L. K. (2002). Demographic characteristics and normative observations for derived-trail making test indices. Cognitive and Behavioral Neurology, 15(1), 39–43.
- Fierro, M., Aguinaga, L., Fierro, S., & Ramos, C, Universidad Estatal de Bolívar. (2018). Evaluación neuropsicológica de funciones cognitivas en adolescentes indígenas escolarizadas. Revista de Investigación Talentos, 5(2), 43–50. https://doi.org/10.33789/talentos.5.83
- Flores, I., Casaletto, K. B., Marquine, M. J., Umlauf, A., Moore, D. J., Mungas, D., Gershon, R. C., Beaumont, J. L., & Heaton, R. K. (2017). Performance of hispanics and non-hispanic whites on the NIH toolbox cognition battery: The roles of ethnicity and language backgrounds. The Clinical Neuropsychologist, 31(4), 783–797. https://doi.org/10.1080/13854046.2016.1276216
- Fujii, D. E. M. (2018). Developing a cultural context for conducting a neuropsychological evaluation with a culturally diverse client: The ECLECTIC framework. Clinical Neuropsychologist, 32(8), 1356–1392. https://doi.org/10.1080/13854046.2018.1435826
- Gioia, G. A., Isquith, P. K., Kenworthy, L., & Barton, R. M. (2002). Profiles of everyday executive function in acquired and developmental disorders. Child Neuropsychology: A Journal on Normal and Abnormal Development in Childhood and Adolescence, 8(2), 121–137. https://doi.org/10.1076/chin.8.2.121.8727
- Giovannoli, J., Martella, D., Federico, F., Pirchio, S., & Casagrande, M. (2020). The impact of bilingualism on executive functions in children and adolescents: A systematic review based on the PRISMA method. Frontiers in Psychology, 11, 574789. https://doi.org/10.3389/fpsyg.2020.574789
- Golden, C. J. (2007). Stroop, colors and words test: Manual (5th ed.). Tea Ediciones, SA.
- Haboud, M., Howard, R., Cru, J., & Freeland, J. (2016). Linguistic human rights and language revitalization in Latin America and the Caribbean. In S. Coronel-Molina & T. McCarty (Eds.), Indigenous language revitalization in the Americas (pp. 201–224). Routledge.
- Horowitz-Kraus, T., Randell, K., & Morag, I. (2023). Neurobiological perspective on the development of executive functions. Acta Paediatrica (Oslo, Norway: 1992), 112(9), 1860–1864. https://doi.org/10.1111/apa.16883
- James, G., Witten, D., Hastie, T., & Tibshirani, R. (Eds.). (2013). An introduction to statistical learning: With applications in R. Springer.
- Jinabhai, C. C., Taylor, M., Rangongo, M. F., Mkhize, N. J., Anderson, S., Pillay, B. J., & Sullivan, K. R. (2004). Investigating the mental abilities of rural Zulu primary school 43 children in South Africa. Ethnicity & Health, 9(1), 17–36. https://doi.org/10.1080/13557850410001673978
- Keller, A. S., Sydnor, V. J., Pines, A., Fair, D. A., Bassett, D. S., & Satterthwaite, T. D. (2022). Hierarchical functional system development supports executive function. Trends in Cognitive Sciences, 27(2), 160–174. https://doi.org/10.1016/j.tics.2022.11.005
- Kennedy, W. J., & Gentle, J. E. (1980). Statistical computing (1st ed.). Routledge.
- Kingdon, D., Cardoso, C., & McGrath, J. J. (2016). Research review: Executive function deficits in fetal alcohol spectrum disorders and attention-deficit/hyperactivity disorder – A meta-analysis. Journal of Child Psychology and Psychiatry, 57(2), 116–131. https://doi.org/10.1111/jcpp.12451
- Kovacs, M. (1992). Children's depression inventory manual. Multi-Health Systems. North Tonawanda.
- Leivada, E., Westergaard, M., Duñabeitia, J. A., & Rothman, J. (2021). On the phantom-like appearance of bilingualism effects on neurocognition: (How) should we proceed? Bilingualism: Language and Cognition, 24(1), 197–210. https://doi.org/10.1017/S1366728920000358
- Lezak, M. D. (1995). Neuropsychological assessment. Oxford University Press.
- Lezak, M., Howieson, D., Bigler, E., & Tranel, D. (2012). Neuropsychological Assessment (5th ed.). Oxford University Press.
- Li, M., Lu, S.-E., Hoover, D. R., Flynn, L., Silverstein, M., Wu, B., & Dong, X. (2022). Family type and cognitive function in older Chinese Americans: Acculturation as a moderator. Aging & Mental Health, 26(8), 1642–1653. https://doi.org/10.1080/13607863.2021.1926426
- Lopez, K. C., Kandala, S., Marek, S., & Barch, D. M. (2020). Development of network topology and functional connectivity of the prefrontal cortex. Cerebral Cortex (New York, N.Y.: 1991), 30(4), 2489–2505. https://doi.org/10.1093/cercor/bhz255
- Mascialino, G., Adana-Diaz, L., Rodriguez-Lorenzana, A., Rivera, D., & Arango-Lasprilla, J. C. (2022). Práctica de la neuropsicología en Ecuador. Revista Ecuatoriana de Neurologia, 31(1), 49–58. https://doi.org/10.46997/revecuatneurol31100049
- Mendoza, L., Garcia, P., Duara, R., Rosselli, M., Loewenstein, D., Greig-Custo, M. T., Barker, W., Dahlin, P., & Rodriguez, M. J. (2022). The effect of acculturation on cognitive performance among older Hispanics in the United States. Applied Neuropsychology: Adult, 29(2), 163–171. https://doi.org/10.1080/23279095.2020.1725888
- Mindt, M. R., Arentoft, A., Coulehan, K., Summers, A. C., Tureson, K., Aghvinian, M., & Byrd, D. A. (2019). Neuropsychological evaluation of culturally/linguistically diverse older adults. In Handbook on the neuropsychology of aging and dementia (pp. 25–48). Springer. https://doi.org/10.1007/978-3-319-93497-6_3
- Muir, R. A., Howard, S. J., & Kervin, L. (2023). Interventions and approaches targeting early self-regulation or executive functioning in preschools: A systematic review. Educational Psychology Review, 35(1), 27. https://doi.org/10.1007/s10648-023-09740-6
- Murphy, C., Wang, H.-T., Konu, D., Lowndes, R., Margulies, D. S., Jefferies, E., & Smallwood, J. (2019). Modes of operation: A topographic neural gradient supporting stimulus dependent and independent cognition. NeuroImage, 186, 487–496. https://doi.org/10.1016/j.neuroimage.2018.11.009
- Oligschläger, S., Huntenburg, J. M., Golchert, J., Lauckner, M. E., Bonnen, T., & Margulies, D. S. (2017). Gradients of connectivity distance are anchored in primary cortex. Brain Structure & Function, 222(5), 2173–2182. https://doi.org/10.1007/s00429-016-1333-7
- Oliveras-Rentas, R. E., Romero-García, I., Benito-Sánchez, I., Ramos-Usuga, D., & Arango-Lasprilla, J. C. (2020). The practice of child neuropsychology in Spanish-speaking countries: What we've learned and where to go from here. Developmental Neuropsychology, 45(4), 169–188. https://doi.org/10.1080/87565641.2020.1721502
- Ostrosky-Solís, F., Ramirez, M., & Ardila, A. (2004a). Effects of culture and education on neuropsychological testing: A preliminary study with indigenous and nonindigenous population. Applied Neuropsychology, 11(4), 188–195. https://doi.org/10.1207/s15324826an1104_3
- Ostrosky-Solís, F., Ramírez, M., Lozano, A., Picasso, H., & Vélez, A. (2004b). Culture or education? Neuropsychological test performance of a Maya indigenous population. International Journal of Psychology, 39(1), 36–46. https://doi.org/10.1080/00207590344000277
- Peña-Casanova, J., Blesa, R., Aguilar, M., Gramunt-Fombuena, N., Gómez-Ansón, B., Oliva, R., Molinuevo, J. L., Robles, A., Barquero, M. S., Antúnez, C., Martínez-Parra, C., Frank-García, A., Fernández, M., Alfonso, V., & Sol, J. M, NEURONORMA Study Team. (2009). Spanish multicenter normative studies (NEURONORMA project): Methods and sample characteristics. Archives of Clinical Neuropsychology: The Official Journal of the National Academy of Neuropsychologists, 24(4), 307–319. https://doi.org/10.1093/arclin/acp027
- Peña-Casanova, J., Casals-Coll, M., Quintana, M., Sanchez-Benavides, G., Rognoni, T., Calvo, L., Palomo, R., Aranciva, F., Tamayo, F., & Manero, R. M. (2012). Estudios normativos espanoles en poblacion adulta joven (Proyecto NEURONORMA jovenes): Metodos y caracteristicas de la muestra. Neurologia, 27(5), 253–260. https://doi.org/10.1016/j.nrl.2011.12.019
- Petersen, S. E., & Posner, M. I. (2012). The attention system of the human brain: 20 years after. Annual Review of Neuroscience, 35(1), 73–89. https://doi.org/10.1146/annurev-neuro-062111-150525
- Posner, M. I., & Petersen, S. E. (1990). The attention system of the human brain. Annual Review of Neuroscience, 13(1), 25–42. https://doi.org/10.1146/annurev.ne.13.030190.000325
- Pullen, J. C., Wolfson, D. I., Totten, D. J., Jeckell, A. S., Bonfield, C. M., Zuckerman, S. L., & Yengo-Kahn, A. M. (2023). Attention-deficit hyperactivity disorder and learning disabilities modify recovery and sport behavior following sport-related concussion. Clinical Pediatrics, 62(2), 121–131. https://doi.org/10.1177/00099228221113787
- R Development Core Team. (2021). R: A language and environment for statistical computing. R Foundation for Statistical Computing. http://www.R-project.org/.
- Ramos-Galarza, C. (2017). El Resurgir de la Neurociencia Ecuatoriana. Revista Ecuatoriana de Neurologia, 26(3), 187–190.
- Ramos-Galarza, C., Acosta-Rodas, P., Jadán-Guerrero, J., Guevara-Maldonado, C. B., Zapata-Rodríguez, M., & Apolo-Buenaño, D. (2018). Evaluación Neuropsicológica de la Atención: Test de Símbolos y Dígitos. Neuropsychological Assessment of Attention: Symbols And Digits Test. Revista Ecuatoriana de Neurología, 27(1), 30–33.
- Reitan, R. M., & Wolfson, D. (1985). The Halstead-Reitan neuropsychological test battery: Theory and clinical interpretation. Neuropsychology Press.
- Ribeiro, M., Yordanova, Y. N., Noblet, V., Herbet, G., & Ricard, D. (2023). White matter tracts and executive functions: A review of causal and correlation evidence. Brain: A Journal of Neurology, 147(2), 352–371. https://doi.org/10.1093/brain/awad308
- Rivera, D., Morlett-Paredes, A., Peñalver Guia, A. I., Irías Escher, M. J., Soto-Añari, M., Aguayo Arelis, A., Rute-Pérez, S., Rodríguez-Lorenzana, A., Rodríguez-Agudelo, Y., Albaladejo-Blázquez, N., García De La Cadena, C., Ibáñez-Alfonso, J. A., Rodriguez-Irizarry, W., García-Guerrero, C. E., Delgado-Mejía, I. D., Padilla-López, A., Vergara-Moragues, E., Barrios Nevado, M. D., Saracostti Schwartzman, M., & Arango-Lasprilla, J. C. (2017). Stroop color-word interference test: Normative data for Spanish-speaking pediatric population. NeuroRehabilitation, 41(3), 605–616. https://doi.org/10.3233/NRE-172246
- Rivera, D., Olabarrieta-Landa, L., Van Der Elst, W., Gonzalez, I., Rodríguez-Agudelo, Y., Aguayo Arelis, A., Rodriguez-Irizarry, W., García De La Cadena, C., & Arango-Lasprilla, J. C. (2019). Normative data for verbal fluency in healthy Latin American adults: Letter M, and fruits and occupations categories. Neuropsychology, 33(3), 287–300. https://doi.org/10.1037/neu0000518
- Rivera, D., Perrin, P. B., Aliaga, A., Garza, M. T., Saracho, C. P., Rodrŕguez, W., Justo-Guillen, E., Aguayo, A., Schebela, S., Gulin, S., Weil, C., Longoni, M., Ocampo-Barba, N., Galarza-del-Angel, J., Rodrŕguez, D., Esenarro, L., García-Egan, P., Martínez, C., & Arango-Lasprilla, J. C. (2015). Brief test of attention: Normative data for the Latin American Spanish speaking adult population. NeuroRehabilitation, 37(4), 663–676. https://doi.org/10.3233/NRE-151283
- Rodríguez-Lorenzana, A., Benito-Sánchez, I., Adana-Díaz, L., Paz, C. P., Yacelga Ponce, T., Rivera, D., & Arango-Lasprilla, J. C. (2020). Normative data for test of verbal fluency and naming on Ecuadorian adult population. Frontiers in Psychology, 11, 830. https://doi.org/10.3389/fpsyg.2020.00830
- Rodríguez-Lorenzana, A., Ramos-Usuga, D., Díaz, L. A., Mascialino, G., Yacelga Ponce, T., Rivera, D., & Arango-Lasprilla, J. C. (2021). Normative data of neuropsychological tests of attention and executive functions in Ecuadorian adult population. Neuropsychology, Development, and Cognition. Section B, Aging, Neuropsychology and Cognition, 28(4), 508–527. https://doi.org/10.1080/13825585.2020.1790493
- Roivainen, E. (2011). Gender differences in processing speed: A review of recent research. Learning and Individual Differences, 21(2), 145–149. https://doi.org/10.1016/j.lindif.2010.11.021
- Schretlen, D. (1997). Brief test of attention professional manual. Psychological Assessment Resources.
- Schretlen, D. J. (2010). M-WCST (modified Wisconsin card sorting test). Psychological Assessment Resources.
- Shah, S. A., Goldin, Y., Conte, M. M., Goldfine, A. M., Mohamadpour, M., Fidali, B. C., Cicerone, K., & Schiff, N. D. (2017). Executive attention deficits after traumatic brain injury reflect impaired recruitment of resources. NeuroImage. Clinical, 14, 233–241. https://doi.org/10.1016/j.nicl.2017.01.010
- Shanmugan, S., Wolf, D. H., Calkins, M. E., Moore, T. M., Ruparel, K., Hopson, R. D., Vandekar, S. N., Roalf, D. R., Elliott, M. A., Jackson, C., Gennatas, E. D., Leibenluft, E., Pine, D. S., Shinohara, R. T., Hakonarson, H., Gur, R. C., Gur, R. E., & Satterthwaite, T. D. (2016). Common and dissociable mechanisms of executive system dysfunction across psychiatric disorders in youth. American Journal of Psychiatry, 173(5), 517–526. https://doi.org/10.1176/appi.ajp.2015.15060725
- Shimizu, S. M., Chow, D. C., Valcour, V., Masaki, K., Nakamoto, B., Kallianpur, K. J., & Shikuma, C. (2011). The impact of depressive symptoms on neuropsychological performance tests in HIV-infected individuals: A study of the Hawaii aging with HIV cohort. World Journal of AIDS, 1(4), 139–145. https://doi.org/10.4236/wja.2011.14020
- Smith, A. (2002). Manual de test de símbolos y dígitos SDMT. Publicaciones de psicología aplicada. TEA ediciones.
- Stuss, D. T. (2011). Functions of the frontal lobes: Relation to executive functions. Journal of the International Neuropsychological Society: JINS, 17(5), 759–765. https://doi.org/10.1017/S1355617711000695
- Valcour, V. G., Sacktor, N. C., Paul, R. H., Watters, M. R., Selnes, O. A., Shiramizu, B. T., Williams, A. E., & Shikuma, C. M. (2006). Insulin resistance is associated with cognition among HIV-1-infected patients: The Hawaii aging with HIV cohort. Journal of Acquired Immune Deficiency Syndromes (1999), 43(4), 405–410. https://doi.org/10.1097/01.qai.0000243119.67529.f5
- Wang, C., Hu, Y., Weng, J., Chen, F., & Liu, H. (2020). Modular segregation of task-dependent brain networks contributes to the development of executive function in children. NeuroImage, 206, 116334. https://doi.org/10.1016/j.neuroimage.2019.116334