Abstract
A basic task in biomechanics is the precise analysis of human movements and the investigation of muscle forces that are responsible for these movements. When using inverse dynamics with a focus on the lower extremities, the knee model type is of major interest, as it is well known that the calculated muscle forces depend on the knee model type. It is essential to use individually parameterized models for the knee joint as well as for the femoropatellar joint while analysing the correlations between external and internal loads and the efficiency of specific training exercises for the lower extremities. It will be shown that different knee model types and femoropatellar model types have a major influence on calculated muscle forces. Within this study the multi-body system model was applied to leg extension movements performed on a leg press machine. Concerning the adjustment of a leg press machine, the following two questions were considered: How should a leg press machine be adjusted for individual exercises taking into account the minimization of knee strain? Does the muscular strain correspond to the load calculated and applied externally? The results of this application show that the knee strain could be reduced by 10% after simulative variation of the boundary conditions given by the leg press machine.
1. Introduction
One aim of sport biomechanics is to analyse the efficiency of training exercises, for example in force training. The muscular capacity is an important factor for joint stability, and its systematic training can avoid, for example, knee injuries considerably. In cases of an existing knee injury, power training is also commonly used in the rehabilitation phase to prevent muscle atrophy and to increase joint stability. To strengthen the leg muscles, training is generally applied using a leg press. The benefit of this appliance lies in the way it guides the movement, which however results in a disproportionate use of certain body parts. The patella is especially prone to symptoms of strain [Citation1]. Therefore, it is necessary to investigate what happens inside the body for different external loads. This quantification of not directly measurable attributes for muscle contractions in sport movements using inverse dynamics leads to further information for the strength training [Citation2,Citation3]. According to this inverse problem leg extension movements in a leg press were analysed using a multi-body system (MBS) model for the musculoskeletal system. With this model, inner forces that were generated by muscles and tendons and that produced this specific movement were determined using the known time histories of the inner coordinates and the external forces. One particular question could be: Are the internal loads comparable to the external ones? As Reinbolt et al. [Citation4] stated, the results of inverse dynamics will not represent the individual situation if joint parameters are not chosen carefully. They showed that results of inverse dynamics for the lower extremities depend more on individual joint parameters and the noise of kinematic input data, than on inertial parameters. It is also well known that the knee model exerts a strong influence on the results of the calculated muscle forces of the Mm. Quadriceps [Citation5]. The consideration of changing leverages within this joint during knee motion only leads to realistic results for calculated muscle forces.
The goal of this study was to develop a leg model for the diagnosis of muscle forces in sports movements using inverse dynamics. Therefore an individualized knee joint model [Citation3] was adapted and implemented in a MBS leg model [Citation6]. Within this study it will be shown how the moving joint axis influences the calculated muscle forces. Furthermore, the model will be applied to investigate the interaction between athlete and leg press machine. By an analysis of the external and internal forces affecting the athlete within the leg press, reserves and limitations for this movement can be detected.
Specific aims of this study were to evaluate
-
C1: the accuracy of a magnetic resonance imaging (MRI)-based knee joint model with respect to the coordinates of the moving joint axis. The results of this approach were compared to the kinematic pole of rotation.
-
C2: the influence of two model types for the femoropatellar joint on the calculated muscle forces of a specific movement. The first model assumed that the patella is moving on a circular path. For the second model, the path for the patella was individually parameterized with a moving joint axis. This comparison was calculated for a knee joint modelled as a hinged joint to minimize the possibility of side effects on the results.
-
C3: the influence of a knee joint modelled as a hinged joint to an individually parameterized model with a moving joint axis on calculated muscle forces. The model with the moving joint axis is described in [Citation6]. In both cases the path for the patella was calculated in the same way using the MRI scans.
-
C4: the influence of different foot positions for leg extension movements within a leg press machine.
2. Methods
To solve the inverse problem for the leg extension movements in a leg press machine, a MBS model for the musculoskeletal system of the lower extremities was defined. With this model, internal forces, generated by muscles and tendons, which produce this specific movement, are determined using the known time histories of the internal coordinates and the external forces. Consequently, the anatomical characteristics of muscles, tendons and joints have to be taken into account, as well as energetic characteristics and neurological control tasks.
A single subject (male: 25 years, height: 187 cm, weight: 77 kg) was used to evaluate the mathematical approaches. A leg press equipped with two force plates in the foot pad and an odometer and velocimeter attached to the sled was used for acquiring the kinematic and kinetic data. The time histories of the angles for the metatarsophalangeal joint, the ankle, the knee joint and the hip joint were detected using videometry (50 Hz). The muscular activity was monitored by a 5-channel electromyogramm. The leg extension movement started with a pre-set position for the feet on the foot pad and a knee angle of 95°. All procedures involving human subjects within this study were approved by the internal review board of Michigan Tech (M0513).
To estimate the specific movements, the Lagrangean equations of motion were integrated for the MBS. Therefore, the MBS Modeller Studio alaska 5.1Footnotewas used. The external forces were measured using dynamometry. The time histories of the analysed movements were gained by video analysis. From these data the inverse kinematics was developed. The time histories for the joint coordinates of the man model DYNAMICUS were calculated as well as the appropriate velocities and accelerations using the dynamic tracking method [Citation7]. The next step was to reproduce the reference movement of the model using Lyapunov-stable dynamic control [Citation8] and estimate the joint reactions.
2.1. Knee joint model
Lever rules were applied to calculate the one-dimensional force of the replacement muscles from the joint moments. For the knee joint, an individually parameterized two-dimensional model was used, which took the moving joint axis (MD) of the femoral–tibial part as well as the femoral–patellar part into account (). The knee was modelled as a planar joint with translations depending on the knee angle. The planar joint was defined by local joint frames fixed on the femur and the tibia. It was assumed that the contact point between femur condylus and tibia is a function of the knee angle only, which means it does not depend on angular velocity.
The input data for this model were extracted from MRI scans in 11 different knee positions.
The outline of the lateral femur condylus was digitized in high resolution. This outline was the input parameter for the knee model that was used in the MBS man model DYNAMICUS for the calculation of the moving joint axis [Citation3,Citation6].
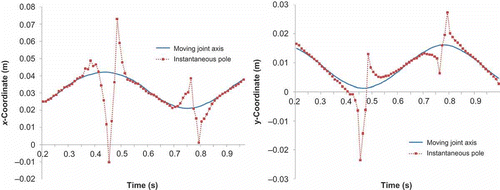
In addition, the instantaneous pole of rotation was calculated. Using MRI scans and motion analysis the motion of the knee may be recorded.
The instantaneous pole of rotation was defined as the femur-fixed point, in which the velocity of a tibia-fixed point temporarily coinciding with it vanishes. Let and
be the motion of the origin of the tibia joint frame with respect to the femur joint frame. Then the coordinates of the instantaneous pole in the tibia joint frame were defined as
One problem of this approach is that the angular velocity has to be unequal to zero, because is the denominator. Therefore, in the turning points of the flexion–extension motion, where the recorded angular velocity became zero, the results of the velocity pole showed discontinuities. A polynomial 10th grade was being used to approximate the resulting location.
The functions obtained from the knee extension motion are stored at discrete times
In view of
the reverse function t(φ) exists. For every
the values of
and their first and second derivatives can be approximated through non-equidistant spline interpolation.
The MBS dynamics simulation tool alaska provides the use of a one-dimensional planar joint with the rotation angle as joint parameter and angle-dependent translations. This joint is used for modelling the knee with moving joint axis. A pre-defined dll has to compute the values of for given
. In case of the knee these are
Note that now can be any twofold continuously differentiable function with values in
describing any knee motion. In each case the one-dimensional planar joint correctly couples the translations
with the rotation angle φ.
2.2. Muscle model
Because of the redundancy of the biological system, the calculations of the muscle forces were simplified by modelling the extending muscles as one single joint replacement muscle for the thigh (Mm. Quadriceps) and the shank (Mm. Triceps).
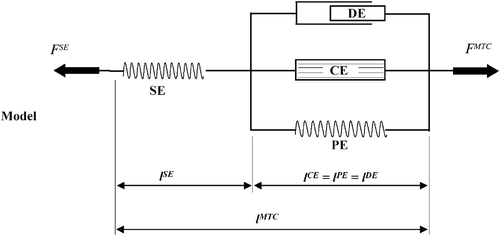
To determine the internal forces, a Hill-type muscle model () was used with a single serial part, that is serial elastic (SE), and three parallel parts, that is parallel elastic (PE), damping element (DE) and contractile element (CE).
Further results of the leg model were length and velocity of the replacement muscles from consideration of their insertion points. To determine the lengths and velocities of the single parts within the muscle model we used a quadratic force rule , hence
Knowing the length and therefore the velocities from inverse dynamics of CE, PE and DE, the forces for PE and DE were calculated. The behaviour of PE was calculated using a quadratic approach and that of DE by a linear approach. The force of SE is the sum of the forces of CE, DE and PE, and henceforth the force of CE can be calculated.
Besides the determination of the actual forces generated within the replacement muscle, the greatest possible force (F_poss) was calculated for this muscle depending on muscle length and contraction velocity as described in full detail in Van Soest [Citation9]. This was necessary for a first estimation of whether the results may show an appropriate solution.
Based on F_poss, the muscle activation was determined using the activation function of Hatze [Citation10,Citation11]:
This model was chosen, because this is the only model taking the length-dependence of active state due to the length-dependent Ca2 + sensitivity into account [Citation12]. The term ρ(l CE ) described the coupling affinity of actinium and myosin depending on muscle length [Citation10] whereas γ determined the rate of change in free Ca2 + taking also the stimulation q(t) into account.
Q is calculated depending on active state q, length of CE and time and ranges between 0 and 1:
The input parameters for F_poss were Hill's parameters a and b and the optimal muscle length. Both parameters were optimized so that they fit the measured data. For the measurements single joint tests were used. Therefore the muscles were tested using different loads to measure the force–velocity relationship as well as isometric tests at different joint angles to quantify the force–length relationship.
2.3. Application to leg extensions in a leg press machine
Starting position was a pre-set position for the feet on the foot pad with a knee angle of 95°.
The following measurements were taken:
-
Quantification of the isometric maximum force in the starting position;
-
Leg extension with a load of 90% (L_90);
-
Leg extension with a load of 70% (L_70).
To measure the ground reaction force (GRF) under isometric conditions the sled was fixed to the bar. For the concentric experiments the external load was excluded from this GRF.
The strain of the knee joint was calculated for the measured movements. To minimize the risk of damages by this strain certainly the reduction of the external load would be the easiest way. Another possibility would be a reallocation of the inner loads in a way that the same external loads could be moved with lower inner peak loads.
The following boundary conditions were varied with respect to specific aim C4 (see ):
-
Contact position on the foot pad: +5 cm, −5 cm, −10 cm
-
Angle of the foot pad: +5°, −5°, −10°.
The time histories of the inner coordinates were readapted weighting the hip joint lower than the others. Thus, nearly the same time histories for the angles of ankle and knee joint in the simulation were achieved. In the farthest alternative with a contact position of −10 cm and angle of −10° the discrepancy between original and actual angles was on an average of 2° for the ankle and knee joint and 6° for the hip joint.
3. Results
3.1. (C1): Accuracy of the knee joint model
The MRI-based model showed only slight differences between the coordinates of the moving joint axis and the kinematic pole, if the angular velocity is unequal to zero.
Discontinuities of the data at the beginning (110° flexion), the middle (0° flexion) and the end (110° flexion) of the motion cycle resulted in an angular velocity ≤1°/s. That led to oscillations and for the equation was unsolvable. This effect exerted more influence on time histories of the x-coordinate with respect to the Femur frame than on the y-coordinate ().
3.2. (C2): Influence of the femoropatellar model
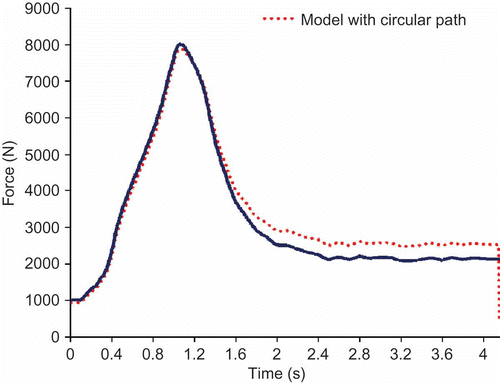
The results of the comparison between different types of patella models showed differences in the calculated muscle forces depending on modified leverages of the patella for the leg extension. The differences scaled up with an increasing knee angle. The calculated force of the Mm. Quadriceps increased up to 500 N for the model with the patella moving on a circular path ().
3.3. (C3): Influence of the knee joint model on calculated muscle forces
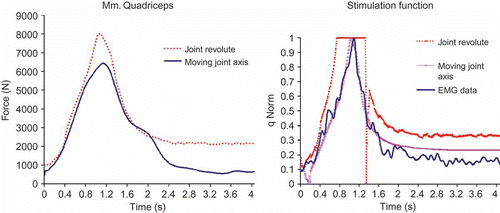
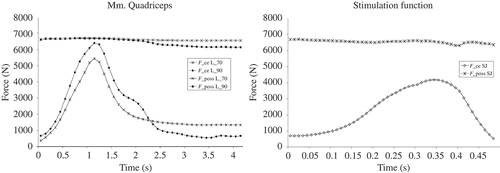
Depending on the type of the knee model, the leverages changed significantly. Figures show the calculated muscle forces for Mm. Quadriceps and the stimulation functions.
The maximum force for the Mm. Quadriceps, when the knee was modelled as hinged joint, was 8014 N. This value was unrealistically high, being around 1300 N higher than the measured maximum force as well as the calculated isometric maximum using Hill's equation for this person (see ).
3.4. (C4): Influence of foot positions on calculated muscle forces for leg extensions in a leg press machine
The load for the isometric maximum was 216 kg. Consequently, the additional weight was 194 kg for L_90 and 144 kg for L_70. In separately conducted single joint tests, a maximum isometric force of 6633 N for the CE of the Mm. Triceps was found. Within the leg press the maximum force for L_70 was only 295 N and for L_90, 646 N.
The Mm. Quadriceps produced a maximum force of 5442 N for L_70. This value corresponded to 80.9% of the isometric maximum of 6721 N detected in single joint tests. For L_90, the internal load was 6433 N, that is, 95.7% of the isometric maximum. According to F_poss, the proportion of the internal load increased to 81.4% for L_70 and 96.3% for L_90, which means that the inner load was clearly higher than intended (see ).
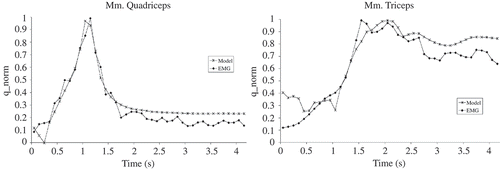
shows the measured and calculated normalized activation functions. The measured activation recorded using electromyography was equivalent to the sum of all muscle parts within the Mm. Quadriceps and Mm. Triceps. The results shown were obtained solely using inverse dynamics without further optimizations.
By varying the foot position and the angle of the foot pad the load could be decreased by 10%. The reason for these results was the orientation of the GRF vector.
4. Discussion
An MRI-based two-dimensional knee model was used to describe the moving joint axis of the femorotibial joint and the femoropatellar joint. The calculated muscle forces using different model types for the knee joint have shown that the MRI-based model leads to sufficient results with respect to maximum force. Also the results for the anterior–posterior and distal–proximal translation of the joint axis throughout the movement are in line with the findings of Wilson et al. [Citation13] and Most et al. [Citation14]. The kinematic approach to determine the moving joint axis within the knee joint, the calculated coordinates of the kinematic pole within the knee joint, showed discontinuity as it was expected for the turning points of the motion. The reason for the differences between the two models during motion seems to be the result of the approximation of the relative velocities for the calculation of the kinematic pole.
For knee extension the displacement of the moving joint axis in x-direction with respect to the tibia was defined as zero and the largest displacement should have occurred in full knee flexion [Citation15]. Only the MRI results represent this definition.
Focusing on the calculated muscle forces and stimulation functions, it is obvious that the changing lever arms had huge influence on the results. The stimulation function showed the influence of different joint models. According to the high values of the force that was calculated using the simplified knee model, the calculated stimulation function was not comparable with the measured EMG data. In contrast to this finding, the results for the knee model with the moving joint axis showed a good correlation with the measurement data.
Applying this model to leg extension movements in a leg press machine, the data revealed that the function of the Mm. Triceps was primarily the stabilization of the ankle. For squat jump (SJ) the highest value was generated after leaving the foot pad while the ankle moment was already decreasing. Consequently one could assume that the Mm. Triceps is mainly used for the active plantar flexion proceeding after take-off but has only small effects on the jump height for this measured movement.
The force output of the CE of Mm. Quadriceps was 6–10% higher than it was intended by the load of 70 and 90% of the isometric maximum. But the calculated maximal force depended on an isometric maximum force gained in single joint tests. One reason may be due to the problem of comparing results of single joint test with multiple joint movements. But the results of the leg press optimization showed the relevance of the lever arm between force vector and knee joint. Only slight changes in the foot position led to reduction of the necessary muscle forces and the joint reaction forces.
Because of the relatively slow movements during L_90 and L_70, the influence of the DE on the generated muscle force was of no relevance to the results. The PE generated no detectable force. The reason was that in the starting position, the muscle length was already shorter than the optimal muscle length. Consequently, there was no stretching during the movement.
Based on the calculated muscle forces, the muscle activation was determined using the activation function of Hatze [Citation10]. Using the MRI-based knee model and individually determined muscle parameters, it was possible to calculate results for the stimulation function that strongly corresponds to the measured and normalized data for all movements.
The results for the measured leg extension movements have shown a high load for Mm. Quadriceps. As a consequence, the load on the femoropatellar joint was also high indicating that the pressure between patella and femur condylus was sizeable in some knee joint angles. This may lead to damages caused by overstraining especially if the movement is repeated frequently. Therefore, the boundary conditions were varied to minimize the inner loads. The results showed a distinct trend: a lower contact position on the foot pad and a larger angle backwards of the foot pad led to a reduction of the inner load for the Mm. Quadriceps ().
The lower contact position on the foot pad reduced the lever arm between GRF and the knee joint. Correspondingly the inner loads of the knee joint decreased. The lever arm between GRF and ankle nearly remained constant and caused the forces in the Mm. Triceps to increase slightly. In the hip joint, the moment increased about 10% on average compared with the original moment. Using this model for the optimization study, the inner load was reallocated in such a way that the external and internal loads in the knee joint and the Mm. Quadriceps reached the same relative amount. At the same time the load for the hip joint increased by 10%. Originally, the hip joint showed a maximal moment of 167 Nm. Compared to 250 Nm for lifting motion [Citation16], this result seems to be an appropriate solution ().
Knowing the amount of these forces offers a possibility to improve, for example, the strength training by controlling the intensity of force development regarding the internal loads. Therefore, the individually determined parameters of force generation depending on muscle length and contraction velocity and not the ‘independent’ external ones have to be considered.
5. Conclusion
The results of these comparisons indicate that it is necessary to take the moving joint axes of the knee joint and the femoropatellar joint into account for the calculation of muscle forces for the Mm. Quadriceps. The consideration of the changing leverages within this joint during knee motion only leads to realistic results for calculated muscle forces. Otherwise it was not possible to calculate stimulation functions that were comparable with measured data.
This leads to the conclusion that it is essential to use individually parameterized models for the knee joint as well as for the femoropatellar joint while analysing the correlations between external and internal loads and the efficiency of specific training exercises for the lower extremities.
The advantage of this model is to gain information on muscle forces and muscle attributes that are not directly measurable. The verification of this model was limited to comparing measured EMG data with the stimulation function. Good qualitative matches for the entire movement were found here. Another criterion was that the calculated muscle forces should never exceed either the measured isometric maximum force or the calculated F_poss. Therefore, the values of the calculated forces seem to be appropriate as well as the force time histories regarding the stimulation function.
Acknowledgements
Parts of this study were funded by Saxon Ministry of Science and the Fine Arts, Germany; Institute of Radiology, Eberhard Karls University Tuebingen, Germany; Faculty of Sport Sciences and Institute of Biophysics, University Leipzig, Germany; and Institute of Applied Training Science Leipzig, Germany.
Notes
1. alaska Modeller Studio© 5.1, Institute of Mechatronics at the Chemnitz University of Technology, Germany.
References
- Bizzini , M. , Biedert , R. , Maffiuletti , N. and Impellizzeri , F. 2008 . Biomechanical issues in patellofemoral joint rehabilitation . Der Orthoaede , 7 ( 9 ) : 864 – 871 .
- Hatze , H. Biomechanics of Sports: Selected Examples of Successful Applications and Future Perspectives, in: ISBS ‘98, Konstanz . Proceedings I . July 21–25 1998 . Edited by: Riehle (Hrsg.) , H. pp. 2 – 22 . Radolfzell, , Germany
- Wank , V. 2000 . Aufbau und Anwendung von Muskel-Skelett-Modellen zur Bestimmung biomechanischer Muskelparameter , Jena, , Germany : Friedrich-Schiller-Universität Jena, Habilitationsschrift .
- Reinbolt , J.A. , Hatka , R.T. , Chmielewski , T.L. and Fregly , B.J. 2007 . Are patient-specific joint and inertial parameters necessary for accurate inverse dynamics analyses of gait? . IEEE Trans. Biomed. Eng. , 54 ( 5 ) : 782 – 794 .
- Yamaguchi , G.T. and Zajac , F.E. 1989 . A planar model of the knee joint to characterize the knee extensor mechanism . J. Biomech. , 22 ( 1 ) : 1 – 10 .
- Roemer , K. Solving inverse Problems in Biomechanics using Leg Extensions as an Example . Proceedings of Oral Sessions. XXII International Symposium on Biomechanics in Sports, University of Ottawa . Edited by: Lamontange , M. , Gordon , D. , Robertson , E. and Sveistrup , H. pp. 268 – 271 .
- Roemer , K. , Wolf , C.-D. and Maißer , P. “Dynamic tracking” a method for smoothing kinematic data . Proceedings of Oral Sessions. XIX International Symposium on Biomechanics in Sports, University of San Francisco . Edited by: Blackwell , J.R. pp. 303 – 306 . San Francisco, , USA
- Maißer , P. and Jungnickel , U. 1998 . “ Stability of controlled motion in diving simulations ” . In ISBS ‘98, Konstanz, July 21–25, 1998, Proceedings I Edited by: Riehle (Hrsg.) , H. 367 – 370 . Radolfzell, , Germany
- Van Soest , A.J. 1992 . Jumping from structure to control: a simulation study of explosive movements , Amsterdam : Academisch Proefschift, Faculty of Human Movement Sciences, Vrije University Amsterdam, Thesis Publishers .
- Hatze , H. 1977 . A myocybernetic control model of skeletal muscle . Biol. Cybern. , 25 : 103 – 119 .
- Hatze , H. 1981 . Estimation of myodynamic parameter values from observations on isometrically contracting muscle groups . Eur. J. Appl. Physiol. , 46 : 325 – 338 .
- Kistemaker , D.A. , Van Soest , A.J. and Bobbert , M.F. 2005 . Length-dependent [Ca 2+ ] sensitivity adds stiffness to muscle . J. Biomech. , 38 : 1816 – 1821 .
- Wilson , D.R. , Feikes , J.D. , Zavatsky , A.B. and ’Connor , J.J. O . 2000 . The components of passive knee movement are coupled to flexion angle . J. Biomech. , 33 : 465 – 473 .
- Most , E. , Axe , J. , Rubash , H. and Li , G. 2004 . Sensitivity of the knee joint kinematics calculation to selection of flexion axes . J. Biomech. , 37 : 1743 – 1748 .
- Roemer , K. 2005 . “ Influence of different knee models on calculated muscle forces ” . In Proceedings of XXIII International Symposium on Biomechanics in Sports: Volume 2 , Edited by: Wang , Q. 156 – 159 . Beijing : China Institute of Sport Science .
- Chang , C.-C. , Brown , D.R. , Bloswick , D.S. and Hsiang , S.M. 2001 . Biomechanical simulation of manual lifting using spacetime optimization . J. Biomech. , 34 : 527 – 532 .

