Abstract
In this work we investigated how robust a robot swarm acts against disturbances caused by another robot swarm, both using the BEECLUST algorithm, which is inspired by honeybee behaviour. For our investigation we simulated an environment with an ambient illuminance, a light spot and a shadow spot. In such an environment we tested two different castes of Jasmine III robots whereas each caste had to perform a different task. One swarm aggregates at places of high illuminance (light spot) and the other one at places of low illuminance (shadow spot). We show that small swarm populations can benefit from the presence of another robot swarm. Medium populated swarms are affected neither positively nor negatively. Large swarm populations act robust against disturbances caused by other robot swarms as long as no jamming effects occur. In this article we show that the BEECLUST algorithm provides all features for making collective decisions. Furthermore we show that the robustness of the BEECLUST algorithm allows us to control a heterogeneous robot swarm in environments which demand differing controller strategies and swarm intelligent behaviour.
1. Introduction
Swarms of autonomous entities (animals, robots) show interesting features: huge numbers of agents act and interact in high densities and often perform their tasks in separated specialized cohorts [Citation1]. The regulation of the agents' behaviours is often self-organized and swarm intelligent [Citation2–4], features that are mainly achieved by various interlinked feedback loops within the swarm system. A prime example for such self-organized and swarm-intelligent systems would be the nectar source selection by honeybees or the trail formation in ants [Citation5].
The requirements for identifying a system as swarm intelligent were defined by Millonas [Citation6] and in other terms also by Sahin [Citation7]:
| 1. | Proximity principle: The swarm should be able to do elementary space and time computation whereas in this case computation is understood as a direct behavioural reaction on a given environmental stimulus. | ||||
| 2. | Quality principle: The swarm should be able to determine and react to the quality of an environmental stimulus. | ||||
| 3. | Principle of diverse response: The swarm should not narrow down its exploitation of a certain resource to much as an insurance against sudden changes in the environment. | ||||
| 4. | Principle of stability: The swarm should not shift its behaviour on every small environmental change. | ||||
| 5. | Principle of adaptability: On the other hand, the swarm should be able to change its behaviour to clear environmental changes. So an optimal solution for the swarm would be a good mixture of principles 4 and 5. | ||||
When creating artificial (e.g. robotic) swarm systems, the feedback networks which determine self-organized behaviour can quickly get rather complex and swarm behaviours can become hard to predict. This generates the demand for finding simple behavioural rules for individuals and also simple rules of interactions. Such rules can often be found in natural swarm systems [Citation8–10]. This allows extraction of such regulation mechanisms and translation of these feedbacks to artificial swarm systems, which in turn show comparable behaviour like the natural sources of inspiration [Citation11–13]. We recently demonstrated such a translation of natural algorithms to a swarm robotic algorithm by developing the BEECLUST [Citation14–17].
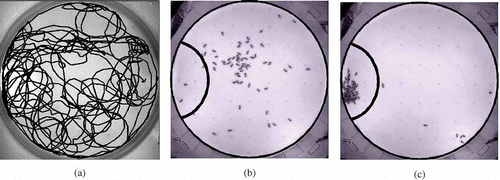
Young honeybees prefer an ambient temperature of 36 °C which corresponds to the temperature of the brood nest in the beehive [Citation18,Citation19]. Recent experiments with young honeybees in a temperature gradient have shown that a single bee moves almost randomly through an arena (see (a)) [Citation15,Citation20]. Some bees exhibit a slight bias towards the warm area during its random walk but it hardly ever stays there. In contrast, groups of bees ((b)) show aggregation behaviour in or close to the warm spot. The bees still move almost randomly but the clusters which are accidentally formed in warm areas last longer than clusters formed in cooler areas. At the end of the experiment, almost all bees cluster in the warm area [Citation15,Citation20] (see (c)). This interesting behaviour inspired us to develop the BEECLUST algorithm which is described in detail in Section 1.1.
Figure 1. Aggregation behaviour of young honeybees. The ambient temperature in the arena is 30 °C. On the left side is a temperature optimum with 36 °C (marked with a black line in (b) and (c)). (a) Trajectory of a single bee. The single bee does not show a clear preference to the temperature optimum. (b) A group of bees are released in the centre of the arena (t = 0 min). (c) At the end of the experiment, most of the bees are clustered in the temperature optimum (t = 30 min).
Such bio-inspired algorithms are frequently investigated in the field of autonomous robotics in the recent years and are developed using a big variety of techniques: Halloy et al. [Citation21] experimented with robots which were able to integrate in insect societies. The field of bio-inspired control algorithms for large populated robot swarms has also been investigated intensively: In the I-Swarm project [Citation22], techniques for controlling a swarm of 1000 microrobots were investigated. The Swarm-Bot project [Citation23,Citation24] investigated the self-organizing abilities of a robot swarm, consisting of simpler, insect-like robots. In the Symbrion project [Citation25], the concept of a swarm of reconfigurable robots is investigated. The Replicator project [Citation26] plans to develop an autonomous robot swarm for industrial purposes.
Compared to single robot systems, such robot swarms have the advantage to work robustly, because the removal or malfunction of single individuals affects the behaviour of the whole swarm only slightly. Robot swarms are also able to act ‘swarm intelligent’ which permits a group of individuals to make decisions to reach a common goal in a decentralized manner. In the following, we demonstrate how the BEECLUST algorithm scales with swarm sizes and how cooperation can emerge (without being pre-programmed) between several interacting robot swarms.
1.1. The BEECLUST algorithm
In recent works it has been shown that a swarm of Jasmine III robots using the BEECLUST algorithm are able to find locations of maximum illumination using a few simple rules [Citation15] (see ):
| 1. | The robots move straight through the arena. Whenever a robot detects an obstacle, it stops and checks whether the obstacle is another robot or a wall by watching for emitted IR signals. Figure 2. Finite-state machine of the BEECLUST controller. Boxes represent the different behavioural states of a robot. Asterisk indicates the starting state of the algorithm. Diamonds represent control structures (if–else decisions). 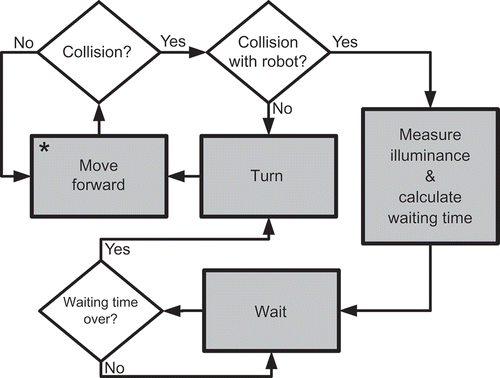 | ||||
| 2. | If the detected obstacle does not emit IR signals it is a wall. The robot turns randomly and continues with Step 1. | ||||
| 3. | If the detected obstacle does emit IR signals it is another robot. The robot measures the local illuminance. | ||||
| 4. | Depending on the local illuminance, the robot calculates a waiting time: the higher the local illuminance, the longer the waiting time. After the waiting time is over, the robot turns randomly and continues with Step 1. | ||||
Our recent studies showed that the BEECLUST algorithm allows a robot swarm to aggregate collectively at a light spot (see (b)) [Citation15]. This collective ability is achieved by robots that move purely random, and which have only one illuminance sensor that does not allow a directed gradient exploitation. Also no memory of past illuminance values is involved in the algorithm. The measurements of the environment occur rarely, only after robot-to-robot collisions. Although the individual ‘intelligence’ of single robots is kept quite low, the swarm as a total was found to act very intelligently, even in dynamic environments. The reasons for this emergent ability are the feedback loops that arise within the robot swarm, as it is explained in detail in [Citation12,Citation27]. Based on the work of [Citation15], we investigated how the robustness of the BEECLUST algorithm is affected by the swarm population and how it is influenced by a second group of robots in the arena performing a different task at the same time.
Figure 3. (a) A single Jasmine III robot. (b) A swarm of Jasmine III robots in a real-life experiment. Most of the robots are aggregated in the bright area of the arena. Reprinted from [Citation15].
![Figure 3. (a) A single Jasmine III robot. (b) A swarm of Jasmine III robots in a real-life experiment. Most of the robots are aggregated in the bright area of the arena. Reprinted from [Citation15].](/cms/asset/c12676a4-4d6f-429b-97d2-afcaf87e3089/nmcm_a_601420_o_f0003g.gif)
2. Methods
The experiments in this work were performed with simulated Jasmine III robots. The Jasmine III robot ((a)) has a size of about 30 × 30 × 25 mm (L × W × H). It has two wheels as actuators which can be turned in both directions. For distance measurement and for collision avoidance the Jasmine III has six IR sensors. The sensors range is approximately 60 mm. For light measurement the Jasmine III has two light sensors on top. A detailed description of the robot hardware can be found in [Citation15,Citation16] and building instructions are given in [Citation24].
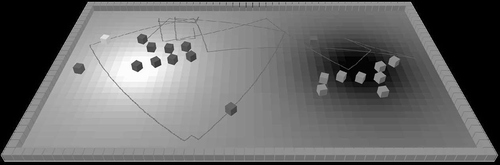
For our experiments we used SMARS (Small Robot Simulator), a simulation environment programmed in NetLogo [Citation28], which was built for performing experiments with simulated Jasmine III robots (see ). In this simulation environment we simulated two different ‘castes’ of Jasmine III robots which were implemented with the physical properties of the real robots. The only difference between the two castes is that one caste waits longer at places of high illuminance (light finders) and the other one at places of low illuminance (shadow finders). All other properties of the robots are equal.
Figure 4. Screenshot of two robot swarms acting in the simulation environment SMARS. The white spot is the optimum for the ‘light finders’ with 1000 lux and the black spot is the optimum for the ‘shadow finders’ with 0 lux. The ambient illuminance is 500 lux. Robots are represented by boxes which indicate their caste: dark boxes are ‘light finders’ and bright boxes are ‘shadow finders’. The line shows a trajectory of a randomly chosen robot for demonstration purposes. Note: SMARS, Small Robot Simulator.
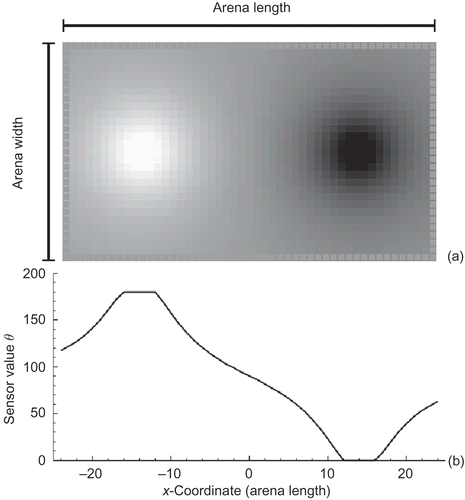
We generated a virtual arena with the dimension of 49 × 29 spatial units. These spatial units are called patches and have a base area of 3 × 3 cm2, which is equal to the base area of a Jasmine III robot. In this arena we implemented an environment with an ambient illuminance of 500 lux. We added a light spot with 1000 lux and a shadow spot with 0 lux (see ).
Figure 5. (a) Overhead screenshot of the arena in SMARS. The bright area indicates the light spot and the dark area indicates the shadow spot. Arena length = 49 patches, arena width = 29 patches. (b) Sensor values detected by the robots. Samples are taken from patches with y = 0, which is the vertical centre of the arena.
2.1. The simulation
In our simulation each infrared sensor s is modelled as a set of two values:
For each sensor s of S, an object O and an object R are generated; O is the closest object (including other robots) and R is the closest robot. When robots detect an obstacle they emit an infrared signal and switch to a perception mode in which they wait for other infrared signals. (In this way a robot discriminates an obstacle from another robot because obstacles reflect IR light but do not emit IR light by themselves.) First we calculate whether a robot in the sensor cone could possibly be occluded by another object (expressed by i) by determining the distance of the robot and the distance to the occluding object
:
In a next step we calculate whether a robot is visible behind an obstacle (expressed by j). Therefore the angles and
are defined for each O and each R in the sensor cone.
There is a direct proportion between the illuminance and the sensor value whereby the maximal sensor value (180) is reached at 1000 lux and above. In our model sensor values of the light sensors are a linear function of local illuminance, as it is explained by EquationEquation (5)(5):
2.2. The controller
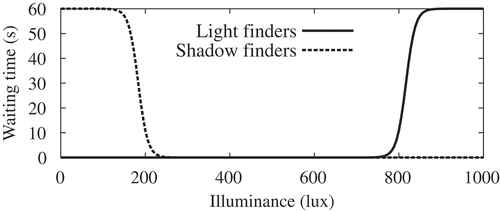
As mentioned above, each robot which meets another robot calculates its waiting time individually, depending on the local illuminance but regardless of the other robots' caste. The waiting time of the ‘light finders’ is modelled as
Table 1. Constants and their values used in Equation1–3 in our simulation runs
Figure 6. Illustration of the dependence between the local illuminance and the waiting time
. The solid drawn function was implemented in the ‘light finders’, and the dashed drawn function was implemented in the ‘shadow finders’.
2.3. The experiments
To find the optimal density of a Jasmine III swarm, we first tested groups of differing population sizes only consisting of ‘light finders’. We defined a target zone for the ‘light finder’ caste consisting of all patches having a light value between 600 and 1000 lux (this is 40% of the maximum light value in the arena). For each swarm population, we repeated the experiment six times for 4 simulated minutes. We defined two different measurable criteria for aggregation success: aggregation quality and aggregation speed. To get an overview of the aggregation quality of our robot swarm, we monitored the ‘light finders’ in the state ‘wait’ located in the target zone within the last minute of every repetition. To analyse the aggregation speed, we monitored the point of time when 50% of the ‘light finder’ population aggregated within the target zone (). To test the robustness of a robot swarm against disturbances caused by another swarm performing another task, we added groups of variable numbers of ‘shadow finders’ and observed how they affect the aggregation behaviour of the ‘light finders’.
3. Results
Our results show that there is an optimal density of the tested robot swarm for the used environmental conditions. This optimal density was found at a swarm population of 9 individuals (see ). A swarm consisting of 9 individuals is able to aggregate, on average, 80% of its individuals in the target zone.
Figure 7. Fraction of aggregated ‘light finders’ AL (NL ) in target zone over the last minute of observation. The optimal swarm population for the given environment was found at 9 robots. The tested swarm populations were 2, 3, 6, 9, 12, 18, 24, 33, 42, 60, 100 and 120 individuals; n = 6 repetitions per experiment.
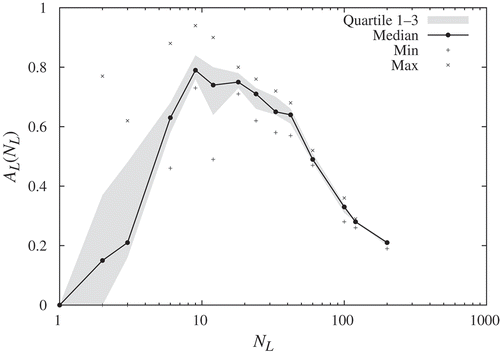
In we demonstrate that in small robot populations (), the aggregation quality increases with the number of other robots in the arena. Medium populated robot swarms (
) have a constant fraction of robots aggregated under the light source, independent of the number of other robots in the arena. Larger swarms (NL
= 33) show a decreasing fraction of aggregated robots with increasing number of other robots in the arena.
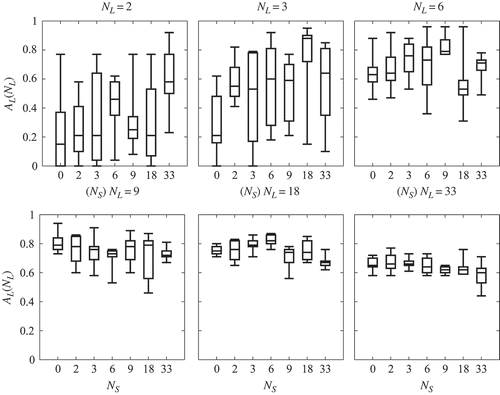
Figure 8. Fractions of ‘light finders’ aggregated in the target zone within the last minute of observation (median ± quartiles, min and max). is the total number of ‘light finders’ and n = 6 repetitions per experiment.
Concerning the aggregation speed, we show that small robot populations () do no aggregate under the light source as long as no other robots (
) are present in the arena (). The aggregation speed increases with the number of other robots (
). Medium populated robot swarms (
) aggregate with the same speed under the light source, independent of the number of other robots in the arena. Larger robot swarms (
) show a decreasing aggregation speed with increasing number of other robots in the arena.
To allow the investigations of the observed enhancements of aggregation, which the focal robot swarm can draw from the presence of the other swarm, we developed two numerical expressions of aggregation enhancement:
, which expresses the increase of the aggregation fractions in the presence of 33 ‘shadow finders’ compared to runs were ‘light finders’ acted alone (see EquationEquation (10)
(10)). In addition,
expresses the increase in the speed of aggregation when such simulation runs were compared (see EquationEquation (11)
(11)).
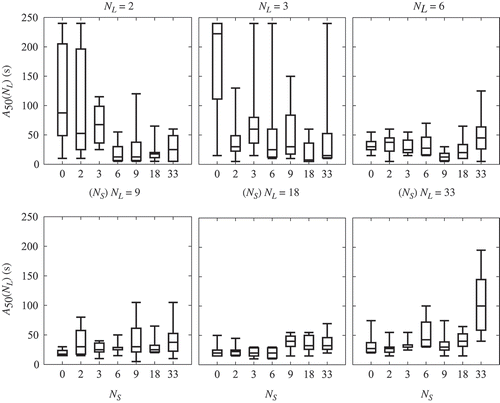
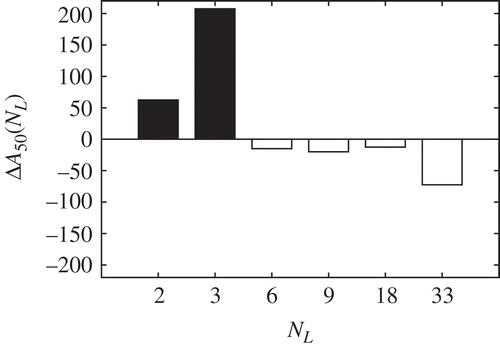
Figure 9. Time in which 50% of the ‘light finder’ swarm aggregated in the target zone () at different population sizes of ‘shadow finders’
(median quartiles, min and max).
is the number of ‘light finders’ and n = 6 repetitions per experiment.
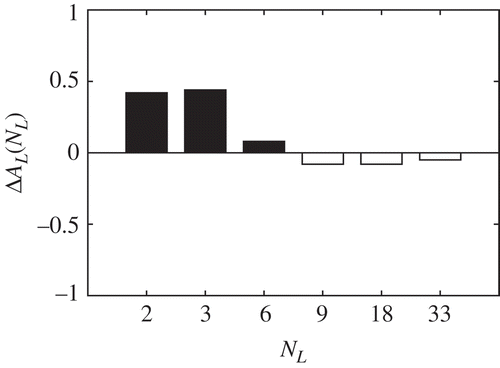
, where was evaluated for different swarm sizes of ‘light finders’, shows that small populations show an enhancement of their ability to aggregate by increasing number of other robots, whereas larger populations are not affected, whereby
represents the difference between the fraction of ‘light finders’ in the target zone at a ‘shadow finder’ population of 33
and a ‘shadow finder’ population of 0
.
Figure 10. The enhancement of aggregation which is the difference of fraction between
and
, for
–
, is shown. For details on the formulation of
, see EquationEquation (10)
(10).
To investigate also the advancements in aggregation speed, which are caused by the presence of other robot swarm, we defined an aggregation enhancement according to
Figure 11. The acceleration of aggregation in seconds which is the difference of
between
and
, for
–
, is shown. For details on the formulation of
, see EquationEquation (11)
(11).
4. Discussion
As shown in , a robot swarm using the BEECLUST algorithm is predicted by our model to have an optimal swarm population of nine individuals for the tested arena size and illuminance patterns. Below this value there is a steep increase in the aggregation performance. This could be caused by positive feedback loops, which are typical for swarm behaviour: the more individuals, the better is the performance of the whole swarm. At a swarm population above the optimum of nine individuals, the aggregation performance decreases again. On the one hand, the robots block each other because the robot density gets too high for the arena size; on the other hand, the light spot gets saturated. We expect a different finding in a differently dimensioned environment because the optimal population size is dependent on the robot density.
Concerning the robustness of the swarm, we found that small ‘light finder’ populations gain benefit from increasing numbers of ‘shadow finders’ in aggregation quality as well as in their aggregation speed. This results from a higher total number of robots in the arena; more collisions happen and lead to an increasing frequency of light measurements. Medium populated swarms act robust in the presence of another robot swarm concerning their ability to aggregate as well as concerning their aggregation speed. Both of these observables are affected only slightly. The advantage of more measurements and the disadvantage of jamming cancel each other out. Large swarms take disadvantage from an increasing number of other robots, because the robot density gets too high and jamming effects occur. The appearance of advantages in aggregation caused by other robots in the arena is caused by the increase of robot collisions which go along with a higher robot density in the arena. This leads to an increasing number of light measurements due to an increasing number of robot collisions. But if the density of robots in the arena is too high, jamming effects occur. This leads to a lower quantity of aggregation ( and ) and lower aggregation speed ( and ).
With the work at hand we show that the BEECLUST algorithm is not only capable of working robustly in a homogeneous robot swarm, but also suitable in heterogeneous robot groups with differing controller strategies, even without discrimination of caste affiliation of other robots. Those gained benefits allow us to use the BEECLUST algorithm in environments which may demand heterogeneous controller strategies, for example, loading energy: Robots with low energy aggregate at the fuelling station, whereas robots with enough energy accomplish their mission.
The topic of aggregation of swarms of agents is a common benchmark in the field of swarm robotics: Dorigo et al. [Citation23] used an evolving neural network consisting of 12 neurons for robot aggregation. Compared to this work the BEECLUST algorithm is quite simple, because it gets along with just a few basic rules and therefore it needs less processing power and memory. Other experiments with cockroach-like robots have been performed in simulations as well as in real world [Citation29,Citation30]. The main difference to our work presented here is the ability of cockroach-like robots to measure the number of other nearby robots. This requires a unique ID and communication between the individuals. Our robots, which use the BEECLUST algorithm, neither need to discriminate between different individuals within the swarm nor need to know how many individuals are located in a nearby aggregation spot. Furthermore, the ‘cockroach-derived algorithm’ is aimed to emulate cockroach behaviour as closely as possible while the BEECLUST is aimed to collectively choose an optimal aggregation site. Therefore, the ‘cockroach-derived algorithm’ is more complex than the BEECLUST.
In summary, the BEECLUST algorithm is simple and therefore it has little requirements. It does not require any communication in a biological sense. The robots are able to distinguish other robots from obstacles in the environment via their physical properties and characteristics, but they do not need to know ‘which’ and how many other robots are around. Above all, our study presented here shows how robust the BEECLUST algorithm works and how versatile its applicability is despite its simplicity.
In future we will investigate how the distribution of light in the arena (gradient or discrete) influences the aggregation behaviour. Furthermore, we will investigate how the distance between the two optima influences the aggregation behaviour.
Acknowledgements
We thank Sibylle Hahshold and Gerald Radspieler for providing us with the data of honeybee experiments and for building the honeybee temperature arena. This work was supported by EU-IST-FET project SYMBRION, no. 216342; EU-ICT project ‘REPLICATOR’, no. 216240; and Austrian Science Fund (FWF) research grants P15961-B06 and P19478-B16.
References
- Johnson , B.R. 2003 . Organization of work in the honeybee: A compromise between division of labour and behavioural flexibility . Proc. R. Soc. Lond. B , 270 : 147 – 152 .
- Beni , G. From swarm intelligence to swarm robotics . Proceedings of the First International Workshop on Swarm Robotics . Santa Monica , CA . Edited by: Şahin , E. and Spears , W.M. pp. 1 – 9 . LNCS .
- Bonabeau , E. , Dorigo , M. and Theraulaz , G. 1999 . Swarm Intelligence: From Natural to Artificial Systems , Oxford : Oxford University Press .
- Kennedy , J. and Eberhart , R.C. 2001 . “ Swarm Intelligence ” . In Morgan Kaufmann Series in Evolutionary Computation , San Francisco , CA : Morgan Kaufmann .
- Camazine , S. , Deneubourg , J.L. , Franks , N.R. , Sneyd , J. , Theraulaz , G. and Bonabeau , E. 2001 . Self-Organization in Biological Systems , Princeton , NJ : Princeton University Press .
- Millonas , M.M. 1994 . “ Swarms, phase transitions, and collective intelligence ” . In Artificial Life , Edited by: Langton , C.G. III . 417 – 445 . Reading , , MA : Addison-Wesley .
- Şahin , E. 2005 . “ Swarm robotics: From sources of inspiration to domains of application ” . In Swarm Robotics: State-of-the-Art Survey , Edited by: Şahin , E. and Spears , W.M. 10 – 20 . Berlin : LNCS 3342, Springer-Verlag .
- Seeley , T.D. , Camazine , S. and Sneyd , J. 1991 . Collective decision-making in honey bees: How colonies choose among nectar sources . Behav. Ecol. Sociobiol. , 28 : 277 – 290 .
- Schmickl , T. and Crailsheim , K. 2004 . Costs of environmental fluctuations and benefits of dynamic decentralized foraging decisions in honey bees . Adapt. Behav. Anim. Anim., Software Agents Rob. Adapt. Syst. , 12 : 263 – 277 .
- Jeanson , R. , Rivault , C. , Deneubourg , J.L. , Blanco , S. , Fournier , R. , Jost , C. and Theraulaz , G. 2005 . Self-organized aggregation in cockroaches . Anim. Behav. , 69 : 169 – 180 .
- Theraulaz , G. , Bonabeau , E. , Nicolis , S.C. , Sole , R.V. , Fourcassie , V. , Blanco , S. , Fournier , R. , Joly , J.L. , Fernandez , P. , Grimal , A. , Dalle , P. and Deneubourg , J.-L. 2002 . Spatial patterns in ant colonies . Proc. Natl. Acad. Sci. U.S.A. , 99 : 9645 – 9649 .
- Schmickl , T. , Hamann , H. , örn , H. W and Crailsheim , K. 2009 . Two different approaches to a macroscopic model of a bio-inspired robotic swarm . Rob. Auton. Syst. , 57 : 913 – 921 .
- Reynolds , C.W. 1987 . Flocks, herds, and schools . Comput. Graph. , 21 : 25 – 34 .
- Schmickl , T. and Hamann , H. 2011 . “ BEECLUST: A swarm algorithm derived from honeybees ” . In Bioinspired Computing and Communication Networks , Edited by: Xiao , Y. and Hu , F. 95 – 137 . New York : Routledge .
- Schmickl , T. , Thenius , R. , öslinger , C. M , Radspieler , G. , Kernbach , S. and Crailsheim , K. 2008 . Get in touch: Cooperative decision making based on robot-to-robot collisions . Auton. Agent Multi Agent Syst. , 18 : 133 – 155 .
- Kernbach , S. , Thenius , R. , Kornienko , O. and Schmickl , T. 2009 . Re-embodiment of honeybee aggregation behavior in an artificial micro-robotic swarm . Adapt. Behav. , 17 : 237 – 259 .
- Hamann , H. , Schmickl , T. , örn , H. W and Crailsheim , K. 2011 . Analysis of emergent symmetry breaking in collective decision making . Neural Comput. Appl. , : 1 – 12 .
- Heran , H. 1952 . Untersuchungen über den Termperatursinn der Honigbiene (Apis mellifica) unter besonderer Berücksichtigung der Wahrnehmung strahlender Wärme . Z. vgl. Physiol. , 34 : 179 – 206 .
- Ohtani , T. 1992 . Spatial distribution and age-specific thermal reaction of worker honeybees . Hum. Nature , 1 : 11 – 26 .
- Szopek , M. , Radspieler , G. , Thenius , R. , Schmickl , T. and Crailsheim , K. 2009 . Cooperative thermotaxis in honeybees: Group decisions in a complex temperature gradient . Apidologie , 40 : 663
- Halloy , J. , Sempo , G. , Caprari , G. , Rivault , C. and Deneubourg , J.L. 2007 . Social integration of robots into groups of cockroaches to control self-organized choices . Science , 318 : 1155 – 1158 .
- Valdastri , P. , Corradi , P. , Menciassi , A. , Schmickl , T. , Crailsheim , K. , Seyfried , J. and Dario , P. 2006 . Micromanipulation, communication and swarm intelligence issues in a swarm microrobotic platform . Rob. Auton. Syst. , 54 : 789 – 804 .
- Dorigo , M. , Trianni , V. , Sahin , E. , Groß , R. , Labella , T.H. , Baldassarre , G. , Nolfi , S. , Deneubourg , J.-L. , Mondada , F. , Floreano , D. and Gambardella , L.M. 2004 . Evolving self-organizing behaviors for a swarm-bot . Auton. Rob. , 17 : 223 – 245 .
- U. Stuttgart http://www.swarmrobot.org (http://www.swarmrobot.org) (Accessed: 15 April 2011 ).
- SYMBRION, Project Website. http://www.symbrion.eu (http://www.symbrion.eu) (Accessed: 15 April 2011 ).
- REPLICATOR, Project Website. http://www.replicators.eu (http://www.replicators.eu) (Accessed: 15 April 2011 ).
- Hamann , H. , örn , H. W , Crailsheim , K. and Schmickl , T. Spatial macroscopic models of a bio-inspired robotic swarm algorithm . IEEE/RSJ 2008 International Conference on Intelligent Robots and Systems (IROS’08) . Los Alamitos , CA . pp. 1415 – 1420 . IEEE Press .
- Wilensky , U. 1999 . NetLogo, Center for Connected Learning and Computer-Based Modeling , Evanston , IL : Northwestern University .
- Garnier , S. , Jost , C. , Jeanson , R. , Gautrais , J. , Asadpour , M. , Caprari , G. and Theraulaz , G. Collective decision-making by a group of cockroach-like robots . Proceedings of the 2nd IEEE Swarm Intelligence Symposium (SIS) . Los Alamitos , CA . pp. 233 – 240 . IEEE .
- Garnier , S. , Tache , F. , Combe , M. , Grimal , A. and Theraulaz , G. Alice in pheromone land: An experimental setup for the study of ant-like robots . Swarm Intelligence Symposium (SIS 2007) . Los Alamitos , CA . pp. 37 – 44 . IEEE Press .