
 ?Mathematical formulae have been encoded as MathML and are displayed in this HTML version using MathJax in order to improve their display. Uncheck the box to turn MathJax off. This feature requires Javascript. Click on a formula to zoom.
Abstract
A physiology-based fatigue model was developed and tested, with the long-term objective to study optimal pacing strategies in cross-country skiing. The model considers both aerobic and anaerobic power contributions, with different demands for carbohydrate fuel. The fatigue model accumulates traces from anaerobic efforts, and dissipates fatigue exponentially. The current fatigue value affects the effective work rate output. A limited reservoir of fuel is considered. This paper discusses the numerical formulations. Examples show the relevance of the model for basic regimes of power output, and give qualitatively relevant results, but demonstrate the need for individual physiological parameters. Further examples study the model’s predictions with respect to interval training strategies, with conclusions on work rates and interval lengths.
Mathematical Subject Classification Code:
Introduction
Optimization techniques, which are fundamental mathematical tools in many engineering disciplines, are increasingly used in human movement analysis. The basic assumption is that the body aims at the best possible performance, from clinical, sports-related, or man–machine interaction viewpoints in terms of the forces required, energy consumed, pain endured, or other quantifiable measures. Typically, equality and inequality constraints impose basic mechanical and physiological demands and limitations.
In addition to inverse dynamics simulations, where a recorded movement is analysed [Citation1,Citation2], inverse optimization is used by, e.g., Bottasso et al. [Citation3], and Terekhov et al. [Citation4], to deduce the neural motor control strategy of a movement. Forward dynamic simulations aim to achieve a prescribed movement with minimal use of resources [Citation5–Citation8, and many others]. In this context, a ‘pacing strategy’ can optimize the expenditure of limited power resources to attain a desired athletic outcome.
In an investigation of mid-distance running, Reardon [Citation9] developed a ‘toy model’ for anaerobic metabolism in a working muscle, in which a factor X provides a measure of fatigue. The optimum pacing strategies for 400 m and 800 m running are thereby shown to be a maximum start effort, and then a consciously slightly reduced power output, which is argued to be closer to a real world-record race than models by Keller [Citation10] and Ward-Smith [Citation11]. The studied events are of a continuous nature and of rather short durations, meaning that the specific details of fatigue creation and dissipation are of limited importance for the analyses. A borderline for when all-out efforts are preferable is stated to exist at event durations of 80–100 s [Citation12] or 2 min [Citation13]. The specific competition context and its psychology have also been shown to affect the strategy to anticipate and handle fatigue [Citation14].
In endurance sports, individual power production over shorter or longer time periods is one of the decisive factors for success [Citation15]. The capacity to perform over longer durations has been examined most extensively with running, cycling, and rowing [Citation16–Citation18, and others]. Proficiency in cross-country skiing is also associated with total athletic power [Citation19,Citation20]. The specifics of this whole-body exercise, primarily in relationship to the varying requirements made by different parts of a track, have been studied by, e.g., Moxnes and Sandbakk [Citation21]. The maximal oxygen uptake cannot be maintained throughout the durations of the longer skiing events, due to – among other aspects – muscle fatigue and glycogen depletion [Citation22,Citation23]. The major strategic constraint involves the total capacity for mechanical work produced over a certain time, when the power demand varies over the event due to external factors.
Individual endurance in specific situations is often experimentally tested in running or on ergometers. Several basic methods for such experiments are available, with widely varying parameters for timing and effort levels. The results essentially measure oxygen uptake, mechanical power, or endurance times, and are used as individual status measures, typically given as certain threshold values. These values are commonly closely connected to a certain experimental method, allowing comparisons over time for one individual, but providing limited possibilities for comparisons between individuals. Correlations of results obtained with different methods are thereby also difficult. The development below will therefore use a set of generic individual status parameters, deliberately given neutral names, in order not to be confused with method-related terms. As further described in the Results section, we consider as our baseline case in the development a virtual, rather well-trained endurance athlete with an anaerobic threshold work rate of around 300 W (measured as useful mechanical work rate), and a result from a ramp cycle test of around 440 W.
In mathematical descriptions of physical activity, the current individual capacity for mechanical work is commonly based on the power–time relation [Citation24–Citation26]. The maximum total work an athlete can produce at constant power over a time
is then
where is a critical, aerobic power that can theoretically be maintained for an infinite period of time, while
reflects the total capacity for anaerobic work. This equation has been applied to describe endurance in a variety of contexts [Citation27,Citation28, and many others], with modifications in different studies involving variable patterns of power production [e.g., Citation29]. The basic concept is that power production above the critical level taxes anaerobic capacity, whereas subcritical work rates tend to restore this capacity [Citation30]. Equation (1) is, however, of limited use for general simulations, since it implies that anaerobic capacity can increase without limit during periods of rest or low power production.
Rather little is also known about how the individual capacity changes over time, even if comparisons of training strategies have been published [Citation31–Citation34, and others]. A key issue is the performance as a difference between fitness and fatigue, describing the positive and negative effects of frequent training. Among the different training strategies used to improve whole-body work capacity, efficient approaches often involve interval training, i.e., periods of high-intensity work interspersed with rest or a lower level of effort. Both the intensity levels and the time periods are very different in different paradigms [Citation35–Citation37]. A power output and fatigue model should be able to predict at least some aspects of such strategies, even if the long-term adaptation effects are not represented. In the present work, a simplistic view is used where maximum active work during a training event is considered as optimal. The modelling thereby only considers the current status of an individual, and does not predict the evolution over time.
The present work develops, uses, and discusses a numerical simulation model for fatigue effects on power production. The main purpose of the development is to create computationally feasible expressions for inclusion in an optimization algorithm aiming at pacing strategy evaluations for cross-country skiing. The description of the effects on and from fatigue during a continuous but time-varying mechanical work exercise is thereby the main objective. The novel aspects of the work are the simplified lumped descriptions of the fatigue effects in human whole-body exercise, and the possibilities to model time-varying work rates in a consistent scheme, which will allow simulations of many different settings of the exercise. An objective is also to clarify how the assumptions presently introduced can be modified and improved.
Methods and formulation
The fatigue model
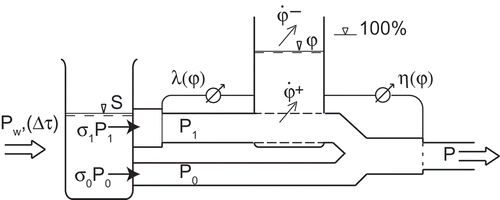
The developed physiology-based fatigue model is schematically described in , representing the mechanical performance of the human body as an input–output system. It consists of four main components: the aerobic and anaerobic gross power inputs and
, a reservoir for carbohydrate fuel, measured as
, and a reservoir for accumulated fatigue, measured as
. The model also uses an anaerobic gross power limit defined by a ratio
, and an efficiency ratio defined by
, both affected by current fatigue. All variables are related to a time instance
, and time increments
with constant conditions are considered.
Figure 1. Main components of the fatigue model, when the athlete at time requests a power
, and obtains a work rate
, which is affected by the current measure of fatigue
. When using anaerobic power
, in addition to the aerobic
, fatigue increases, but this is also dissipated exponentially with time. Normalized measures
and
describe the effects of fatigue
on the resulting work rate. Fuel cost constants
and
describe fuel costs per unit aerobic and anaerobic work, respectively, and they tax the fuel reservoir, measured by
. Constant conditions are assumed to be valid for a time increment
from the instance
.
The components in the model are transforming a requested power into a resulting effective work rate
, which only considers the useful output for overcoming external mechanical forces. The power
can be seen as the present ambition in power production at time
, and
the real outcome. The response of the model is highly dependent on a set of individual capacities, which are here defined by generic terms, not to be confused with commonly used method-related terminology.
The gross aerobic power is limited by the request and a capacity, as
where is the maximal aerobic power capacity of the individual, and min denotes the lower of the two arguments. It is assumed in the model that only aerobic power is used, as long as this is sufficient, only using the anaerobic power when the demands are higher.
The gross anaerobic power is also limited by a capacity, as
where is the maximal instantaneous power of the individual when not fatigue affected, and the parenthesis gives the anaerobic part of this. When fatigue has been accumulated, the gross anaerobic power is further limited by a ratio
with
, and decreasing from 100% to lower values with increasing fatigue. This ratio sets the gross anaerobic power to
where the current maximum capacity can reduce the anaerobic contribution so that the effective work rate becomes lower than the requested power level.
Recruitment of anaerobic power creates fatigue, which is in reality related to waste products from the work performed [Citation38–Citation41]. Without restrictions to the model, the fatigue is here seen as a normalized value, such that 0 represents no fatigue, and 1 (100%) the fatigue, which gives full effect on work rate output, as described below. More elaborate and phenomenon-related expressions are, however, easily introduced. Highly relevant choices as fatigue measures would be the oxygen uptake, the heart rate, or the blood lactate, but this would demand accurate measurements if improved fidelity is the aim.
The fatigue obviously changes with time during an exercise. With an increment of the fatigue measure assumed proportional to the current anaerobic power
, a fatigue increase rate during the time increment
is described as
where the superposed dot indicates a time rate, and the proportionality factor is a time factor that reflects the individual accumulation of fatigue, by describing how much work would be needed to reach 100% fatigue, if no dissipation of fatigue was present. But, fatigue is also dissipated with time. An exponential decrease in fatigue is modelled as
where is a characteristic time scale, i.e., the inverse to the
coefficient used by Reardon [Citation9]. The total increment of the fatigue measure during a time step
from time
is thereby
where the balance between the first (positive) and the second (negative) term in the parenthesis decides whether the fatigue measure is currently increasing or decreasing.
The time delay existing in all reaction processes is here neglected, in order to avoid the introduction of further assumed parameters. A delay function would be easily introduced as a memory of previous time steps. The proportionality assumption allows any measure for the fatigue, related to a more or less clear identification of the fatigue physiology.
The limiting ratio for the gross anaerobic power is a function of the fatigue measure
. Here, this dependence is written in the simplest possible form as a linear function:
This parameter describes how the ratio falls linearly from 100% without fatigue to zero at a fatigue level . Above this fatigue value, no anaerobic power can be produced. More elaborate functions are easily introduced, but must fulfil
, and non-increasing with
.
Fatigue also affects the work rate efficiency, and the final effective work rate from the model is a fraction of the gross sum of aerobic and anaerobic power:
In the model, this ratio reduces both aerobic and anaerobic contributions. With the only demands being that , and that
decreases with fatigue, a linear function is assumed:
where is the efficiency remaining for
. This constant was chosen as
in all tests below. The function thereby describes a ramp from 100% at
to
70% when
.
The fatigue measure and the two chosen reduction functions
and
can be seen as lumped variables, expressing in a simplified way the fatigue and its dual effect on work rate output. In lack of substantial experimental data, these express general trends, with mathematically necessary conditions implied for them. With improved experimental data, the expressions can be easily modified, but such improvements are not believed to qualitatively change the main conclusions here. illustrates that the two parameters are significantly different in their effects, with
limiting the gross anaerobic power available, while
reduces the efficiency of both power streams.
Even if the fatigue measure in Equations (8) and (10) affects the work rate output,
is not considered as a limit, and fatigue values
can be accumulated, but demand longer time to dissipate to values where
. The work rate is in these situations obviously reduced to a fraction of only the maximum aerobic power
, as also
, according to Equation (8), is introduced in Equation (3).
The carbohydrate supply, measured by , is given a value
at the start of the exercise, and is taxed at a rate
The value of is then adjusted accordingly, for instance by defining it from a maximum time for the maximum aerobic power
.
The supply of carbohydrates does not limit the possible work rate until it is emptied, and then the present simulations were stopped, neglecting the purely fat-driven work capacity. As no inflow to this reservoir is included in the model, the initial capacity sets an absolute limit on the total work, which can be produced during an exercise session, cf. Currell and Jeukendrup [Citation43], and Burke [Citation44].
Defining parameters
The basic model in is thereby defined by the individual parameters ,
,
,
, and
. The functions
and
were here only considered through the expressions in Equations (8) and (10).
Although not exactly agreeing with common parameters, most of these parameters can, for numerical experimentation, be reasonably estimated from the literature. The only exception is the quantity in the denominator of the time constant for fatigue increase. In order to obtain at least a rough estimate for this parameter, in the baseline case below we have set it equal to 10 min of maximum aerobic work, recognizing that these parameters should have a rather strong correlation for an individual.
With the above-mentioned assumptions, the fatigue model can be seen as a transformation at time instance :
A simulation setting closer to the existing physiological testing methods seeks at each time the
necessary to produce a prescribed mechanical work rate
, which is for instance needed to overcome a cycling resistance. An inverse of the above expressions facilitates the calculation of a requested power, which gives the needed work rate. With increasing fatigue,
must, due to reduced efficiency, be successively increased to create the needed work rate
. The expressions for the requested power
needed to produce a work rate
can thereby be written as
If the calculated is higher than the fatigue-affected maximum anaerobic power in Equation (3), then the prescribed work rate is not reachable at the current fatigue state, and the simulation is discontinued.
Results
The aim of the numerical experiments described below was to show the behaviour of the numerical model for typical exercise settings. The results thereby are a basic demonstration of the model when it is used for a constant power request, an inverse simulation aimed to represent the typical ergometer test with constant work rate output, and some instances of interval training. Without calibrated status parameters for an individual, the results can only be seen as qualitative.
Basic properties of the model
Two basic cases show the properties of the fatigue model. All simulations used s, and assumptions according to the previous section. Parameters were chosen in five cases, (a)–(e) according to the top part of , where only variations from the baseline case (a) are indicated;
was calculated from 2 h of maximum aerobic work.
Table 1. Cases (a)–(e) used in the examples below. Baseline case is (a), the other cases only vary the indicated parameter. In all tests the fuel costs parameters , the fatigue creation constant
, the efficiency ratio
according to Equation (10), and the limiting factor for anaerobic power
according to Equation (8). The top part of the table gives the defining parameters for each case, whereas the bottom part gives the obtained results from test situations simulated with the present model.
As an interpretation of the parameter cases in , simulations of common test situations were performed with the model. Results from these are given in the bottom part of . The first comparison gives the obtained results from a ramp cycling test, with 1-minute intervals at 120, 140, … W until exhaustion. The second comparison gives the simulated anaerobic threshold powers, defined as the maximum constant power sustainable for exactly 1 h.
The first demonstration example introduces a constant power request in the simulation.
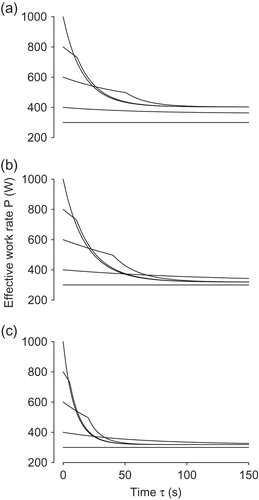
shows the effective work rate variation over time
, for parametric case (a) and a set of prescribed constant requested powers. The slope discontinuity in the curves for high
(for instance around
s for
W) is related to the
limitation in Equation (3) becoming active; this does only happen for values of
higher than a certain level (not accurately isolated) when fatigue leads to a too high reduction in anaerobic power capacity. For high requested powers, this will happen almost immediately. The effective work rate asymptotically approaches a steady-state value
for each value
, . The time
shows when the work rate is within
W of this steady-state value. The time
shows when no work can be produced, due to an emptied carbohydrate supply, which is always the stopping condition in this case. , and give the same results for the parametric cases (b)–(c) in . These results indicate the effects from variations in the individual parameters.
Table 2. Results from simulations of constant requested power for different parametric cases, . Asymptotic work rate is reached at time
. Carbohydrate reservoir is emptied at time
.
Figure 2. Basic tests of the fatigue model, showing the effective work rate output for various constant requested power inputs
. Cases (a)–(c) according to . In each subfigure, the curves represent (from bottom to top at
) the requested powers
W. Discontinuities in curve slopes are due to the limitation in anaerobic power becoming active; this happens immediately for
W.
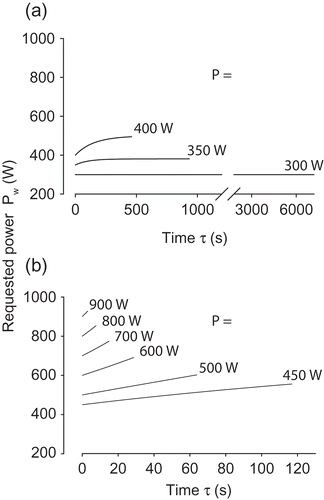
The second demonstration example introduces a constant effective work rate , representing common physiological testing. The results from systematic simulations at different constant work rate levels thereby give the relation between work rate and time to exhaustion.
These inverse simulations can be discontinued for two reasons: either the carbohydrate reservoir is emptied or the fatigue level restricts the achievable work rate. lists the results for a number of tested work rates, and parametric cases (a)–(c) in . The main results are the maximum time during which the specified work rate can be sustained, and the reason for not allowing a continuation: exhaustion (with high ), or fuel supply (
becoming zero). Simulations were also performed with a doubled fuel supply, cf. the cases within parentheses in . shows, for the cases documented in , how the requested power
needs to be successively increased in order to give a specified constant effective work rate
. The principal difference is whether the power requested reaches a specific value asymptotically (as in ) or increases constantly until failure due to fatigue (as in ). Similar simulations also gave the bottom rows of .
Table 3. Results from inverse simulations demanding constant effective work rate , for parametric cases (a)–(c), . Results give the time
for which the work rate can be sustained. Carbohydrate reservoirs corresponding to 2 h of maximal aerobic power (within parentheses results for a 4-h case). Asterisks indicate that fuel supply limited the time.
Figure 3. Inverse tests, case (a), and . Variation over time of requested power needed to produce specified effective work rates
. (a) Cases where time is limited by carbohydrate supply. (b) Cases where fatigue limits time.
The results from the inverse simulations were also compared to a critical power assumption, according to Equation (1). The relations between the time to exhaustion and the total work performed come out as almost straight lines in a diagram for relatively high work rates (not shown), and thereby short time durations. The present simulation model thereby produces results comparable with Equation (1) for the simple cases with constant work rates.
The above comparisons were focused on the effects from the fatigue parameters in the model. Tests were also performed for the parametric cases (d)–(e) in , with different maximum power values and
. These show that the maximum total power
has a limited effect on the outcome, but that
essentially increases all work and power measures uniformly. This conclusion is also confirmed by the bottom rows in .
Interval exercise
The model was used to simulate a few paradigms of interval training, in order to demonstrate qualitatively how the model can predict the outcome of such training.
The first set-up consisted of repetitions of two phases with different effective work rates: an active interval of length at work rate
, and a resting interval of length
at work rate
. This scheme was repeated until either of three conditions was reached: exhaustion, defined as an inability to maintain the prescribed work rate, an emptied fuel supply, or a maximum total time. The total time was limited to 1 h,
=3600 s. The total exercise time
and the total performed work
, but also the total work
performed on the active work rate level, were seen as the main results from the simulations.
Many numerical simulations were performed for parametric case (a). In order to represent realistic exercises, simple timing schemes were primarily considered, e.g., equal active and resting time periods, , and not excessively complicated periods of time, such as fractions of seconds. Some illustrative and representative results for this case are given in , for a few cases with active work rates
, and resting work rates up to the maximum aerobic power,
. The interval paradigms obviously allow much higher total work to be produced than the constant cases in . For instance, the maximum total work under constant work rate can be calculated from as
kJ and =
kJ, respectively, for
W and
W.
Table 4. Interval exercise tests, with variable active and resting work rates, and with different repetitive interval lengths. Active and rest periods of equal lengths . The table gives the maximal time
, and the total work
completed at that time. Parametric case (a), , and infinite fuel supply.
For parametric case (b) in , with slower fatigue dissipation, the times to exhaustion are in general considerably shorter than the ones given in , as fatigue effects will be more severe (not shown). The differences between the different paradigms thereby become much smaller. The parametric case (c) gives even more pronounced effects, as it contains a higher value for , i.e., more pronounced effects on fatigue from anaerobic work. Only for active work rates just above
, long interval exercises and high total work output are then possible.
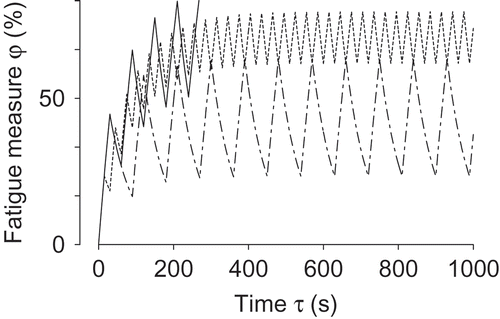
The simulated behaviour during interval exercise is primarily described by fatigue accumulation and dissipation. The variations of the fatigue measure over time for a few cases of
,
(
W,
W, parameter case (a)) are shown in . The increase of fatigue during active periods and the exponential decrease during rest are clearly seen.
Figure 4. Variation of fatigue measure with time for interval exercises with different regimes, all with the active work rate
W, and resting work rate
W. Parametric case (a), . Line types:
s (solid);
s (dotted);
s;
s (dash-dotted).
The model was then used for an investigation of how unequal active and resting intervals affected the performed work. Here we only compare results for parametric case (a), an active work rate W, a resting work rate
W, with variable times
and
. The total active work
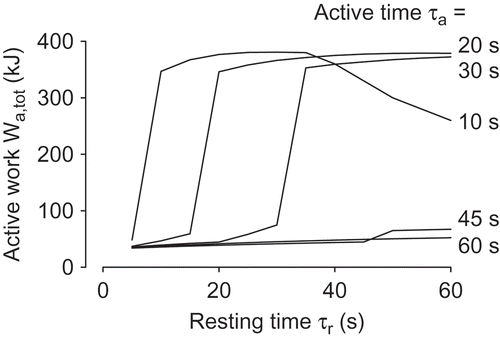
was here seen as the quantity to maximize. A selection of results are shown in , as functions of the resting time period
for a set of active time periods
. The maximum active work in this figure relates to
s,
s with
kJ, using a total time for the exercise
s.
Figure 5. Simulations of interval tests, with W,
W. Work produced during active intervals as functions of rest period lengths
for various active interval lengths
. Parametric case (a), , and infinite fuel supply. Total exercise time limited to 1 h.
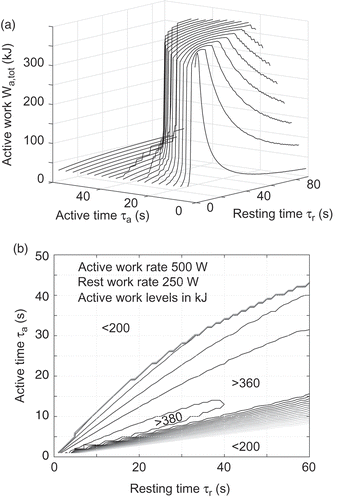
A larger set of curves, similar to the ones in , are shown in a 3-D projection in , which provides a view on the dependence on interval timing. Closer to a mathematical optimization view, a level map of the obtained active work as a function of the active and resting time values is given in . A strict optimization gave a global optimum for active work close to s,
s. Moreover, the figure clearly shows that all time combinations with
and
gave very similar high active work values; small variations (<0.5 kJ) occurred, primarily due to the numerical discretization.
Figure 6. Optimization view on active work performed during interval training simulations, with variable active and resting times
(
W,
W). Parametric case (a), , and infinite fuel supply. (a) 3-D view. (b) Level map. The slight waviness in these curves arises from the interpolations between the simulated cases with 1-second intervals for both variables.
To study the effects of a short interval training scheme, a similar set of simulations was performed with available time limited to s,
W, and
W. Simulations found that equal times
gave a higher total active work than other tested timing schemes,
kJ in
. The shorter exercise time thus allows a much higher average work rate: 60% of the active work in 30% of the exercise duration.
Discussion
A physiological model for fatigue in connection with whole-body physical exercise focusing on the entire body rather than on individual muscles has been developed. This model describes important aspects of human fatigue, including reductions in available anaerobic power and the efficiency of power production, as well as the influence of a limited supply of carbohydrates on the long-term capacity for work. The model is also relatively simple and well-defined, as it describes the current status of an individual on the basis of five parameters, and makes use of a time-evolution algorithm in which the work produced, fatigue, and fuel supply are updated often (at 50 Hz in the present case) during exercise. This frequency of updating has been shown to be more than sufficient for numerical accuracy with respect to the long-term goal of creating an optimization algorithm for, e.g., athletic skiing. A verification of this statement shows that the total work produced in the cycle ramp test for case (a) in differs by less than 7 J from the value obtained for a very short time step (3200 Hz), with the total work in the order of 400 kJ. The difference is below 100 J for this case even with time steps corresponding to 6.25 Hz.
Basic tests demonstrate that the model produces qualitatively relevant predictions of the fatigue effects on the work production. Work rates below a specified aerobic power limit can thereby be sustained for a long time, and are only limited by the available carbohydrate fuel (which was here chosen at rather low values, in order to demonstrate the effect). Higher work rates will demand anaerobic contributions, and will also create fatigue, which affects the efficiency of the work rate. For work rates not too far above the aerobic capacity, the fatigue effects will be limited, and this rate will reach a steady state at which fatigue accumulates and dissipates at equal rates, . Work will then be produced at a higher carbohydrate cost than at lower work rates, thereby shortening the simulated exhaustion time. At higher work rates, the fatigue effects on the available anaerobic power and work efficiency will limit the exercise time, even if fuel is still available, .
The model demands a number of parameters, the main ones being the maximum aerobic work rate (which can be held for a long time, say, more than 1 h) and a maximum instantaneous work rate (which can be held for a very short time, say, a few seconds).
Two other parameters are the fuel available when exercise begins and a parameter reflecting accumulation of fatigue, describing how fatigue results from anaerobic work. A final parameter defines the time scale of fatigue dissipation. This time scale can be expected to vary with the training status of individuals, but was kept constant at 1 min in the present numerical experiments, except for parametric case (b) in , where it was increased to 2 min, which resulted in faster fatigue development, and . A similar parameter is used and discussed by Moxnes et al. [Citation38], where values of about half a minute are considered.
The individual work rate capacities and dissipation rates can be experimentally deduced, by systematic physiological testing, and an inverse application of the model, simulating the time variations of the prescribed effective work rate in the paradigm. This also points to the possibilities of unifying the results obtained through different testing methods. The performed numerical experiments, for instance, show that the assumed capacities will define the relationship between constant work rate and time to exhaustion, . This will be hyperbolic, and can also be related to the critical power expression in Equation (1).
Individual measurements of the time to exhaustion at different specified (constant or systematically varied) work rates can thereby provide reliable estimates for the parameters. Procedures for calibration of such parameters are of high interest.
For interval training, the model indicates that the active periods should be shorter than half the exhaustion time at this active work rate. Otherwise, not even rather long resting periods will reduce the fatigue enough to allow the next active interval. The model also indicates that the work rate during resting periods should rather be, say, 75–80% of the maximum individual aerobic work than lower in order to obtain maximum total work, . In general, the simulations show that the total work produced in an interval session can be several times the work done in an all-out exercise when the same active work rate is held constant. The further conclusions on interval training are based on the assumption that the work produced during the active intervals should be maximized for optimal training. Other settings of the present model can give answers on, for instance, the highest active work rate possible to hold and the optimal rest periods, when the objective is to complete a selected number of repeated active intervals within a maximum time frame.
The general conclusion from the work is thereby that although individual capacity for work is more complex than what is predicted by the critical power equation, this capacity is nonetheless primarily determined by a limited number of parameters. Systematic testing can provide current values for these factors and, utilizing this model, these qualitative indicators of physiological status can be employed to compare individuals, as well as to develop exercise strategies designed to maximize a chosen criterion. This approach highlights the question what can be considered as efficient training, and the expression for this in mathematical terms. The descriptions above assume implicitly that a maximal work measure (either total or active) performed during a training session provides such a criterion, but the model can readily be modified to also test other options. Moreover, this model can provide guidelines for the physiological evaluation of the influence of different strategies on individual parameters over time.
Conclusion
We here present a rather simple mathematical model of human fatigue during whole-body exercise, where essential factors are lumped together in functional expressions. The model provides qualitatively relevant representations of well-known exercise outcomes and can easily be adjusted to incorporate the measured physiological parameters to yield individual as well as group-based quantitative results.
Additional information
Funding
References
- D.A. Winter, Biomechanics and Motor Control of Human Movement, 3rd ed., Wiley, Hoboken, NJ, 2005.
- R.M. Enoka, Neuromechanics of Human Movement, 3rd ed., Human Kinetics, Champaign, IL, 2002.
- C.L. Bottasso, B.I. Prilutsky, A. Croce, E. Imberti, and S. Sartirana, A numerical procedure for inferring from experimental data the optimization cost functions using a multibody model of the neuro-musculoskeletal system, Multibody Syst. Dyn. 16 (2006), pp. 123–154. doi:10.1007/s11044-006-9019-1
- A.V. Terekhov, Y.B. Pesin, X. Niu, M.L. Latash, and V.M. Zatsiorsky, An analytical approach to the problem of inverse optimization with additive objective functions: An application to human prehension, J. Math. Biol. 61 (2010), pp. 423–453. doi:10.1007/s00285-009-0306-3
- M. Kaphle and A. Eriksson, Optimality in forward dynamics simulations, J. Biomech. 41 (2008), pp. 1213–1221. doi:10.1016/j.jbiomech.2008.01.021
- A. Eriksson and K. Svanberg, Optimization in simulations of human movement planning, Int. J. Numer. Methods Eng. 87 (2011), pp. 1127–1147. doi:10.1002/nme.v87.12
- Y. Xiang, J.S. Arora, and K. Abdel-Malek, Optimization-based prediction of asymmetric human gait, J. Biomech. 44 (2011), pp. 683–693. doi:10.1016/j.jbiomech.2010.10.045
- M. Stelzer and O. Von Stryk, Efficient forward dynamics simulation and optimization of human body dynamics, ZAMM 86 (2006), pp. 828–840. doi:10.1002/(ISSN)1521-4001
- J. Reardon, Optimal pacing for running 400- and 800-m track races, Am. J. Phys. 81 (2013), pp. 428–435. doi:10.1119/1.4803068
- J.B. Keller, Optimal velocity in a race, Am. Math. Monthly 81 (1974), pp. 474–480. doi:10.2307/2318584
- A.J. Ward-Smith, A mathematical theory of running, based on the first law of thermodynamics, and its application to the performance of world-class athletes, J. Biomech. 18 (1985), pp. 337–349. doi:10.1016/0021-9290(85)90289-1
- G. van Ingen Schenau, J. de Koning, and G. de Groot, Optimisation of sprinting performance in running, cycling and speed skating, Sports Med. 17 (1994), pp. 259–275. doi:10.2165/00007256-199417040-00006
- B. Roelands, J. de Koning, C. Foster, F. Hettinga, and R. Meeusen, Neurophysiological determinants of theoretical concepts and mechanisms involved in pacing, Sports Med. 43 (2013), pp. 301–311. doi:10.1007/s40279-013-0030-4
- K. Thomas, M.R. Stone, K.G. Thompson, A. St Clair Gibson, and L. Ansley, Reproducibility of pacing strategy during simulated 20-km cycling time trials in well-trained cyclists, Eur. J. Appl. Physiol. 112 (2012), pp. 223–229. doi:10.1007/s00421-011-1974-4
- S. Lazzer, D. Salvadego, E. Rejc, A. Buglione, G. Antonutto, and P.E. Di Prampero, The energetics of ultra-endurance running, Eur. J. Appl. Physiol. 112 (2012), pp. 1709–1715. doi:10.1007/s00421-011-2120-z
- S. Volianitis and N.H. Secher, Rowing, the ultimate challenge to the human body – Implications for physiological variables, Clin. Physiol. Funct. Imaging 29 (2009), pp. 241–244. doi:10.1111/cpf.2009.29.issue-4
- A. Lucia, C. Earnest, and C. Arribas, The tour de France: A physiological review, Scand. J. Med. Sci. Sports 13 (2003), pp. 275–283. doi:10.1034/j.1600-0838.2003.00345.x
- V. Billat, J.C. Renoux, J. Pinoteau, B. Petit, and J.P. Koralsztein, Times to exhaustion at 90,100 and 105% of velocity at V˙O2max (Maximal aerobic speed) and critical speed in elite longdistance runners, Arch. Physiol. Biochem. 103 (1995), pp. 129–135. doi:10.3109/13813459508996126
- H.C. Holmberg, H. Rosdahl, and J. Svedenhag, Lung function, arterial saturation and oxygen uptake in elite cross country skiers: Influence of exercise mode, Scand. J. Med. Sci. Sports 17 (2007), pp. 437–444.
- B. Kvamme, V. Jakobsen, S. Hetland, and G. Smith, Ski skating technique and physiological responses across slopes and speeds, Eur. J. Appl. Physiol. 95 (2005), pp. 205–212. doi:10.1007/s00421-005-1332-5
- J. Moxnes and Ø. Sandbakk, The kinetics of lactate production and removal during whole-body exercise, Theor. Biol. Med. Modelling 9 (1) (2012), pp. 7. doi:10.1186/1742-4682-9-7
- N. Ørtenblad, J. Nielsen, B. Saltin, and H.-C. Holmberg, Role of glycogen availability in sarcoplasmic reticulum Ca2+ kinetics in human skeletal muscle, J. Physiol. 589 (2011), pp. 711–725. doi:10.1113/tjp.2011.589.issue-3
- D.G. Allen, G.D. Lamb, and H. Westerblad, Skeletal muscle fatigue: Cellular mechanisms, Physiol. Rev. 88 (2008), pp. 287–332. doi:10.1152/physrev.00015.2007
- R.H. Morton, The critical power and related whole-body bioenergetic models, Eur. J. Appl. Physiol. 96 (2006), pp. 339–354. doi:10.1007/s00421-005-0088-2
- D.W. Hill, The critical power concept, Sports Med. 16 (1993), pp. 237–254. doi:10.2165/00007256-199316040-00003
- A.M. Jones, A. Vanhatalo, M. Burnley, R.H. Morton, and D.C. Poole, Critical power: Implications for determination of V˙O2max and exercise tolerance, Med. Sci. Sports Exerc. 42 (2010), pp. 1876–1890. doi:10.1249/MSS.0b013e3181d9cf7f
- J. Dekerle, M. Sidney, J.M. Hespel, and P. Pelayo, Validity and reliability of critical speed, critical stroke rate, and anaerobic capacity in relation to front crawl swimming performances, Int. J. Sports Med. 23 (2002), pp. 93–98. doi:10.1055/s-2002-20125
- D.W. Hill, C. Alain, and M.D. Kennedy, Modeling the relationship between velocity and time to fatigue in rowing, Med. Sci. Sports Exerc. 35 (2003), pp. 2098–2105. doi:10.1249/01.MSS.0000099111.78949.0E
- L. Simpson, A. Jones, A. Vanhatalo, and D. Wilkerson, Influence of initial metabolic rate on the power-duration relationship for all-out exercise, Eur. J. Appl. Physiol. 112 (2012), pp. 2467–2473. doi:10.1007/s00421-011-2214-7
- R.H. Morton and L.V. Billat, The critical power model for intermittent exercise, Eur. J. Appl. Physiol. 91 (2004), pp. 303–307. doi:10.1007/s00421-003-0987-z
- J.F. Moxnes and K. Hausken, The dynamics of athletic performance, fitness and fatigue, Math. Comput. Model. Dyn. Syst 14 (2008), pp. 515–533. doi:10.1080/13873950802246473
- J. Helgerud, K. Höydal, E. Wang, T. Karlsen, P. Berg, M. Bjerkaas, T. Simonsen, C. Helgesen, N. Hjorth, R. Bach, and J. Hoff, Aerobic high-intensity intervals improve V˙O2max more than moderate training, Med. Sci. Sports Exerc. 39 (2007), pp. 665–671. doi:10.1249/mss.0b013e3180304570
- J.F. Moxnes and K. Hausken, Comparing VO2max improvement in five training methods, Advanced Stud. Theor. Phys. 6 (2012), pp. 931–957.
- A.W. Midgley, L.R. McNaughton, and M. Wilkinson, Is there an optimal training intensity for enhancing the maximal oxygen uptake of distance runners? Empirical research findings, current opinions, physiological rationale and practical recommendations, Sports Med. 36 (2006), pp. 117–132. doi:10.2165/00007256-200636020-00003
- Ø. Støren, S. Bratland-Sanda, M. Haave, and J. Helgerud, Improved V˙O2max and time trial performance with more high aerobic intensity interval training and reduced training volume, J. Strength Conditioning Res. 26 (2012), pp. 2705–2711. doi:10.1519/JSC.0b013e318241deec
- S. Seiler, K. Jøranson, B. Olesen, and K. Hetlelid, Adaptations to aerobic interval training: Interactive effects of exercise intensity and total work duration, Scand. J. Med. Sci. Sports 23 (2013), pp. 74–83. doi:10.1111/sms.2013.23.issue-1
- I. Tabata, K. Irisawa, M. Kouzaki, K. Nishimura, F. Ogita, and M. Miyachi, Metabolic profile of high intensity intermittent exercises, Med. Sci. Sports Exerc. 29 (1997), pp. 390–395. doi:10.1097/00005768-199703000-00015
- J.F. Moxnes, K. Hausken, and Ø. Sandbakk, On the kinetics of anaerobic power, Theor. Biol. Med. Modelling 9 (2012), pp. 29. doi:10.1186/1742-4682-9-29
- D. Allen and H. Westerblad, Lactic acid--The latest performance-enhancing drug, Science 305 (2004), pp. 1112–1113. doi:10.1126/science.1103078
- L.B. Gladden, Lactate metabolism: A new paradigm for the third millennium, J. Physiol. 558 (2004), pp. 5–30. doi:10.1113/jphysiol.2003.058701
- H. Westerblad, D.G. Allen, and J. Lännergren, Muscle fatigue: Lactic acid or inorganic phosphate the major cause? News Physiol. Sci. 17 (2002), pp. 17–21.
- J.H. Wilmore, D.L. Costill, and W.L. Kenney, Physiology of Sport and Exercise, 4th ed., Human Kinetics, Champaign, IL, 2008.
- K. Currell and A.E. Jeukendrup, Superior endurance performance with ingestion of multiple transportable carbohydrates, Med. Sci. Sports Exerc. 40 (2008), pp. 275–281. doi:10.1249/mss.0b013e31815adf19
- L.M. Burke, Fueling strategies to optimize performance: Training high or training low? Scand. J. Med. Sci. Sports 20 (2010), pp. 48–58. doi:10.1111/sms.2010.20.issue-s2