
 ?Mathematical formulae have been encoded as MathML and are displayed in this HTML version using MathJax in order to improve their display. Uncheck the box to turn MathJax off. This feature requires Javascript. Click on a formula to zoom.
ABSTRACT
Mathematical models have been used widely to investigate the vehicle-passenger-infrastructure dynamical interaction; however, the responses of various heavy-duty city bus models to estimate ride comfort induced by road roughness are still unknown. In this study, the comparison of dynamical response of buses used in city transport is investigated based on multi-degrees-of-freedom (DOF) bus models developed in MATLAB/Simulink and correlated against passenger ride comfort criteria. The results showed that 9-DOF full bus model is the best option to estimate passenger ride comfort within an error of 2%, as compared to 5-DOF half and 3-DOF quarter bus models with 7% and 20% errors using one wheel-track, and 24% and 36% errors using two wheel-tracks, respectively. The error was calculated as the difference between simulated results from three bus models and the measured data. These mathematical bus models can be customized for estimating passenger ride comfort and surface roughness of dedicated bus/bus-rapid-transit lanes.
Introduction
The human-centric design approach has emerged in recent decades as the central concept in developing technology and infrastructure for human beings [Citation1,Citation2]. This trend is also applicable in public transportation, with emphasis on the experience of passengers as they make use of public transport service [Citation3]. Consequently, from the road infrastructure aspect, maintenance of pavement surface to keep in good conditions is vital since excitation from rough road contributes significantly to passenger ride quality. It is of utmost importance in the case of public transport to improve ride quality as a crucial incentive to attract higher ridership [Citation4,Citation5].
Vehicle dynamics models have long been developed for different purposes such as to design and optimize suspension system [Citation6,Citation7], to evaluate passenger ride comfort and vehicle handling [Citation8,Citation9], and to evaluate road roughness conditions [Citation10,Citation11]. Multibody dynamical models have been used intensively [Citation12,Citation13] but require a massive amount of data and computation efforts. Regarding mathematical models and road roughness evaluation, the most commonly used vehicle models are quarter-car-simulation (QCS), half-car-simulation (HCS) and full-car-simulation (FCS), of which the QCS has been used most often due to its simplicity. A comprehensive summary by Múčka [Citation14] shows that among various indices to evaluate road roughness, there are eight QCS, two HCS and one FCS models. A study by Cantisani & Loprencipe [Citation15] has contributed another six-degrees-of-freedom (6-DOF) FCS model as an evaluation tool for road roughness and whole-body vibration, whereas another study [Citation8] provided an HCS model for motorcycle, car, SUV and truck for assessing ride quality on Portland cement concrete pavements. Dynamics models of car and truck, however, would be not applicable to the bus, e.g. heavy-duty city bus which is asymmetric, in larger dimensions, equipped with air suspension, and carrying many passengers on-board.
Regarding bus dynamics, relatively few studies are found in the literature and often focused more on vehicle design such as seat configuration, stiffness and damping parameterization. A study by Sekulić and Dedović [Citation7] has evaluated the bus suspension system based on 3-DOF QCS to optimize the bus vibrational behaviours. In another study [Citation16], a 10-DOFs bus model was developed to investigate the ride comfort of intercity bus users. Recently, the same full bus model was built using MSC.ADAMS multibody simulation software to establish the ‘equal oscillatory comfort zones’ [Citation17]. A much higher DOF low-floor urban-bus model was developed using Finite Element Method [Citation18] or by integrating finite element discretization into multibody dynamics [Citation19]. For such complicated multibody systems, even with high simulation accuracy, it is difficult for transport and pavement engineers to use them to evaluate road roughness condition in a large city network. In this case, the vehicle-infrastructure dynamics interaction can be simulated sufficiently based on the equations of motion of the vehicle [Citation20], such as a 6-DOF half bus model [Citation21] or a 3-DOF quarter bus model (Bus Ride Index) to correlate passenger ride comfort with road surface irregularities [Citation22].
The use of Bus Ride Index, however, is in the question of whether this 3-DOF quarter bus model [Citation22] can deliver reliable results due to information lost during the modelling simplification. Notably, the effects of roll and pitch motions have been not considered. It is well noted from the literature that the FCS captures the full behaviour of the vehicle body when comparing 2-DOF QCS, 4-DOF HCS and 7-DOF FCS with road input as a step-hump [Citation23,Citation24], or when comparing 2-DOF QCS, 4-DOF HCS and 15-DOF FCS using a multibody simulation software with experimental ride comfort data from a vehicle travelling on a Belgian pavement [Citation25]. Surprisingly, the simplified 2-DOF QCS generated non-correlated output as compared to 15-DOF FCS when estimating ride comfort results [Citation25]. These methods, however, have limitations such as constant car speeds and the inclusion of artificial road profiles or based on a designated road segment/short hump. The use of artificial profiles to evaluate their effects on users is not adequate according to the investigation by Loprencipe & Zoccali [Citation26]. City bus operation is more diversified comprising stop-and-go phenomena along bus corridors and under variable passenger load. More importantly, the inclusion of non-linear air suspension into a mathematical heavy-duty bus model is still limited. The responses of various heavy-duty city bus models to estimate ride comfort induced by road roughness are still unknown.
These research gaps have thus motivated this study to compare different mathematical bus models for calculating passenger ride comfort as based on human-centric design approach in public transport [Citation3]. Multi-degrees-of-freedom (3-DOF quarter, 5-DOF half and 9-DOF full) bus models were built in MATLAB/Simulink, and their performances in calculating passenger ride comfort on buses operating along bus lanes were compared. The method of mathematical modelling of vehicle dynamics is not new; however, the established bus models equipped with air-suspension and their comparison have yet to exist/be well reported in the literature. Most often, the full bus models are built using MSC.ADAMS/Simpack multibody simulation software or Finite Element Method which, though sophisticated in their own rights, have been around for a long time and are data-centric too. This study focuses on the fundamental interactions between road, vehicle and passenger. Using simpler methods entail less data on vehicle dynamics, and the industry can more readily apply the results for pavement engineering application such as to evaluate road surface conditions [Citation13,Citation14].
Bus technical parameters were collected from manufacturers while bus lane roughness was sampled using a professional multi-laser road profiler. Vertical acceleration and GPS data were collected from a portable seat-pad accelerometer. This is the first time an experimental comparison between three mathematical bus models has been conducted, providing comprehensive insights into dynamics behaviours of a heavy-duty city bus, under conditions of air-suspension configuration, stop-and-go phenomenon and passenger load variation. By matching GPS data and speed profiles, the ride comfort indicator can be compared in time-series domain. These mathematical bus models can be customized for estimating passenger ride comfort and surface roughness of dedicated bus/bus-rapid-transit lanes worldwide. This study focuses on vertical accelerations as a measure of ride quality, not longitudinal jerk or other measures; and based on the experimental data with the practical application rather than being restricted to the development of new models and modelling methods. Three bus dynamics models equipped with air-suspension were built to estimate ride comfort and road roughness through experimental study. The bus models have not been well studied in the literature where most studies have been focused on car and truck dynamics.
The remaining paper is structured as follows. Bus dynamics models such as 3-DOF quarter-bus-model (QBM), 6-DOF half-bus-model (HBM) and 9-DOF full-bus-model (FBM) are formulated and built using MATLAB/Simulink. In the next sections, bus parameters and experimental set-up are described, followed by the findings and discussion on the vehicle dynamics and ride comfort difference between simulated and measured data. The conclusion part sums up this study.
Mathematical bus dynamics models
This section introduces three bus dynamics models to be built, and for each of them the main assumptions are as follows:
Bus body parts are rigidly connected with each other.
The bus moves in a horizontal direction in a straight line, possibly with varying velocity.
Passenger mass and unsprung mass are considered constant in magnitude during simulation; however, sprung mass can be changed to present the varied weight loading due to multiple passengers on-board.
When the sprung mass is varied, the spring stiffness and damping coefficients are also adapted to maintain a constant damping ratio.
The uneven road surface is responsible for vibration transfer in the three bus models in the vertical direction.
Quarter-bus model (QBM)
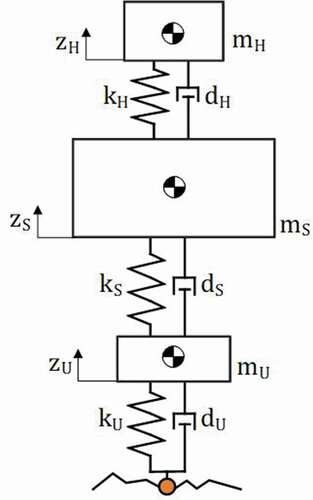
The simplest vertical oscillatory QBM consists of three aligned masses, representing the equivalent human-seat mass (mH), half of the unsprung mass (mU) and a quarter of the sprung mass (mS). The vertical alignment assumes that the affected human is sitting right above the suspension system. The smoothed road elevation zR(t) induces vertical displacement of the human (zH), vertical displacement of the sprung mass (zS), and velocity to the system (,
) through the tyre’s spring-damper-system characterized by equivalent seat stiffness, equivalent spring coefficient of rear suspension, equivalent tyre stiffness at the rear axle (
,
,
) and equivalent seat stiffness damping, equivalent damping coefficient of the rear suspension, equivalent tyre damping at the rear axle (
,
,
). displays the 3-DOF QBM as well as its free body diagram.
Figure 1. Quarter-bus model (3-DOF)
From the free body diagram, the equations of motion (vertical acceleration of human-seat mass, sprung and unsprung mass – ,
,
) can be derived as follows:
Half-bus model (HBM)
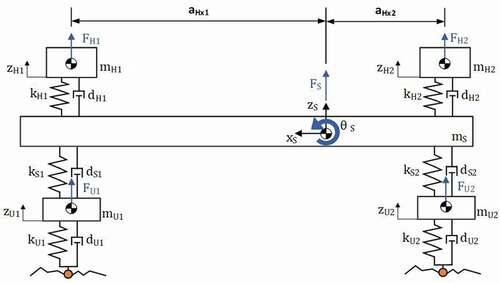
A better approximation of reality is achieved by adding the pitch movement to the model. This is attained by modelling the sprung mass as a rigid bar in the longitudinal direction with half of the total sprung mass and half of the moment of inertia (). It is supported, like the QBM, by two suspension systems connecting half of the unsprung masses (mU1, mU2) with the vehicle body (mS), depicting the front and the rear of the bus. Hence, the pitch motion of the sprung mass (θS) is introduced. displays the lumped mass model of the developed longitudinal HBM including the six DOFs (vertical acceleration of two human-seat masses
, one sprung mass
, two unsprung masses
, and pitch motion
of sprung mass) as highlighted. The structure of tyre’s spring-damper-system (stiffness k and damping d) is similar to the 3-DOF QBM with the subscripts 1 and 2 to depict the front and read locations.
Figure 2. Half-bus model (6-DOF)
By applying Newton’s second law, the equations of motion can be derived as follows:
with
Full-bus model (FBM)
The FBM developed in this part introduces the roll motion by modelling the sprung mass as a rigid plate, as can be seen in . In total, the developed FBM contains nine DOFs (vertical displacement of two human-seat masses
, one sprung mass
, two front unsprung masses
, one rear unsprung mass
; and pitch motion of sprung mass
, roll motion of sprung mass
and one rear unsprung mass
). Angles are again assumed to be small for the whole system, which is why the small-angle approach is applicable. The 3-dimensional FBM includes both wheel tracks with a time-shifted road input (zR2l, zR2r) for the rear axle. The structure of tyre’s spring-damper-system (stiffness k and damping d) is similar to the 6-DOF HBM with the subscript l and r to depict the left and right sides (whereas 1 and 2 are front and read locations).
Figure 3. Full-bus model (9-DOF)
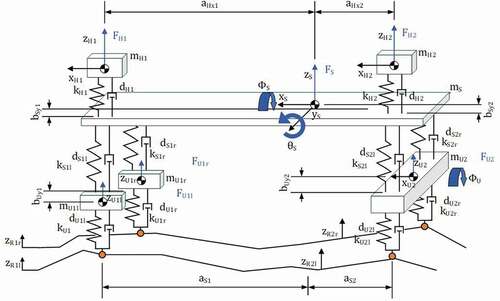
The two passengers (equivalent human-seat mass mH1, mH2) are allocated above the front and rear axles to make it comparable to the QBM and HBM. It is possible to include more passengers, but for model comparison, it is not necessary. Instead, the inclusion of more passengers can be done by varying the weight of the sprung mass from kerb weight to gross weight (10,77 tonnes to 19 tonnes). This variation will be shown later in the investigation on the transfer functions with different loading factors n = 0 to 1 from unladen to fully laden.
After applying Newton’s second law, the equations of motion for the full bus model can be derived as follows:
with
Across the three bus models, all parameters, their acronyms and values are described in detail in , and . In case of 3-DOF QBM and 6-DOF HBM, the related parameters are similar as those on the rear axle only and either on the left/right side of 9-DOF FBM, respectively.
Table 1. Bus model parameters human & seat
Table 2. Bus model parameters: sprung mass
Table 3. Bus model parameters suspension & unsprung mass
Experimental set-up
To simulate bus dynamics, technical data were referenced to the single-decker bus model Mercedes-Benz Citaro operating in urban areas [Citation27]. The bus body is asymmetric where the front axle can carry up to 7.245 t, and rear axle can carry 12 t when fully laden at 19 t. Detailed parameters with the acronym used for bus dynamics are shown in , and . Since not all bus parameters are available, some of them are referenced to the literature. In this regard, the damping ratio = 0.3 was chosen in favour of passenger ride comfort, which is one of important consideration for the urban bus. This is the recommendation from vehicle dynamics research and experiment [Citation28,Citation29]. The higher the ratio, the better the driving dynamics, whereas the lower the ratio, the better the ride comfort. In general, this ratio is around 0.2 to 0.3 and from 0.5 to 0.7 for commercial vehicles and racing vehicles, respectively. Passenger seat characteristics were selected concerning ride comfort optimization. The equations for the three models are all linear with no nonlinearity in the equations; however, the stiffness and damping parameters are changed from minimum to maximum value (see ) according to the loading variation. Mathematical air spring model is rather complicated as the investigated in [Citation30]. Therefore, the simplified configuration and calculation of the non-linear air-spring suspension were referred to the dynamic spring rate formula (EquationEquation 19(19)
(19) ) of the Firestone manufacturer [Citation31] as well as its application in [Citation22] as follows:
where k is the vertical spring rate (lbs./inch), is the gauge pressure at design height (lbs/in2),
is the internal air spring volume at the design height (in3),
and
are the effective area at 0.5 inches above the design height and below the design height (in2),
and
are the corresponding inner air volumes at 0.5 inches above the design height and below the design height (in3), respectively.
The experimental set-up, in this study, was conducted with the following steps (see detailed flowchart in ):
Figure 4. The flowchart of the experimental set-up
Developing 3-DOF QBM, 6-DOF HBM and 9-DOF FBM to estimate ride comfort;
Selecting bus lane segments with different road roughness levels;
Scanning the bus lane by a multi-laser road profiler;
Measuring on-board ride comfort index using a seat-pad accelerometer; and
Comparing the measured and calculated ride comfort levels to evaluate the developed bus dynamics models.
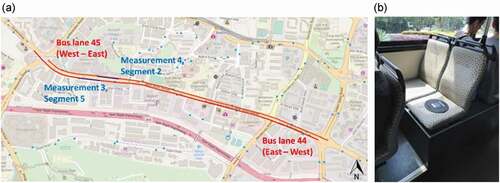
A 2.3 km bus lane segment was selected for field measurement, in which the Bus lane 45 is from West to East and Bus lane 44 is from East to West in Alexandra district, Singapore (). This straight segment was chosen to avoid the impact of lateral acceleration on the measurement data. Multi-laser road profiler was used to measure bus lane longitudinal profiles with the sampling rate of 25 mm. The International Roughness Index (IRI) is used to characterize road surface condition [Citation32,Citation33]. It was developed by the World Bank in the 1980s, in order to standardize road roughness measurement and evaluation. Using a vehicle velocity of 80 km/h, the IRI was established on straight test track sections with a length of 320 m (~0.2 miles) to eliminate the effect of lateral errors. Different road segment lengths (e.g. 160 m, 100 m or 20 m) can also be used for the calculation, depending on the decision of local transport authority, e.g. in Singapore both IRI at 100 m unit and 10 m unit are used by the Land Transport Authority to monitor the pavement system. The IRI, also known as the average rectified slope, is calculated according to EquationEquation 20(20)
(20) :
Figure 5. Field measurement set-up a) selected road segment; b) portable accelerometer
where IRI is the average rectified slope (m/km or in/mi), is the length of the evaluated road segment (km or mi),
is the time of the measurement (s), which can also be expressed as the relationship of distance and velocity,
is the vertical velocity of the vehicle body (m/s) and
is the vertical velocity of the axle (m/s).
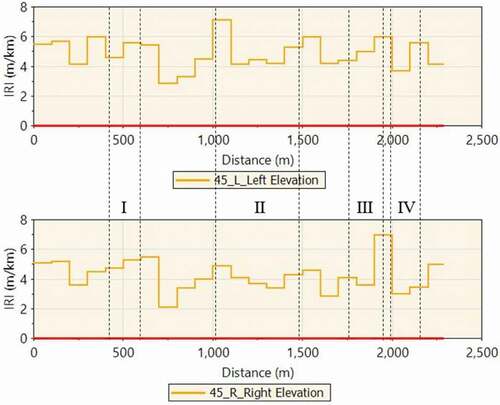
Bus lane 44 has IRIleft = 4.4, IRIright = 3.51 (m/km), while Bus lane 45 has IRIleft = 4.85, IRIright = 4.21 (m/km). illustrates the IRI values of the Bus lane 45 for every 100 m, ranging from 2 to 7 (m/km) and calculated using ProVal software [Citation34]. It is evident from IRI values that this segment contains different road conditions from smooth to very rough surfaces with different left and right-wheel-track profiles.
Figure 6. IRI value of the Bus lane 45 for every 100 m with four sections (I, II, III, IV) for further investigation (a) left-wheel track; (b) right-wheel track
A seat-pad accelerometer SV100A, loaded by a 70 kg human, was used to measure acceleration data. The rear-axle seat is one of the most critical locations where often higher vertical acceleration was collected [Citation17]. The device is controlled wirelessly by a mobile application and can collect acceleration data at a sampling rate of 750 Hz and GPS data at 1 Hz, which in turns were used to match the vehicle model’s simulation output. This sampling frequency is satisfied as two times greater than the maximum considered frequency of 1 ~ 100 Hz to be considered primarily [Citation35], according to the Sampling Theorem [Citation36]. Raw vertical acceleration (az) is processed to frequency-weighted acceleration (awz(t)) and root-mean-square frequency-weighted acceleration (awz), as calculated by EquationEquation 21(21)
(21) . The frequency-weighted acceleration is determined throughout 23 one-third-octave bands of frequency range from 0.5 Hz to 80 Hz that are most influencing on human response to vibrations as defined in ISO 2631–1:1997. The relative levels of comfort according to levels of awz are listed in .
Table 4. Levels of comfort corresponding to root-mean-square acceleration in ISO 2631–1
where: awz(t) is the weighted acceleration as a function of time (m/s2); T is the duration of the measurement (s); are the frequency weightings in one-third-octave bands for seated positions;
is the vertical root-mean-square acceleration for the i-th one-third-octave band (m/s2).
Findings and discussion
Comparison of simulation and measurement results
Four measurements with different lengths were recorded for comparison with simulation results. These sections have the most comparable GPS data between longitudinal road profiles and acceleration measurement using the accelerometer. The dedicated bus lanes help to improve the matching of GPS data between the field-measured bus lane longitudinal profiles and bus wheel trajectories. shows the comparison of frequency-weighted acceleration awz(t) in time-series and the root-mean-square frequency-weighted vertical acceleration awz between simulation and field-measurement at different velocity (m/s). The illustration shows data comparison only for the right-wheel-track on the rear-axle location of the 3-DOF QBM and 6-DOF HBM with the 9-DOF FBM. The fundamental of the root-mean-square frequency-weighted acceleration (awz) is for a duration of measurement (e.g. in T second), but not in every second where there are some peak values at a certain time step. However, the integrated value after T seconds is comparable between measured and simulated outputs. In general, awz is in the range of ‘not uncomfortable’ to ‘a little uncomfortable’ as a reference to . Good matching results are observed from simulation output and measurement data under the speed changes, especially for the peak value. Due to the slight misalignment between bus wheel trajectories and road profiles, perfect matching is not possible to achieve.
Figure 7. The frequency-weighted awz_simulation(t) and awz_measurement(t) at different sections for the right-wheel-track only
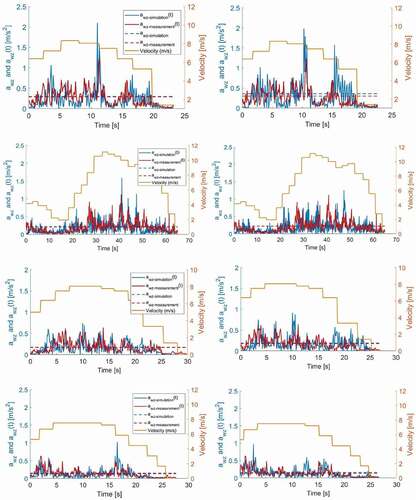
It is better to track the experiment results over time by including root-mean-square value of the time-varying error. However, the time-varying error is not feasible due to the peak values being slightly shifted backwards/forwards given the misalignment between bus wheel trajectories and road profiles. For artificial road profiles, controlled road surface and wheel tracks, or constant travel speed, it is easier to obtain good agreement such as in the investigation by Hamersma [Citation25]. Still, it is more challenging in the case of practical experiments with more uncontrollable parameters. Using awz for a duration of measurement for comparison is thus more feasible in this calculation.
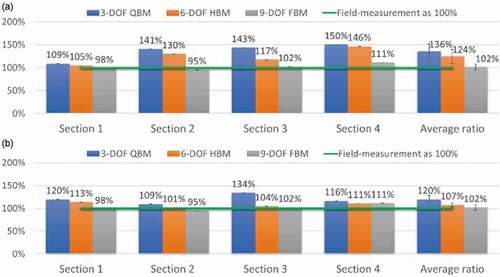
shows the ratio r = awz-simulation/awz-measurement of all section measurements and the average ratios of r = 136% (std = 16%), r = 124% (std = 15%) and r = 102% (std = 6%) as found for the three QBM, HBM and FBM, respectively. Data comparison is based on the average r-ratios of both left-, and right-wheel tracks of the 3-DOF QBM and 6-DOF HBM. The 9-DOF FBM provides the best matching results while 3-DOF QBM overestimates the ratio and 6-DOF HBM is in between. These trends are also observed at individual section measurements; however, they varied over the four measurements. In contrast with the previous study [Citation25] that concluded that QCS does not have ‘any correlation’ with measurement data, this study has shown that QBM results are higher than that of FBM at 36% when using both wheel-tracks and 24% when using only the right-track, respectively. Whereas HBM results are higher than that of FBM at 20% when using both wheel-tracks and 7% when using only the right-track, respectively. shows similar results for only right-wheel track comparison. Another left-wheel track has accounted for around 10% of result variation compared to the right-wheel track alone where in situ measurement was conducted.
Figure 8. Awz_simulation/awz_measurement ratios at different sections and the average ratios (standard deviation) (a) using both wheel tracks; (b) using only the right-wheel track where the field measurement was taken
FBM provides the most reliable results; however, its modelling complexity is the highest in terms of data requirement and modelling algorithms. Several main factors made the outputs from QBM and HBM being higher than those of FBM. Firstly, QBM only considers vertical oscillation while HBM and FBM take pitch motion, and both pitch and roll motion, respectively, into account. This helps to reduce vertical acceleration since when rear tyres go over the hump, the front tyres stay on the ground in case of HBM and FBM, which is contrasted to QBM. Secondly, the outputs from the three models can be similar as in section 1 (using both wheel tracks) when there are less roll and pitch motions. This means that the right and left road profiles are relatively uniform. Regarding different results in the literature [Citation25], it is noted that this study estimated ride comfort index awz at human mass on a seat cushion with consideration of optimal seat damping and stiffness configuration. However, the study by Hamersma [Citation25] does not model the human mass and awz was calculated based on sprung mass oscillation. As a result, the estimated awz is overestimated significantly in case of QCS.
Over the comparison of awz(t) in the time domain, there is always the trend that simulated results are higher than field-measured results. This can be explained by the tyre being modelled as a point contact of the mathematical bus models which is different from the dual-wheel rear axle. The real dual-wheel helps to reduce the impact of road roughness, for example when one tyre goes over a small pothole while another tyre stays on flat ground to keep the whole dual-wheel in the flat, balanced position.
Comparison of the response of bus dynamics and car dynamics
In the urban context, a heavy bus can transport many passengers, e.g. can be more than 100 people, which makes the bus weight to be changed significantly during its journey with boarding and alighting passengers. Depending on the number of passengers on board, air-suspension plays a vital role to keep the natural frequency of the system stable to offer high ride quality. This bus dynamics is totally different from car dynamics where only several passengers are sharing the narrow car space during its journey.
To investigate the behaviour of the bus dynamics models under passenger load change, the transfer functions of QBM vehicle responses are considered and illustrated (). For comparison, the QCS for IRI (since IRI is built from quarter-car-simulation/model) [Citation10] is calculated for the transfer function of sprung mass displacement over unsprung mass, whereas QBM’s transfer function considers the response of the sprung mass to road profile inputs. The same travel speed of 80 km/h is used for comparison purpose only. Although they are both quarter vehicle model, the QCS of IRI has two degrees-of-freedom (without human mass), and QBM has three degrees-of-freedom (with human mass) similar to the Truck Ride Index concept [Citation11].
Figure 9. The difference in response from transfer functions of IRI-QCS and QBM as temporal frequency (Hz) and spatial frequency (cycle/m)
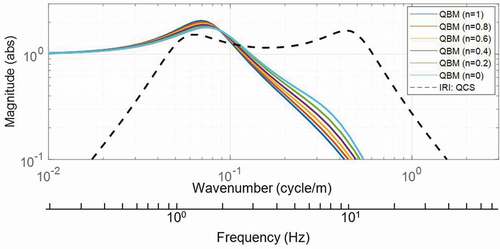
The dominant peak of the IRI-QCS response is near 1 and 10 Hz [Citation10] (or wavenumber around: 0.06 cycle/m and 0.5 cycle/m, or wavelength around: 2 m and 17 m), while QBM body bounce frequency is near 1.54 Hz, in which different passenger loading factors (n = 0 ÷ 1 from unladen to fully laden) do not influence the transfer functions of QBM. From 3 Hz to 10 Hz, there is a variation of transfer functions due to the change of passenger loading; however, the variety is not significant thanks to the effect of the air suspension that is able to adapt its stiffness and damping parameters to the passenger loading change. This comparison has shown that the developed bus models have captured and represented the bus dynamics appropriately under passenger loading variation. also shows a similar trend for the wavenumber, travel speed of 80 km/h was considered when calculating the transfer functions concerning the spatial frequency. More difference can be expected under the speed change because the heavy-duty city bus is often operated at lower speed levels than cars.
From the overall ratio comparison shown in , ride comfort value from QBM can be converted to that of higher DOF vehicle model, such as FBM ≈ 85% QBM for single wheel-track calculation, and FBM ≈ 75% QBM for two wheel-track calculation, or vice versa. summarizes the relative ratios of outputs from different car dynamics models in the literature and compares them with the output of this recent study on bus dynamics. The IRI, Half- and Full Roughness Index (HRI and FRI) are widely used to evaluate road surface condition. In case of both wheel-tracks calculation the findings of ride comfort ratio of HBM ≈ 0.89 QBM is higher than the case of car dynamics where half-car roughness index HRI ≈ 0.8 IRImean of quarter-car roughness index [Citation32], or FBM ≈ 0.83 HBM and FBM ≈ 0.75 QBM is higher from the full-car roughness index FRI ≈ 76% HRI or FRI ≈ 69% IRImean [Citation37], respectively. It is worth emphasizing that these HRI and FRI are derived from IRI QCS, instead of simulating the half- and full-car dynamics models. This deviation can be explained by the inherent difference between car and bus dynamics, as well as the field-measured road profiles input for adequately evaluating ride comfort as the recommendation by Loprencipe & Zoccali [Citation26]. Once again, the finding results have confirmed the importance of this study and support the usage of Bus Ride Index [Citation22] with the cautions on vehicle dynamical modelling complexity, resulting in different outputs.
Table 5. Comparison of output between different vehicle type modelling, in which simulated results from full-vehicle model is equivalent to the field-measured data
Conclusions
This study on bus dynamics provides a detailed investigation of the behaviours of different bus models: 3-DOF QBM, 6-DOF HBM and 9-DOF FBM, from the perspective of passenger ride comfort. This is the first time a comprehensive comparison between three mathematical dynamics models of a heavy-duty city bus (19 tonnes) has been conducted, focusing on the actual travelling operation. The root-mean-square frequency-weighted acceleration awz induced on human mass above the rear axle is a primary location for comparison, in which similar output was observed from different measurements along the selected bus lane segment: awz(QBM) > awz(HBM) > awz(FBM), as a similar trend from the literature. Each bus model can be utilized depending on the specific study purpose, such as the widely used QCS as pragmatic approaches to design individual vehicle suspension and to evaluate road roughness [Citation38]. Based on these results, ride comfort value from quarter-bus-model can be converted to that of higher DOF bus models, or vice versa. These mathematical bus models can be customized for estimating passenger ride comfort and surface roughness of dedicated bus/bus-rapid-transit lanes worldwide.
This experimental study has explored a new method to compare between simulation and field-measurement operating on a bus lane. By matching GPS data and speed profiles, the frequency-weighted awz(t) and awz, ride comfort index can be compared in time-series domain. Notably, the developed algorithms can incorporate speed changes along the bus corridor that replicates the stop-and-go phenomenon of city bus service, resulting in more reliable outputs. The findings thus contribute to the literature by providing an understanding of the dynamics of different city bus models, applicable for road surface and ride comfort evaluation.
The study, however, contains limitations in its modelling simplification. The effects of other lateral and longitudinal accelerations have not been considered. Moreover, the human body can be modelled as an active mechanical system. The primary purpose of this study is focused on the development and comparison of simple mathematical dynamics models for evaluating road roughness and ride comfort for pavement engineering application, like the investigation by Cantisani & Loprencipe [Citation15]. Regarding further study, sensitivity analysis can be focused on a more significant number of road profiles to establish more precisely the r ratios. Bus models regarding ageing, operating speeds and noise variation can also be included.
Acknowledgments
This work is financially supported by the National Research Foundation Singapore under its Campus for Research Excellence and Technological Enterprise (CREATE) programme.
Disclosure statement
The authors declare that there is no conflict of interest
Additional information
Funding
References
- D. Mitchell, S. Claris, and D. Edge. Human-centered mobility: A new approach to designing and improving our urban transport infrastructure, Engineering. 2 1 (2016), pp. 33–36. https://doi.org/10.1016/j.eng.2016.01.030.
- L. Bogren, D. Fallman, and C. Henje, User-centered inclusive design: Making public transport accessible. In: International Conference on Inclusive Design–Royal College of Art, London, UK, 2009.
- T. Camacho, M. Foth, A. Rakotonirainy, M. Rittenbruch, and J. Bunker. The role of passenger-centric innovation in the future of public transport, Public Transport. 8 3 (2016), pp. 453–475. https://doi.org/10.1007/s12469-016-0148-5.
- T. Nguyen, D.Q. Nguyen-Phuoc, and Y.D. Wong. Developing artificial neural networks to estimate real-time on-board bus ride comfort, Neural Comput Appl. 3 (2020). https://doi.org/10.1007/s00521-020-05318-3.
- T. Nguyen, N. NguyenDinh, B. Lechner, and Y.D. Wong. Insight into the lateral ride discomfort of young-adult bus passengers at multiple postures: case of Singapore, Case Stud Transp Policy. 3 (2019). https://doi.org/10.1016/j.cstp.2019.07.002.
- K. Yu, A.C.J. Luo, and Y. He. Stability and vibration of a non-linear vehicle and passenger system, Proceedings of the Institution of Mechanical Engineers, Part K: Journal of Multi-body Dynamics. 216 (2002), pp. 109–116. https://doi.org/10.1243/14644190260070358.
- D. Sekulić and V. Dedović, The effect of stiffness and damping of the suspension system elements on the optimisation of the vibrational behaviour of a bus, International Journal for Traffic & Transport Engineering 1 (2011), pp. 231–244.
- H. Prem and G. Ayton, Improved techniques for assessing ride quality on concrete pavements. In: 8th International Conference on Concrete Pavements, Colorado, USA, 733–754, 2005.
- S. Talukdar, A. Mazumdar, M. Mullasseril, K. Kalita, and A. Ujjwal, Mathematical modeling in vehicle ride dynamics, SAE Tech Pap (2012). doi:https://doi.org/10.4271/2012-01-0056.
- M.W. Sayers. On the calculation of international roughness index from longitudinal road profile, Transp Res Rec. 1501 (1995), pp. 1–12. https://doi.org/10.1080/10643389.2012.728825.
- H. Prem, E. Ramsay, and J. McLean, A road profile based truck ride index (TRI). In: 6th International Symposium on Heavy Vehicle Weights and Dimensions, Saskatoon, Saskatchewan, Canada, 483–506, 2000.
- B.P. Minaker. The tangent stiffness matrix in rigid multibody vehicle dynamics, Math Comput Model Dyn Syst. 21 3 (2015), pp. 288–310. https://doi.org/10.1080/13873954.2014.953549.
- B.C. Jang and G. Choi. Co-simulation and simulation integration for a full vehicle dynamic system, Math Comput Model Dyn Syst. 13 3 (2007), pp. 237–250. https://doi.org/10.1080/13873950600759073.
- P. Múčka. Current approaches to quantify the longitudinal road roughness, International Journal of Pavement Engineering. (2015), pp. 1–21. https://doi.org/10.1080/10298436.2015.1011782.
- G. Cantisani and G. Loprencipe. Road roughness and whole body vibration: Evaluation tools and comfort limits, Journal of Transportation Engineering. 136 9 (2010), pp. 818–826. https://doi.org/10.1061/(ASCE)TE.1943-5436.0000143.
- D. Sekulić, V. Dedović, S. Rusov, S. Šalinić, and A. Obradović. Analysis of vibration effects on the comfort of intercity bus users by oscillatory model with ten degrees of freedom, Appl. Math. Model. 37 18–19 (2013), pp. 8629–8644. https://doi.org/10.1016/j.apm.2013.03.060.
- D. Sekulić, V. Dedović, S. Rusov, A. Obradović, and S. Šalinić. Definition and determination of the bus oscillatory comfort zones, Int J Ind Ergon. 53 (2016), pp. 328–339. https://doi.org/10.1016/j.ergon.2016.04.003.
- P. Eriksson and O. Friberg. Ride comfort optimisation of a city bus, Structural and Multidisciplinary Optimisation. 20 1 (2000), pp. 67–75. https://doi.org/10.1007/s001580050137.
- G. Georgiou, A. Badarlis, and S. Natsiavas. Modelling and ride dynamics of a flexible multibody model of an urban bus, Proceedings of the Institution of Mechanical Engineers, Part K: Journal of Multi-body Dynamics. 222 (2008), pp. 143–154. https://doi.org/10.1243/14644193JMBD130.
- D. Cantero, E.J. O’Brien, and A. González. Modelling the vehicle in vehicle-infrastructure dynamic interaction studies, Proceedings of the Institution of Mechanical Engineers, Part K: Journal of Multi-body Dynamics. 224 (2010), pp. 243–248. https://doi.org/10.1243/14644193JMBD228.
- G. Fichera, M. Scionti, and F. Garescì, Experimental correlation between the road roughness and the comfort perceived in bus cabins, SAE Tech Pap 2007-01-0325 (2007). doi:https://doi.org/10.4271/2007-01-0352.
- T. Nguyen, B. Lechner, Y.D. Wong, and J.Y. Tan, Bus ride index - a refined approach to evaluate road surface irregularities, Road Mater Pavement Des (2019). doi:https://doi.org/10.1080/14680629.2019.1625806.
- M.K. Mahala, P. Gadkari, and A. Deb, Mathematical models for designing vehicles for ride comfort. In: ICORD 09: Proceedings of the 2nd International Conference on Research into Design, Bangalore, India, 168–175, 2009.
- M. Mahala, A. Deb, and C. Chou. A comparative study of lumped parameter models for assessing the performance of vehicle suspension systems, SAE Technical Papers. 2015-April (2015). https://doi.org/10.4271/2015-01-0620.
- H.A. Hamersma, A comparison of quarter, half and full vehicle model with experimental ride comfort data. In: Proceedings of the ASME 2015 International Design Engineering Technical Conferences & Computers and Information in Engineering Conference. ASME, Boston, Massachusetts, USA, 1–7, 2017.
- G. Loprencipe and P. Zoccali. Use of generated artificial road profiles in road roughness evaluation, Journal of Modern Transportation. 25 1 (2017), pp. 24–33. https://doi.org/10.1007/s40534-017-0122-1.
- Mercedes-Benz. The Citaro - Technical data and dimensions. Accessed 5 Oct 2018. https://www.mercedes-benz.com.sg/content/singapore/mpc/mpc_singapore_website/enng/home_mpc/bus/home/new_buses/models/regular_service_busses/citaro/technical_data.html. 2018.
- L. Markus and T. Helfrich, Vorlesung grundlagen des kraftfahrzeugbaus: Federung und dämpfung, in Fakultaet fuer Maschinenwesen, M. Lienkamp, ed., Technical University of Munich, Munich, 2007.
- R.N. Jazar, Advanced Vibrations - A Modern Approach, Springer, US, New York, 2013.
- C.J. Kat and P.S. Els. Interconnected air spring model, Math Comput Model Dyn Syst. 15 4 (2009), pp. 353–370. https://doi.org/10.1080/13873950902955783.
- Firestone, Engineering Manual and Design Guide, Firestone, Nashville, Tennessee, United States, 2014.
- M.W. Sayers, Two quarter-car models for defining road roughness: IRI and HRI, Transp Res Rec (1989), pp. 165–172.
- P. Múčka. International roughness index specifications around the world, Road Materials and Pavement Design. 18 4 (2017), pp. 929–965. https://doi.org/10.1080/14680629.2016.1197144.
- The Transtec Group. ProVal 3.6: Profile Viewing and Analysis Software, The Transtec Group, Austin, Texas, 2016.
- ISO2631-11997(E), Mechanical vibration and shock - evaluation of human exposure to whole-body vibration (part 1: general requirements). International Organization for Standardization, Switzerland, 1997.
- M.H. Weik. Nyquist theorem. in Computer Science and Communications Dictionary, Springer, US, Boston, MA, 2001, pp. 1127. Available at https://doi.org/http://dx.doi.org/10.1007/1-4020-0613-6_12654
- R. Capuruço, T. Hegazy, S. Tighe, and S. Zaghloul. Full-car roughness index as summary roughness statistic, Transp Res Rec. 1905 1 (2005), pp. 148–156. https://doi.org/10.3141/1905-17.
- T. Nguyen, B. Lechner, and W. Yiik Diew. Response-based methods to measure road surface irregularity: A state-of-the-art review, European Transport Research Review. 11 1 (2019), pp. 43. https://doi.org/10.1186/s12544-019-0380-6.