
 ?Mathematical formulae have been encoded as MathML and are displayed in this HTML version using MathJax in order to improve their display. Uncheck the box to turn MathJax off. This feature requires Javascript. Click on a formula to zoom.
ABSTRACT
Computational Fluid Dynamics is used to model airflow and penetrant behaviour under cough reflex in human airway. The airway geometry segment from the oral cavity to the primary bronchi is reconstructed from CT scan images of a human subject in the standing posture. The inlet flow condition is derived from dynamic cough profiles obtained from two subjects. The mathematical model allows the laryngopharyngeal wall of the airway to remodel. A k-ω turbulence model is used to represent the transitional flow. A Lagrangian approach is used to track solid penetrants in the flow field as a function of penetrant size and density. High velocities are predicted at peak expiratory cough phase. The penetrant size significantly influences the particle residence time and drag force is largely responsible for changes in the penetrant momentum. The smaller penetrants act like tracers in the flow and can escape the airway faster than larger penetrants.
1. Introduction
Cough is an airway protective mechanism resulting from a coordinated series of respiratory, laryngeal, and pharyngeal muscle activity and serves both preventative and corrective roles in pulmonary health [1]. It is a response to the presence of unwanted penetrants such as virus-laden droplets and particulates in the lower airways. This function is performed through the generation of high-velocity explosive cough airflow that clears the aspirate and mucus from the airway. The objective of this study is to apply computational fluid dynamics model to characterize the flow and penetrant behaviour under cough in the human airway, and assess the clearance capacity of cough relative to prescribed penetrant properties
The cough aerodynamic sequence of inspiration, compression, and expulsion protects the lungs through the removal of secretions and foreign material from the upper and lower airways [Citation2]. Weak cough response, commonly observed in patients with respiratory compromise and/or laryngeal function disorders, reduces the shearing forces necessary to clear the airway [Citation3], potentially contributing to reduced respiratory health. In patient groups such as Parkinson Disease (PD), cough impairment frequently contributes to increased risk of aspiration pneumonia, potentially hastening death [Citation4]. Indeed, aspiration pneumonia has been reported to be the most frequent cause of death in PD patients, with estimated 70% of the mortality [Citation5]. Consequently, the study of cough as a process for maintaining respiratory health is of considerable importance to patient groups and is an area of increasing interest among clinicians and scientists.
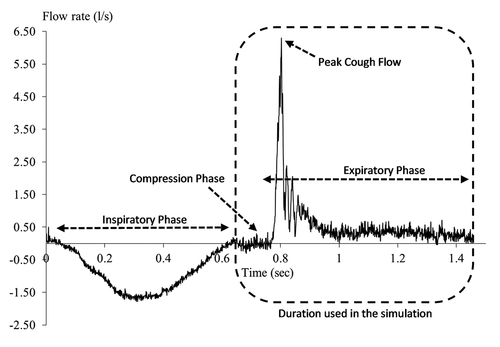
The specific features of the voluntary cough airflow waveform recorded from a human subject are shown in . During the initial (inspiratory) phase of cough, reduced alveolar pressure (relative to atmospheric pressure) results in the inhalation of air. The mean duration of the inspiratory phase varies from 0.4 to 1 sec [Citation6–8]. The compressive phase immediately follows the initial inspiratory phase. Here, after inhaling a volume of air, the glottis closes, allowing air pressure to build up within the lower airways. During a normal compression phase, airflow ceases for approximately 0.2 s [Citation9]. Although a typical cough profile comprises all three phases described above, reflexive cough events do not normally exhibit an inspiratory phase when laryngeal penetrants are present [Citation10].
Figure 1. A typical cough profile of a human subject
Previous investigations have sought to characterize respiratory aerodynamics under a range of conditions such as airway obstruction or restriction. These efforts have led to the development of computational models in order to characterize the interaction between respiratory airflow and the surrounding soft tissue surfaces of the airway [Citation11,Citation12], producing numerical simulations of these flows [Citation1,Citation13]. Some studies have focused on the role of the mucus layer in airway clearance [Citation14–18]. Most of these studies assumed rigid walls and used approximated airway geometry despite the compliant nature of the human airways [Citation18]. However, the mechanics of cough typically results in an abrupt change in the airway cross-section, in some cases by up to 1/6 of its normal size in order to increase the flow velocity within the airway [Citation8].
This study will develop a biomechanical model that simulates the spatio-temporal flow characteristics and particulate (penetrant) behaviour under cough. Specifically, the particulate trajectory will be tracked for a range of particle size and density under both strong and weak cough conditions representative of normal and sick patients, respectively. The proportion of particles retained in the respiratory system relative to the proportion ejected will be quantified for use in defining aspiration risk for a patient with the given cough function. Understanding the fundamental principles governing the interaction of cough airflows with penetrants within the airway will therefore represent a necessary step towards the development of assist technologies for at-risk patients.
The biomechanical models comprise transport equations governing airflow in the human airways. The equations are usually solved by assuming the airflow is laminar or turbulent depending on the initiating flow function. Typically, the Reynolds number, Re, in the trachea ranges from about 800 for light breathing to about 10,000 in heavy breathing [Citation19]. Therefore, turbulent flow models are widely used to characterize elevated flow conditions such as heavy breathing and sniffing [Citation20,Citation21]. In addition, the irregular shape and branching within the conducting zone of the airway may cause pressure drops, resulting in local turbulence spots [Citation22]. Ma and Lutchen developed an anatomically based airway model in which flow patterns were predicted under turbulent conditions using zero-pressure outlet conditions and oscillating flow input conditions [Citation23,Citation24]. The transient flows occurring during the cough process are usually considered turbulent [Citation12,Citation17,Citation25]. However, turbulent flow characteristics appear only during the expiratory phase of the cough where there is a rapid acceleration from the compression phase followed by a deceleration of the flow. The effect of turbulence and the transition from laminar to turbulent flow as well as relaminarization, on the airflow and particulates during cough are important phenomena that have not been fully explored. Two Reynolds-averaged Navier–Stokes RANS turbulence models have been successfully used for airway flow simulations, namely the k–ɛ, and k–ω models in which k represents turbulent kinetic energy, ɛ is the dissipation rate, and ω is the specific dissipation rate [Citation26–28].
Two fundamental approaches are widely used for analysis of particulate transport analysis namely, Euler-Lagrange method and Euler-Euler method [Citation29]. In the Euler-Lagrange method, the particle trajectory is obtained by solving equations of motion for each particle. In the Euler-Euler method, the particle concentration distribution in the fluid is calculated based on the particle volume fraction [Citation29]. The majority of previous studies on human airways have used the Euler-Lagrange approach, including Zhang and Kleinstreuer [Citation30,Citation31] who analysed targeted aerosol drug deposition in a rigid triple bifurcation tracheobronchial airway geometry. Most of these studies are based on micro and nanoparticles with a mean diameter in size range of 0.1 µm – 1 µm [Citation32]. However, the size of a typical laryngeal penetrant that can be expelled during a cough event can be on the order of millimetres [Citation33].
The focus of this paper was the development of a biomechanical model to calculate the spatio-temporal flow-particulate behaviour under a cough. The biomechanical model utilizes computational fluid dynamics (CFD) technique to predict fluid flow and particulate characteristics including pressure, wall shear stress, particulate velocities and particulate location. The Lagrangian approach was used to introduce the penetrant and track its location while being transported through the lower and upper airways. The velocity was described using a cross-sectional plane that cuts across the airway vertically. In addition, six monitored locations were defined along the airway where velocity and pressure were monitored. A particle parametric study was conducted to visualize the penetrant transport in the airway during cough.
The long-term goal of the study is to extend the findings to evaluate the airway clearance capacity in patients with impaired cough in order to assist treatment methods. In the following section we describe the materials and methods used in the study as well as the formulation of the biomechanical model comprising the governing equations and their solution. The results of the simulations are then presented and discussed in Section 3 while the primary findings are summarized in the last concluding Section 4.
2. Method
2.1 Geometry reconstruction and mesh generation
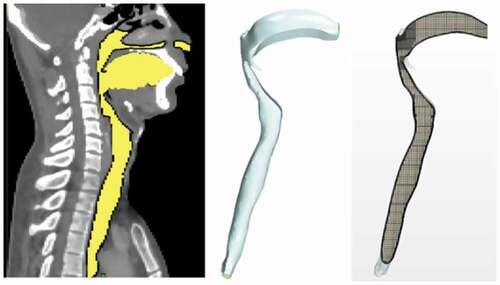
A representative geometry of the human airway was obtained from Computed Tomography (CT) scan images of a human subject in the standing posture, beginning at the oral cavity and extending to the two bronchi. The scan resolution was 512 × 512 pixels with an inter-slice thickness of 3 mm. The CT-scan images (DICOM files) were first imported into the MIMICS image processing software [Citation34]. Through colour contrast and complex surface rendering, images from the 2D cross-sections (slices) were used to reconstruct the required 3D geometry as shown in , depicting the sagittal plane. Other views would have shown the lower end of the geometry actually comprises the two bronchi (primary branches from the trachea that lead into the two lungs). The 3D geometry was then transferred in STL format to the StarCCM+ software for mesh generation and flow analysis [Citation35].
Figure 2. The reconstructed airway geometry in sagittal plane, and final geometry
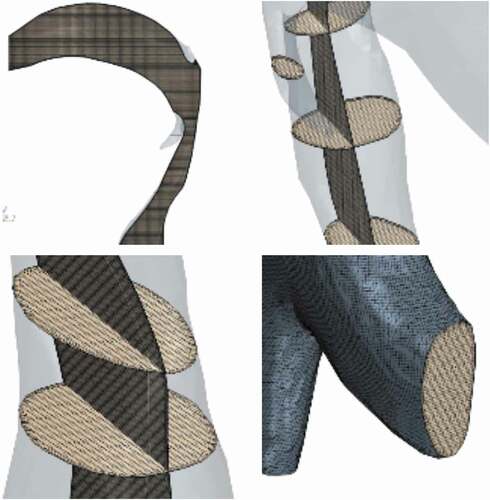
The reconstructed geometry was discretized into meshes to be used for the finite volume numerical computation of airflow distribution and penetrant tracking within the airway. shows the selected mesh used in the study. A combination of hexahedral cells in the core and prism layer cells near the wall were used to provide a high-quality robust and efficient mesh in order to adequately capture both the wall surface effects and geometrical features. Specifically, the prism layers allow the model to resolve the near-wall flow features such as any flow separation, which in turn affects integral results including the drag and pressure drop. Accurate prediction of these flow features depends on adequate resolution of the velocity gradient normal to the wall, which is steep in the viscous sublayer of a turbulent boundary layer. A mesh with 4,500,000 elements with maximum skewness angle of 43° was chosen and used for this study after grid-independence study. Details of the grid-independence study are presented in a subsequent section 4.
Figure 3. Mesh generated in the airway geometry
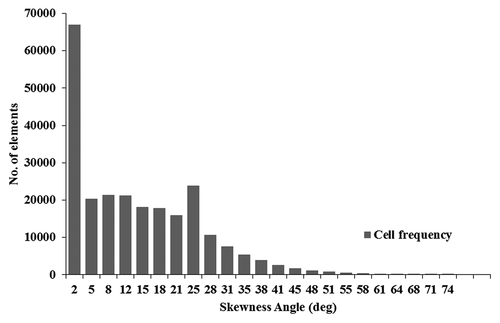
shows the skewness histogram of the mesh used. Although the above parameters may not be sufficient to fully describe the quality of the mesh, it should be noted that the effect of skewness is largely localized to the junction between the bronchi and trachea in the airway geometry considered. This effect was mitigated in the study by using a disproportionately large number of grids at that junction. In addition, a large section of the trachea where the flow and particulate dynamics are of most interest are not expected to be significantly affected by the localized mesh skewness.
Figure 4. The mesh skewness histogram of the mesh used
2.2 Flow dynamics
We assume that air is compressible and Newtonian with density , and dynamic viscosity
. The equation of state for air is therefore expressed by the ideal gas law in which the air density
is expressed as a function of temperature and pressure, thus:
where P is pressure (Pas), R is the specific gas constant (= 287 J/kg.K), and T is temperature (K). The flow in the airway during cough is typically considered transitional to turbulent [Citation1,Citation12,Citation25]. The equations governing the fluid flow are therefore taken to be the unsteady conservation of mass and momentum for turbulent flow, with allowance for possible transition by use of turbulence modelling as described subsequently. The governing equations can be expressed in tensor notation thus:
Mass conservation:
Momentum conservation:
where,,
represent time-averaged air flow velocities in x,y and z directions, subscripts i and j represent the coordinate directions x,y and z,
is dynamic viscosity,
is turbulent (eddy) viscosity and
is the Kronecker delta (which is 1 when i = j, and zero otherwise). The term
represents the momentum exchange between the dispersed phase (particulates) and carrier phase (air) and includes parts of the stress tensor not appearing directly in the diffusion and pressure gradient terms of the fluid flow equation.
The turbulent viscosity term in EquationEquation (3)(3)
(3) is evaluated for this transitional-to-turbulent flow system using the k-ω shear stress transport (SST) turbulence model [Citation36] in which k is the turbulent kinetic energy, and ω is the specific dissipation rate. Specifically,
will be evaluated from the general relation
= k/ω. The k-ω SST turbulence model has been adopted in this study because Direct Numerical Solution (DNS) or Large Eddy Simulation (LES) turbulence models are computationally intensive [Citation36]. In addition, the k-ω SST model has been successfully used for transitional flows [Citation37] as may occur during cough, and represents an adequate compromise between computational intensity and accuracy.
The k-ω SST model adopted for this study is a two-equation eddy viscosity model requiring solution of the following two transport equations for k and ω:
k -equation:
ω -equation:
where is turbulent shear stress. The value of parameter F1 in EquationEquation (5)
(5)
(5) has been established to be 1.0 near the surface and zero away from the surface [Citation35]. The value of γ is obtained from the relation [Citation34]:
The remaining parameters constitute the constants of the k-ω SST model. The values of the model constants ,
,
,
, and
have been established and validated in a previous study to be 0.09, 0.0750, 0.85,0.41, 0.5, and 0.856 respectively [Citation37].
Penetrant dynamics
The motion of the penetrant within the airflow is determined by the momentum exchange between the carrier gas and the penetrant. In general, the particle velocity is different from that of the surrounding fluid. The relative velocity between the penetrant and the fluid is used to calculate the temporal penetrant location , thus:
where p is the particle velocity, and
is flow velocity.
We assume that the momentum balance for the penetrant is governed by Newton’s second law of motion expressed by the following force-balance equation [Citation35]:
where is mass of the penetrant,
is Stokes drag force acting on the surface of the penetrant,
is lift force acting on the penetrant,
is pressure gradient force developed by undisturbed flow,
is added-mass force created by displaced fluid, and
is Buoyancy force. The left-hand side of the equation represents the inertial force acting on the penetrant due to its acceleration.
The drag force per unit particle mass is given by [Citation38]:
where ρ is penetrant density,
is penetrant diameter, and
is drag correlation. In this study, the penetrant is assumed to be a spherical particle with small diameter relative to the airway dimension. Thus the Shiller-Neumann drag correlation is used to define the particle drag coefficients thus:
Here is the particle Reynolds number. The lift force acting on the particle is given by:
where CLR and are rotational and shear coefficients respectively which are evaluated using the Sommerfeld definition [Citation39].
The rest of the terms in the EquationEquation (8)(8)
(8) are expressed as follows:
in which is the mass of the fluid displaced by the penetrant and
is gravity.
Turbulence within the cough airflow causes the penetrant to collide with the walls of the airway. These collisions produce wall-particle forces that affect the momentum of the penetrant and are modelled according to the rebound-interaction model [Citation27]. The airway wall is typically covered by a surface liquid (mucus) layer which introduces possible mucus-induced stickiness [Citation15]. The presence of mucus is represented in the present biomechanical model through a wall restitution coefficient. Specifically, the rebound velocity relative to the wall is determined by the impingement velocity and a restitution coefficient thus:
where et and
the restitution coefficients in the wall-normal and tangential directions respectively. In the present study, these restitution coefficients were set to 0.1 to allow for a small amount of stickiness at the surface of the airway [Citation40]. It should be noted that the restitution coefficient may well be patient-specific and the value chosen for this study should be considered an initial representative value to express the relatively small amount of stickiness expected under normal cough [Citation40]. This issue is further discussed in a subsequent conclusion section 4.
2.3 Design of penetrant study
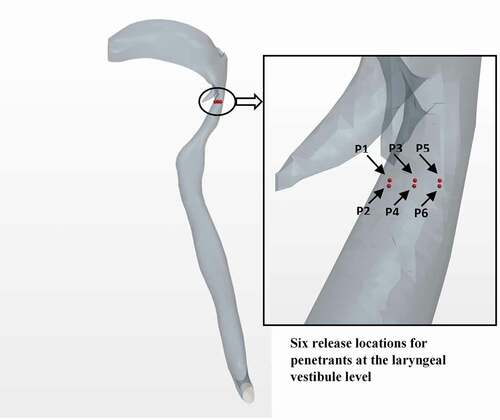
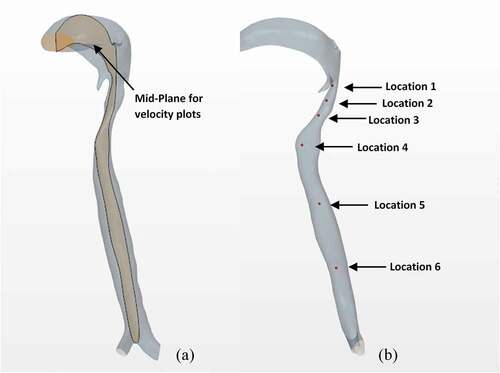
A horizontal plane in the laryngopharynx was examined of which six different landmarks were selected to represent the launching positions for penetrants entering the larynx from the oropharynx. Due to the high sensitivity in penetrant launching positions, six particles were distributed parametrically to represent possible penetrant entrance locations into the airway in the anterior-posterior and lateral directions. All six penetrants were released under similar conditions and used for the aspiration risk assessment. shows the landmarks selected for examination within the airways.
Figure 5. Locations of the penetrant ejection at the laryngeal vestibule level for the computational modelling
Six solid spherical particles were used as the penetrants, and the position, time, and velocity with which they crossed the control volume boundaries were monitored. A parametric study to investigate the effects of mass and size on penetrant trajectory was implemented by investigating two additional initial diameters of the penetrant. The penetrants were injected and tracked through the airway segment until they are either aspirated or expelled from the airway. Penetrant aspiration when it is either retained inside the airway or escaped through one of the bottom faces. Penetrant expulsion occurs when it is either pushed into the oral cavity or escaped from the mouth-end of the airway. A two-way coupling of momentum was assumed between the fluid and the penetrants as the six solid particles were in motion in the fluid during the simulation [Citation41].
2.4 Initial and boundary conditions
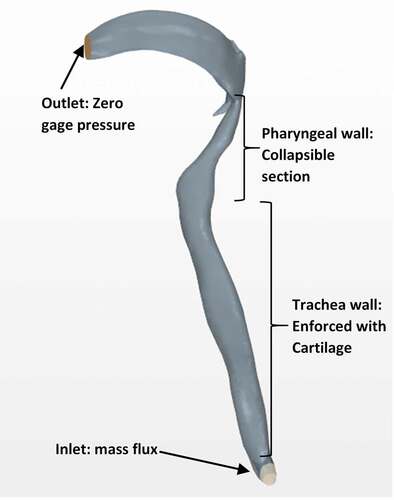
shows the boundaries defined for the computational model including details of the different regions of the airway. The boundary conditions used were transient mass flux imposed at the end of the two bronchi at the bottom, and zero gage pressure imposed at the top (outlet) end of the airway. In effect, the measured cough flowrate profile was assumed to enter the airway directly at the end of each bronchi, which when multiplied by the air density (achieved through user-defined function facility provided in the STARCM+ computational package) results in a mass flux used as the inlet boundary condition. The inlet mass flux was therefore allowed to vary with time as the cough profile. In addition, the input cough flow (and thus the mass flux) was assumed to be uniform across the inlet boundary at any instant of time. The boundary condition at the top (outlet) end of the trachea remained unchanged with time. The wall boundary condition was enabled through the wall compliance model described in a subsequent section 2.5.
Figure 6. Airway geometry with inlet and outlet boundary surfaces
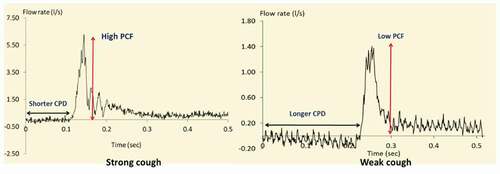
Two cough profiles acquired experimentally from human subjects were used as input conditions to simulate two distinct cough events: a weak cough and a strong cough, as shown in . These measures of cough strength were obtained through analysis of voluntary PCF sampled using an oral pneumotachograph (MLT 1000, AD Instruments, Inc.) connected to a spirometer (ML141, AD Instruments, Inc.). A nose clip was used to occlude nasal airflow during the cough manoeuvre. The airflow signal was measured and digitized at 1 KHz and displayed using Chart software for Windows. Each airflow sample was lowpass filtered at 150 Hz. The signal was be calibrated using a known 2 L volume and imported into the recording system. The patient was instructed to: (i) relax and breathe into the pneumotachograph tube (held by the researcher); (ii) Following three tidal volume breaths ‘take a deep breath and cough hard.’ The participants completed a minimum of three trials of voluntary cough into the pneumotachograph measurement system. It should be noted that the profiles shown in are voluntary cough waveforms depicting transient pressure and flow profiles associated with the coughs. Thus, the issue of sampling frequency does not apply. A weak cough represents a cough commonly observed in patients with laryngeal disorders [Citation42]. In general, weak cough events are characterized by reduced peak cough flow rate (PCF) and prolonged compression phase duration (CPD) [Citation7]. In contrast, strong cough events have high PCF and short CPD to generate rapid, forceful ballistic airflow within the airway [Citation42]. For the purpose of this study, the simulation was started from the compression phase of cough.
Figure 7. Patient-specific cough profiles acquired and used in this study
2.5 Airway wall remodelling
Cough naturally increases the flow downstream to a maximum in order to produce an effective airway clearance. This is achieved by generating high expiratory flow rates and dynamically collapsing the airway to reduce the cross-sectional area [Citation42–44]. Therefore we assumed the wall of the upper airway to be flexible. Specifically, we considered the airway wall to be a collapsible tube during the forceful expiratory phase. The effect of this collapsible tube mechanics was approximated in the model by allowing the anterior and posterior walls of the airway to remodel transiently depending on the expiratory flow-time distribution. Considering that trachea wall composed of cartilage (elastic modulus in the range of 190kPa) is significantly more rigid than the laryngopharyngeal wall composed of softer tissue, only the laryngopharyngeal wall was allowed to remodel in the present study as an approximation.
From the modelling perspective, this phenomenon changed the finite volume mesh of the initial airway, and thus required redistribution of mesh vertices in response to the movement. The dynamic mesh-morphing technique was used to generate the wall displacements [Citation45]. Specifically, as the airflow accelerated from a minimum at the end of the compression phase to peak cough flowrate at the expiratory phase, the wall of the laryngopharynx part of the airway was allowed to collapse such that the cross-sectional area reduced as a function of the expiratory flow distribution. After the peak expiratory flow, the airway was allowed to relax back to its original size. shows how the airway cross-section was allowed to change at the laryngeal level during the expiratory phase of the strong cough profile to illustrate the effect of airway wall dynamics on flow parameters. The real-time duration after cough initiation is shown in each instance. In the beginning, the airway is in its original shape with large internal volume. After the expiratory phase is reached, the airway wall in the laryngopharynx starts to deform mainly from the posterior wall. The deformation then reaches a maximum at the peak expiratory flow which is 0.15s for the case of strong cough considered in this study.
Figure 8. Airway wall deformation
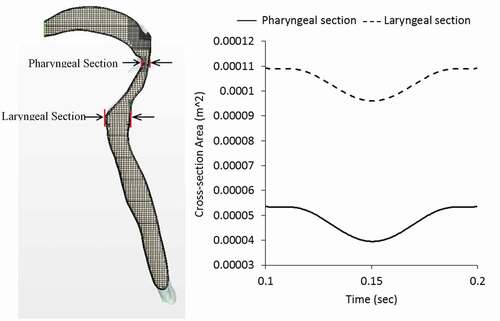
It should be noted that the expiratory flow phase used to determine the change in cross-section of the laryngopharynx comprises mainly a single sinusoidal waveform with minimal fluctuation. The duration of this expiratory flow phase is also quite limited (about 0.1s) and the effect on the averaged wall deformation is not expected to fluctuate exactly as the velocity profile. In addition, the numerical method required the use of discrete time steps for mapping the expiratory flow with the airway cross-section at the laryngopharyngeal section. Thus, the wall variation shown in does not fluctuate like the full cough waveform shown in . It should also be noted that the mesh-morphing technique used assumes the rigid trachea merges smoothly with the flexible laryngopharyngeal walls. A flow-structure interaction model would have improved on this assumption but require analysis of governing equations in both the solid and fluid domains. Finally, the inlet and outlet conditions were assumed to remain unchanged by the wall remodelling.
2.6 Computational details
A central sectional plane in the vertical direction through the airway geometry displayed in ) was selected for analysis of intra-airway flow velocities. Six locations within the airway were selected and monitored in order to assess the transient velocity and pressure magnitudes. These six locations are illustrated in ).
Figure 9. Vertical plane (a), seven monitored locations in the airway (b)
A finite volume based CFD software StarCCM+ was used for the simulation, utilizing an implicit unsteady solver with a minimum time step of 10−5 secs and second-order temporal discretization with second-order upwinding scheme. The time step was determined based on the Courant number expressed as:
where is the time step and
is the mesh size. The Courant number was kept approximately 1 to ensure numerically stable and accurate solution. The computation was performed on a workstation using Intel Core i7 processor with 32GB RAM. The average computational runtime ranged from 20 to 22 hours depending on the additional time required for particle tracking. A grid-independence test was first performed for three different grid sizes (~3,000,000, 4,500,000, and 6,000,000 cells) by monitoring changes in the values of the drag force on the penetrants. A representative result of the grid-independence study is presented for brevity in for three particles released at locations P1, P3 and P5 (as indicated in previous ). The results were considered to be essentially independent of the grid size beyond 4,500,000 cells. This mesh also represented a good compromise between accuracy and computational intensity and was therefore used for all the results presented in the following section.
Table 1. Representative grid-independence study on predicted drag force under strong cough event for penetrant density of 1000 (kg/m3) and diameter of 1 mm
3. Results and discussion
3.1 Velocity distribution
shows the colour-coded magnitude of velocity on the mid-plane of the airway at seven instances for the strong cough profiles considered. The red colour indicates the largest velocity (100 m/s) and blue reflects the smallest. shows the corresponding colour-coded magnitude of velocity on the mid-plane at seven instances for the weak cough profiles considered. shows the transient variation of velocity for strong cough at the six monitored locations previously identified in a previous ). shows the corresponding transient variation of velocity for weak cough at the six monitored locations.
Figure 10. Predicted velocity magnitude for strong cough event
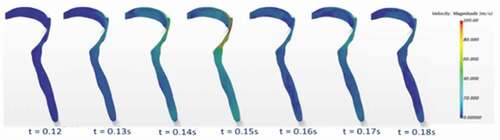
Figure 11. Predicted velocity magnitude for weak cough event
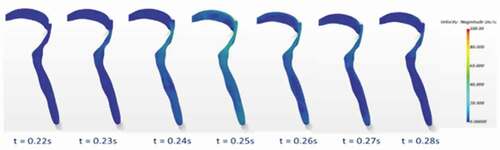
Figure 12. Predicted velocity magnitude with time at 6 monitored locations
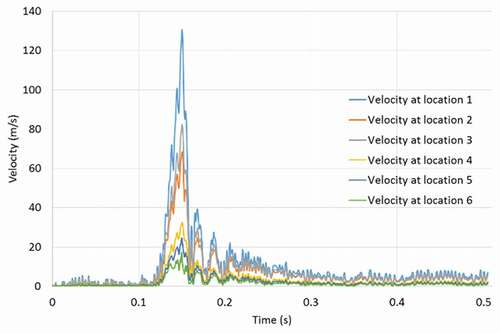
Figure 13. Predicted velocity magnitude with time at 6 monitored locations
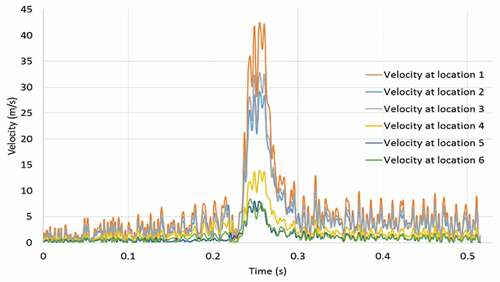
In all cases, the highest flow rates are observed during the peak expiratory flow phase. The velocities at all the six locations follow the same general pattern with the largest values at location 1 where the airway is narrowest. The predicted velocity at location 1 is 130 m/s (just after peak-expiratory flow). This value is close to 150% of the value predicted at any other location. The kinetic energy of the moving gas scales to the square of the velocity. Thus, the force exerted on the particles is significantly greater at Location 1 than the other regions.
Additional results (not shown for brevity) also indicate that the flows exhibit sudden acceleration during the expiratory phase, as high as 3971 m/s2 at the narrowest section of the airway. The temporal variation of the velocity at other locations is not as high as at location 1. Location 6 at the straight part of the airway remote from all geometrical distortions exhibits the least velocity fluctuation, reaching a maximum of 16 m/s.
3.2 Penetrant trajectory
The purpose of the study was to assess penetrant behaviour within the human airway during cough. Cough was induced as a result of penetrant released into the oropharynx and allowed to enter the larynx. The variables of interest included penetrant density and size, as summarized in .
Table 2. Input parameters used for the penetrant study
Typical behaviour of the predicted trajectory of each penetrant released under strong and weak coughs are shown in respectively. Penetrants were introduced at the same time to avoid differences in residence time. The first parametric study examined the predicted trajectory of different sizes of penetrants during cough. Three particle diameters were chosen based on the typical size of food penetrants after mastication ()[Citation46, Citation47]. The particles were assumed to be released at the beginning of the compression phase (after cough initiation). The purpose of the study was to assess the effect of the penetrant size on potential for expulsion under a particular cough. In order to quantify the effect of diameter on each penetrant trajectory, we monitored three additional parameters: (i) drag force exerted on the penetrants, (ii) penetrant velocity, and (iii) penetrant Reynolds number for each penetrant inside the tracheal airway. shows how each of these parameters changed for penetrant released at the P5 location under strong cough.
Figure 14. Predicted penetrant trajectory of six penetrants under strong cough (Penetrant diameter = 1 mm, density = 500 kg/m3)
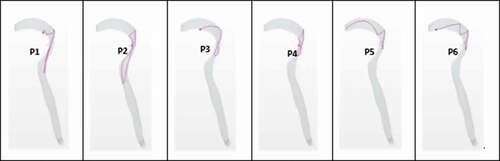
Figure 15. Predicted penetrant trajectory of six penetrants under weak cough (Penetrant diameter = 1 mm, density = 500 kg/m3)
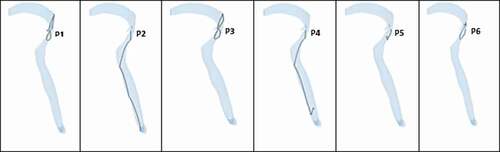
Figure 16. Monitored parameters for penetrant P5
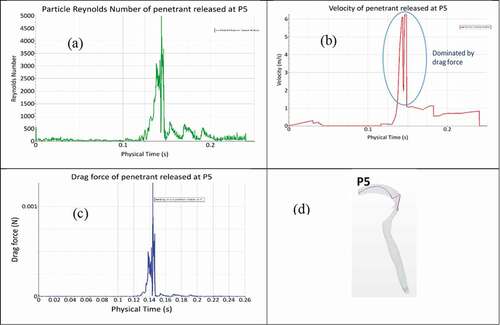
The drag force exerted on penetrant P5 is notably fluctuating between 0.12 and 0.15 sec. There is relatively no drag force exerted over the initial 0.12 sec (during the compression phase). After 0.12 sec, the penetrant is subjected to drag forces caused by the expiratory flow. A maximum drag force of 0.010056 N is predicted during the expiratory phase. The penetrant velocity profile is nearly analogous to the drag force pattern presented in ). The sudden drops and fluctuations in penetrant velocity are due to momentum loss from penetrant collisions with the walls of the airway. The predicted maximum penetrant velocity is 6.3 m/s, when maximum drag force is being exerted on the penetrant. Thus, the drag force is determined to be the primary determinant of changes in penetrant momentum. The drag force either makes the penetrant move with the flow or collide with the walls of the airway. During the compression phase, the penetrant velocity is non-zero although the drag force is nearly zero. A possible explanation for this trend is that gravity acts to increase the penetrant velocity even in the absence of airflow.
show the maximum drag force for the particles under strong and weak coughs, respectively with the density maintained constant at 1000 kg/m3 while the diameter is changed parametrically. The predicted drag forces are generally larger for strong cough () than weak cough () due to larger flow velocity in the former situation. In addition, the drag force generally increases with the particle size, with some exceptions (particle released at P6 in , and particles released at P1 and P5 in ). These deviations may be attributed to the stochastic nature of the particle trajectory, with some particles momentarily monitored at locations of relatively high velocity.
Table 3. Parametric study of penetrant size (diameter) variation under strong cough event for penetrant density of 1000 (kg/m3)
Table 4. Parametric study of penetrant size (diameter) variation under weak cough event for penetrant density of 1000 (kg/m3)
The next parametric study considered the effect of penetrant density on the trajectory and the outcome of the cough event. Three values of penetrant density were selected to match the effective density of food particles that are typically swallowed into the oesophagus. Penetrant trajectory studies were conducted by assigning the two additional density values to the penetrants under strong and weak cough events. The results of this study were also analysed using the same three individual variables used to investigate the effect of particle size – drag force, particle velocity and particle Reynolds number. The maximum drag force values are similarly presented in for strong cough and weak coughs respectively with the diameter maintained constant at 1 mm while the density was changed parametrically. Consistent with the trend observed in for size, the drag force is generally larger under strong cough than weak cough. However, there is no consistent trend on the effect of particle density under both strong cough and weak cough conditions. This lack of consistency may be attributed to the relatively small effect of particle density (within the range considered) on drag force compared to the size.
Table 5. Drag force on penetrant under strong cough event for penetrant diameter of 1 mm
Table 6. Drag force on penetrant under weak cough event for penetrant diameter of 1 mm
3.3 Penetrant behaviour outcome
summarize the penetrant trajectory outcomes evaluated for the two parametric studies under both strong and weak coughs. present results for parametric study of effect of penetrant diameter with the penetrant density maintained constant at 100 kg/m3. present results for parametric study of effect of penetrant density with the penetrant diameter maintained constant at 1 mm. The larger particles (all penetrants having 2 mm and 1.5 mm diameter) were found to be ejected from the airway under strong cough for the specific density considered, while nearly all particle sizes were either retained or aspirated under weak cough. These findings are consistent with the previous findings in which the drag force was determined to be primarily responsible for changes in the momentum of the penetrant. The drag force was noticeably smaller under weak cough than strong cough, resulting in minimal expulsion of penetrants under weak cough, and significant expulsion under strong cough.
Table 7. Penetrant trajectory outcomes for penetrant diameter variation under strong cough event for penetrant density of 1000 kg/m3.
Table 8. Penetrant trajectory outcome for penetrant diameter variation under weak cough event for penetrant density of 1000 kg/m3.
Table 9. Penetrant trajectory outcomes for penetrant density variation under strong cough event for penetrant diameter of 1 mm
Table 10. Penetrant trajectory outcomes for penetrant density variation under weak cough event for penetrant diameter of 1 mm
3.4 Assessment of modelling improvements
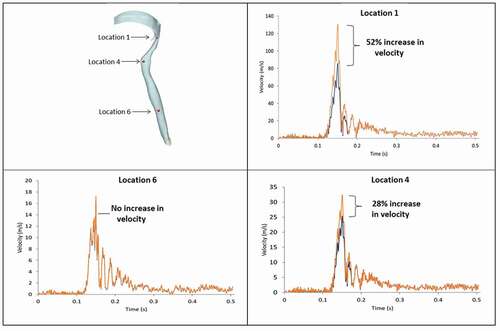
shows how the airway wall dynamics modifies the velocity distribution. Three landmarks: (laryngopharynx of the airway, entrance of trachea, and the lower trachea), were monitored for velocity magnitude with and without allowance for airway collapse under the same cough profile. By integrating the airway wall deformation into the model, we observed a significant increase in the magnitude of the velocity within the laryngopharynx region. The percentage increase near the epiglottis was 52% which certainly influences the drag force acting on the penetrants. There was no increase observed for velocity magnitude within the lower end of the trachea (Location 3) because wall remodelling had a minimal effect within the lower end of the trachea.
Figure 17. Variation of velocity magnitude at three locations within the airway for rigid and deforming walls
4. Conclusion
The airflow behaviour and penetrant transport under cough were investigated within the context of a 3D airway geometry reconstructed from CT-scan images of the human airways and imported into CFD simulation software. The flow governing equations and the particle transport equations were solved with the finite volume numerical method to calculate the transient cough flow distribution, and penetrant dynamics. Cough waveforms are composed of several distinct stages: inspiratory phase, compression phase, and expiratory phase. The expiratory phase is the strongest phase of cough and results in very high observed airway velocities and pressures. At peak-expiratory flow, the velocity was predicted to be 130 m/s for the specific cases and conditions considered. The narrowest part of the airway had the highest velocities throughout the cough event.
A parametric study on the penetrant trajectory was conducted in order to investigate the effect of the penetrant size and density on penetrant behaviour in the airway. It was found that the penetrant size significantly influenced the particle residence time and drag force. The smaller penetrants acted like tracers that largely followed the flow. The drag force appeared to be largely responsible for changes in the momentum of the penetrant. The drag force was generally larger under strong cough than weak cough condition, irrespective of the change in size or density of the particle, within the ranges of parameters considered in the study.
The aspiration capacity of each cough event was investigated. The larger particles were found to be ejected from the airway under strong cough, while nearly all particle sizes were either retained or aspirated under weak cough. These findings were consistent with the predicted larger drag forces under strong cough than weak cough, resulting in minimal expulsion of penetrants under weak cough, and significant expulsion under strong cough.
The biomechanical model presented also approximated the remodelling of the airway wall during the cough process using the mesh morphing technique. The results suggested that the remodelling may be an important issue within the airway on which this study is focused. Allowance for wall deformation significantly increased the magnitude of the velocity within the laryngopharynx region, with a percentage increase of 52% near the epiglottis, which certainly influenced the drag force acting on the penetrants. There was no observed increase in velocity magnitude in the lower end of the trachea due to the minimal effect of wall remodelling there.
The approximate method utilized for wall remodelling did not allow for incorporation of the elastic property of the solid domain. Future integration of fluid-structure interaction method that allows for two-way coupling of the flow and structure as well as separate properties of the fluid and solid domains into the model is desirable. Such a model would enable a more accurate examination of the impact of airway remodelling on the flow-particulate behaviour. However, such studies would require reliable constitutive models to define the elastic properties of the soft tissues and cartilage of the airway wall.
Our study also had additional limitations. The level at which the penetrant was released was fixed in the present model as the penetrants were introduced at random locations within the oro-pharynx. In the future, the study could be extended to include multiple injection levels of more physiological relevance. Further studies will also benefit from systematic sensitivity analysis of some of the parameters adopted in the present model especially the restitution coefficients.
Airway modelling may be beneficial to the study of aspiration in patients with impaired cough function including those with upper airway and neurological diseases. It could also be used to enhance understanding of cough flow dynamics within the airway when formulating strategies for treatment of respiratory disease.
Disclosure statement
No potential conflict of interest was reported by the authors.
References
- M. Malvè, et al., FSI analysis of the coughing mechanism in a human trachea, Ann. Biomed. Eng. 38 (4) (2010), pp. 1556–1565. doi:https://doi.org/10.1007/s10439-010-9951-3.
- J. Widdicombe, et al., Voluntary and reflex cough and the expiration reflex; implications for aspiration after stroke, Pulm Pharmacol Ther 24 (3) (2011), pp. 312–317. doi:https://doi.org/10.1016/j.pupt.2011.01.015.
- L.J. Boitano, Management of airway clearance in neuromuscular disease, Respir Care 51 (2006), pp. 913–924.
- N.P. Nguyen, et al., Effectiveness of the cough reflex in patients with aspiration following radiation for head and neck cancer, Lung 185 (5) (2007), pp. 243–248. doi:https://doi.org/10.1007/s00408-007-9016-z.
- P.V. Pepper and M.K. Goldstein, Postoperative complications in Parkinson’s disease, J. Am. Geriatr. Soc. 47 (8) (1999), pp. 967–972. doi:https://doi.org/10.1111/j.1532-5415.1999.tb01292.x.
- T. Lawson, Assessment of the mechanical effeciency of coughing in healthy young adults, Clin Sci 33 (1967), pp. 209–224.
- T. Pitts, et al., Impact of expiratory muscle strength training on voluntary cough and swallow function in Parkinson disease, Chest 135 (5) (2009), pp. 1301–1308. doi:https://doi.org/10.1378/chest.08-1389.
- B. Ross, R. Gramiak, and H. Rahn, Physical dynamics of the cough mechanism, J. Appl. Physiol. 8 (3) (1955), pp. 264–268. doi:https://doi.org/10.1152/jappl.1955.8.3.264.
- G. Sant’Ambrogio, et al., Activation of intrinsic laryngeal muscles during cough, Am. J. Respir. Crit. Care Med. 155 (2) (1997), pp. 637–641. doi:https://doi.org/10.1164/ajrccm.155.2.9032206.
- B. Martin-Harris, Coordination of respiration and swallowing. GI Motility online, 2006.
- G.A. Fontana, Motor mechanisms and the mechanics of cough, Cough: Causes, Mechanisms and Therapy (2003), pp. 193–205.
- R.J. Knudson, J. Mead, and D.E. Knudson, Contribution of airway collapse to supramaximal expiratory flows, J. Appl. Physiol. 36 (6) (1974), pp. 653–667. doi:https://doi.org/10.1152/jappl.1974.36.6.653.
- B.T. Woodson, Expiratory pharyngeal airway obstruction during sleep: A multiple element model, The Laryngoscope 113 (9) (2003), pp. 1450–1459. doi:https://doi.org/10.1097/00005537-200309000-00004.
- L.T. Holbrook and P.W. Longest, Validating CFD predictions of highly localized aerosol deposition in airway models: In vitro dataand effects of surface properties, J Aerosol Sci 59 (2013), pp. 6–21. doi:https://doi.org/10.1016/j.jaerosci.2013.01.008.
- C. Paz, E. Suárez, and J. Vence, CFD transient simulation of the cough clearance process using an Eulerian wall film model, Comput Method Biomec 20 (2) (2017), pp. 142–152. doi:https://doi.org/10.1080/10255842.2016.1206532.
- S. Ren et al. Ansys-matlab co-simulation of mucus flow distribution and clearance effectiveness of a new simulated cough device. Int J Numer Meth Bio. e2978(2018), https://doi.org/10.1002/cnm.2978
- S. Ren, W. Li, L. Wang. et al. Numerical Analysis of Airway Mucus Clearance Effectiveness Using Assisted Coughing Techniques, Sci Rep. 10.2030 (2020), https://doi.org/10.1038/s41598-020-58922-7
- B. Hoffman Ruddy, D. Nadun Kuruppumullage, G. Carnaby, M. Crary, J. Lehman, and O. Ilegbusi, Computational modelling of cough function and airway penetrant behavior in patients with disorders of laryngeal function, Laryngoscope Investigative Otolaryngology 2 (1) (2017), pp. 23–29. doi:https://doi.org/10.1002/lio2.44.
- X. Luo, et al., LES modelling of flow in a simple airway model, Med Eng Phys 26 (5) (2004), pp. 403–413. doi:https://doi.org/10.1016/j.medengphy.2004.02.008.
- C. Xu, et al., Computational fluid dynamics modeling of the upper airway of children with obstructive sleep apnea syndrome in steady flow, J. Biomech. 39 (11) (2006), pp. 2043–2054. doi:https://doi.org/10.1016/j.jbiomech.2005.06.021.
- S.-J. Sung, et al., Customized three-dimensional computational fluid dynamics simulation of the upper airway of obstructive sleep apnea, Angle Orthod. 76 (5) (2006), pp. 791–799. doi:https://doi.org/10.1043/0003-3219(2006)076[0791:CTCFDS]2.0.CO;2.
- H. Luo and Y. Liu, Modeling the bifurcating flow in a CT-scanned human lung airway, J. Biomech. 41 (12) (2008), pp. 2681–2688. doi:https://doi.org/10.1016/j.jbiomech.2008.06.018.
- B. Ma and K.R. Lutchen, An anatomically based hybrid computational model of the human lung and its application to low frequency oscillatory mechanics, Ann. Biomed. Eng. 34 (11) (2006), pp. 1691–1704. doi:https://doi.org/10.1007/s10439-006-9184-7.
- Z. Li, C. Kleinstreuer, and Z. Zhang, Simulation of airflow fields and microparticle deposition in realistic human lung airway models. Part I: Airflow patterns, EurJl Mechanics-B/Fluids 26 (5) (2007), pp. 632–649. doi:https://doi.org/10.1016/j.euromechflu.2007.02.003.
- K. Zhao, et al., Numerical modeling of turbulent and laminar airflow and odorant transport during sniffing in the human and rat nose, Chem. Senses 31 (2) (2005), pp. 107–118. doi:https://doi.org/10.1093/chemse/bjj008.
- S. Taherian, H. Rahai, and T. Waddington. CFD modeling and analysis of pulmonary airways/particles transport and deposition. in 41st AIAA Fluid Dynamics Conference and Exhibit. 2011.
- C. Kleinstreuer and Z. Zhang, Laminar-to-turbulent fluid-particle flows in a human airway model, Intl Jl Multiphase Flow 29 (2) (2003), pp. 271–289. doi:https://doi.org/10.1016/S0301-9322(02)00131-3.
- G. Mylavarapu, et al., Validation of computational fluid dynamics methodology used for human upper airway flow simulations, J. Biomech. 42 (10) (2009), pp. 1553–1559. doi:https://doi.org/10.1016/j.jbiomech.2009.03.035.
- K.-W. Stapleton, et al., On the suitability of k–ε turbulence modeling for aerosol deposition in the mouth and throat: A comparison with experiment, J Aerosol Sci 31 (6) (2000), pp. 739–749. doi:https://doi.org/10.1016/S0021-8502(99)00547-9.
- C.-L. Lin, et al., Characteristics of the turbulent laryngeal jet and its effect on airflow in the human intra-thoracic airways, Respir Physiol Neurobiol 157 (2–3) (2007), pp. 295–309. doi:https://doi.org/10.1016/j.resp.2007.02.006.
- S.B. Pope, Turbulent Flows, IOP Publishing, Bristol, 2001.
- Z. Zhang, et al., Comparison of micro-and nano-size particle depositions in a human upper airway model, J Aerosol Sci 36 (2) (2005), pp. 211–233. doi:https://doi.org/10.1016/j.jaerosci.2004.08.006.
- M.S. Troche, et al., Respiratory-swallowing coordination and swallowing safety in patients with Parkinson’s disease, Dysphagia 26 (3) (2011), pp. 218–224. doi:https://doi.org/10.1007/s00455-010-9289-x.
- Materialise, Mimics 14.01. 2010: Belgium.
- Star CCM+, Siemens PLM., 2015.
- M. Mihaescu, et al., Large eddy simulation of the pharyngeal airflow associated with obstructive sleep apnea syndrome at pre and post-surgical treatment, J. Biomech. 44 (12) (2011), pp. 2221–2228. doi:https://doi.org/10.1016/j.jbiomech.2011.06.006.
- D.A. Wilcox, Simulation of transition with a two-equation turbulence model, Aiaa J. 32 (2) (1994), pp. 247–255. doi:https://doi.org/10.2514/3.59994.
- C. Kleinstreuer, Biofluid Dynamics: Principles and Selected Applications, CRC Press, 2006.
- M. Sommerfeld, Theoretical and experimental modelling of particulate flows, Lecture Series 6 (2000), pp. 3–7.
- S.K. Lai, -Y.-Y. Wang, and J. Hanes, Mucus-penetrating nanoparticles for drug and gene delivery to mucosal tissues, Adv. Drug Deliv. Rev. 61 (2) (2009), pp. 158–171. doi:https://doi.org/10.1016/j.addr.2008.11.002.
- C.T. Crowe et al. Multiphase Flows with Droplets and Particles, CRC press, New York, 2011
- W.D. Bennett and K.L. Zeman, Effect of enhanced supramaximal flows on cough clearance, J. Appl. Physiol. 77 (4) (1994), pp. 1577–1583. doi:https://doi.org/10.1152/jappl.1994.77.4.1577.
- R.S. Irwin, et al., Managing cough as a defense mechanism and as a symptom: A consensus panel report of the American College of Chest Physicians, CHEST Journal 114 (2_Supplement) (1998), pp. 133S–181S.
- D.E. Leith, et al., Cough. Comprehensive Physiology, 1986. Star-CCM+. (2017).
- Star-CCM+. 2017; Star-CCM+]. Available at https://mdx.plm.automation.siemens.com/star-ccm-plus
- P. Laine and H.S. Siirilä, Oral and manual stereognosis and two-point tactile discrimination of the tongue, Acta Odontol. Scand. Suppl. 29 (2) (1971), pp. 197–204. doi:https://doi.org/10.3109/00016357109026515.
- M.-F. Hoebler, A. D, C. Karinthi, J.-L. Belleville, and C. Barry, Particle size of solid food after human mastication and in vitro simulation of oral breakdown, Int J Food Sci Nutr 51 (5) (2000), pp. 353–366. doi:https://doi.org/10.1080/096374800426948.