
 ?Mathematical formulae have been encoded as MathML and are displayed in this HTML version using MathJax in order to improve their display. Uncheck the box to turn MathJax off. This feature requires Javascript. Click on a formula to zoom.
ABSTRACT
A major challenge in computational fluid dynamics (CFD) modelling of the human respiratory system is allowing for the variation of geometric scale. A methodology is proposed that enables CFD analysis from the middle through the distal airways to the alveolar level. The methodology relies on a hybrid lung geometry integrating a primary tracheobronchial tree (TBT) up to the fifth generation (section 1) and distal airway (section 2). Section 1 comprises of the middle airways reconstructed from patient CT scans. Section 2 comprises of the distal airway branching tree generated based on deterministic algorithm. The hybrid model allows the application of physiologically relevant boundary conditions in lieu of simplistic approximations used in previous studies. Two different breathing conditions are considered adapted from previous studies, representing resting and exercise activity. The predicted flow variables are assessed for numerical accuracy and validated by comparison with published experimental and numerical data.
1. Introduction
The human airway is a branching structure that forms the pathway necessary for gas exchange between the body and the environment during respiration. Computational fluid dynamics (CFD) analysis for flow in the human airways requires the flow path of the airway in the respiratory tract constructed and discretized. This process poses a major challenge for CFD analysis as the human airway geometry varies widely in scale from the trachea to the terminal bronchioles. Inter-subject variability of airway structure, particularly curvature of the upper and middle airways, affects flow significantly [Citation1,Citation2]. These factors in addition to limitation of current imaging technology and computation intensity of resolving the entire airway structure have limited analysis of flow in the distal airways. The distal airways are defined as the non-cartilaginous airways characterized by internal diameter of less than 2 mm. The objective of this study is to develop a computationally cost-effective model embracing the entire airway tree from the trachea to the terminal bronchioles, for the analysis of airflow in human distal airways.
Analysis of flow field in the distal region of the lung is required to better understand the flow mechanics in the small-scale airways where most pathologies are pervasive. Aikawa et al. [Citation3] studied autopsied lung from patients who died of bronchial asthma and found significantly higher amounts of airway mucous and goblet cell compared to control group. This higher amount of mucous and cell deposition translates to a reduction of flow diameter in the entire respiratory tract and the relative impact on flow is considerably higher in the distal airways due to their smaller dimensions. Different functional tests have been proposed to assess flow in distal airways for early detection and monitoring of Chronic Obstructive Pulmonary Disease (COPD) [Citation4,Citation5].
The early morphometric lung airway models include the Weibel lung model based on measurements on resin cast of actual human lung [Citation6] and asymmetric Horsfield model [Citation7]. Several studies have analysed airflow in these lung models either numerically or experimentally [Citation8–12]. Although morphometric lung models are useful for representing the geometry in the distal lung region, several approximations are required to utilize them for CFD analysis. Each parent branch is assumed to generate two symmetric daughter branches of equal diameter in symmetric lung models. Velocity boundary condition is often imposed utilizing this approximation, which does not accurately represent distal flow condition in real airways. Specifically, real distal flow condition depends on the location of the distal generation as well as the upstream flow condition. Application of uniform pressure outlet condition is another choice often used for truncated models [Citation9,Citation13]. Although this approximation is useful to quantify pressure drop in the region of interest, it does not account for asymmetric obstruction downstream if present. Furthermore, morphometric and anatomical models do not take subject-specific geometric features and pathological conditions of the first few generations into consideration, which often affect flow significantly [Citation2,Citation14].
The advancement of medical imaging technology has made it feasible for image-derived lung geometries to be used for patient-specific modelling. CT image-derived lung model has demonstrated complex flow patterns compared to idealized Weibel model in a previous study [Citation14]. This study has also shown that ideal airway model is insufficient to accurately predict deposition patterns in the actual airways. Qi et al. [Citation15] and Islam et al. [Citation16] studied flow in patients with left pulmonary artery sling and reported increased pressure drop in image-derived model compared to healthy condition. Ilegbusi et al. [Citation17] used a lung model derived from four-dimensional CT (4DCT) to predict and validate local deformation of lung tissue and tumour motion. Gemci et al. [Citation18] analysed steady flow in a 17-generation anatomical model although simulation on fully converged mesh was not possible due to the large domain of the model. Image-based geometries are often limited to few generations beyond the trachea due to the small scale of the distal airways and tissue structure [Citation19,Citation20]. Different approached have thus been proposed to incorporate distal airways. Walters et al. [Citation21] simulated flow from the oronasal opening to terminal bronchioles by utilizing stochastically coupled boundary conditions at the truncated branch. Velocity boundary condition was imposed at the terminal and truncated boundaries based on flow fraction obtained from preliminary steady-state solution in which truncated boundaries were set to have the same pressure distribution as a randomly selected interior face zone within the same generation. This method can resolve pressure and velocity distribution in the truncated model of healthy lung but spatial distribution of flow in the distal parts cannot be analysed due to truncation. A 1D network model has been proposed by Choi et al [Citation22] where 1D energy balance equation is solved in an iterative manner for an airway structure generation based on stochastic population data by volume-filling method [Citation23]. The effect of middle airways cannot be incorporated in 1D computations where there is significant secondary flow, and 3D analysis with this method in distal airways is not possible due to the reduced dimensionality.
In this study, we propose a hybrid lung model that combines CT-derived patient-specific geometry with a tree model based on a deterministic algorithm. The hybrid model is necessitated by the fact that realistic and cost-effective reconstruction of lung geometry through the complete trachea-bronchial tree is not possible with current state of the art. The hybrid approach enables generation of the airway tree structure from the trachea to the terminal bronchiole level that retains subject-specific geometric features up to CT resolved airway and CFD compliant geometry for distal airways. Physiological pressure-driven flow is simulated by application of patient-specific boundary condition. The methodology can thus be readily adapted to any patient-specific pathological condition and allows detailed CFD analysis for flow distribution in the distal airways.
Results are presented on velocity field, pressure field and mass flow distribution for the middle and distal airways separately. The prediction is first assessed for numerical accuracy and then verified by comparing the mesh-independent results for the middle airways with previously published experimental and numerical data. The predicted results from the middle airways are used as input for computation of flow in distal airways. Both the axial and secondary flows are analysed in the distal generations in order to evaluate the effects of geometry and orientation of airways on flow field pressure field and mass flow distribution.
In the following Section 2, we describe the methodology including the reconstruction of middle airway from patient-specific CT datasets, and the deterministic morphometric model for constructing the distal airways. The integration of both into the hybrid model is described, including the surface modelling steps to create continuous flow path between the CT-derived and morphometric airway. The section also includes the mathematical formulation, boundary conditions and the detailed computational procedure used for the simulation. Section 3 presents the results, followed by the Discussion in Section 4. The conclusion in Section 5 summarizes the major findings of the study and the physiological implication of the results.
2. Methods
Computational modelling of human respiratory flow often relies on lung geometry reconstructed from CT-scan datasets. Such geometries are restricted to a few generations in the upper airway due to the limitation in image contrast and resolution. In order to adequately resolve the flow and effect of pathology in the distal airway, we developed a hybrid lung model that augments the CT-resolved airway with a morphometric lung model based on deterministic algorithm. This approach enables the creation of an integrated lung model that extends seamlessly from the trachea to the terminal bronchioles. This hybrid lung model thus retains the patient-specific characteristics of the CT-resolved airways while providing a detailed bronchial tree representation in the distal region. However, the analysis of the integrated lung model is computationally intensive due to the large number of control volumes required to discretize the entire airway tree. This motivated our implementation of CFD analysis in this study in stages in which we only resolve flow in the lobe of interest while modelling a physiologically accurate pressure-driven flow overall.
2.1. Reconstruction of primary airway geometry
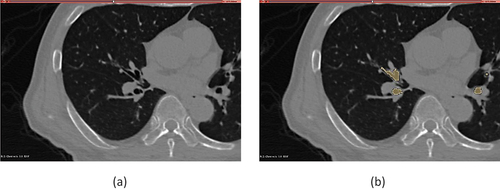
The patient-specific geometry of the primary airway comprising the trachea to the secondary bronchi up to sixth generation was reconstructed from CT scan datasets that were acquired in patients undergoing radiotherapy at UCLA Radiation Oncology during a single breath hold. The images were recorded and stored in 512 by 512-pixel resolution DICOM images series. The associated patient data were anonymized and then collected as secondary research data. The images were used as input in the open-source platform 3D Slicer (http://www.slicer.org) [Citation24] for the purpose of segmentation where the airway lumen was labelled as a separate region. Segmentation was accomplished by a combination of semi-automatic algorithm and manual segmentation. We utilized the seed region growing algorithm to segment the airway from the trachea up to the secondary bronchi. The subsequent branches were segmented manually such that the airway lumen was identified in each slice and label map was created to connect the region to previously segmented region. shows a slice in the 3DSlicer user interface and shows a segmented tertiary bronchus. This approach enables reconstruction of patient-specific airway that represents unique geometric features at the time of diagnosis. The segmented region was then exported as stereolithographic (STL) geometry file containing information on the surface of the segmented volume in terms of triangle node coordinates and facet normal information. The final CT-derived geometry includes upto the sixth generation.
Figure 1. CT image as shown in the 3DSlicer interface (a), and segmented bronchi on the same slice as yellow label map (b).
2.2. Deterministic model for distal airways
The airway tree structure in the distal airways was generated using the 3D lung model developed by Kitaoka et al. [Citation25], hereafter referred to as Kitaoka model. The Kitaoka model uses a branching algorithm based on several morphometric studies that follow two important principles. The first principle states that the amount of air flowing through a particular generation is proportional to the volume of the supplied region. This allows the algorithm to utilize volume ratios to calculate the branch diameter and branch angle using optimization relations. The second principle states that end generations are distributed homogenously inside the supplied region and thus the alveolar region receives similar airflow per unit volume. Applying mass conservation in a branching structure, Murrays’ law for minimum work leads to the following relationship between the diameters of daughter branches and the parent branch:
where is the diameter of the parent branch and
and
are diameters of two daughter branches, r is flow dividing ratio and n is an exponential term. The value of r is determined by dividing the volume supplied by the smaller daughter region by the volume supplied by the parent at each generation using the algorithm. Another optimization relation is utilized to relate branching angles of the daughters to the flow ratio thus,
The value of n was set equal to 2.8 and the length of daughter branch was set to three times its calculated diameter based on observed morphometric characteristics of the human airway. The final length is modified based on the distance from the outer boundary of supplied volume. Nine basic rules and some complementary rules are defined for the algorithm based on these relations in order to generate the morphometric model of airway tree [Citation25]. We developed the Kitaoka tree for the region of interest using open-source Lung4cer [Citation26] and STL surface mesh was generated for the CFD analysis.
2.3. Reconstruction of hybrid lung model
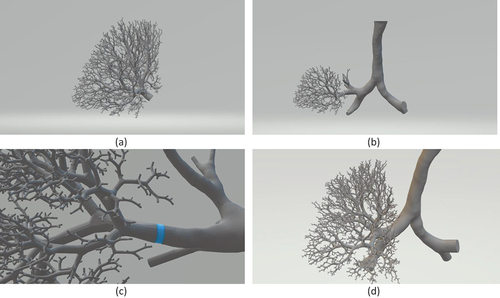
Both the STL files of the CT resolved airway and the Kitaoka model are exported into the open-source software Autodesk® Meshmixer to construct the hybrid geometry. With both models in 3D space, we identify the section of airway tree in the Kitaoka model that corresponds to the truncated CT resolved model. The tree structure from the Kitaoka model is then separated from the Kitaoka tree and combined with the truncated CT resolved tree. The resulting hole in the Kitaoka tree is patched with a plane surface. Next, the patch plane of the Kitaoka model is placed on top of the patch plane of the CT resolved airway. Finally, a Boolean union operation is performed where the common patch plane is decimated, and the lumen walls are combined to create a continuous surface. The exported geometry for the left upper lobe is shown in . The integration process is shown in with a zoomed view of the augmentation location in . This process is repeated for other truncated branches. Due to the different orientations of CT resolved truncated airways relative to the Kitaoka model, it was observed that some terminal branches originating from different parent branches were intersecting each other. As a result, a branch pruning step was required after all truncated branches were augmented with the Kitaoka branch. The alveolar diameter was utilized as the guiding parameter and assumed to vary from 0.2 to 0.5 mm [Citation27]. We set a threshold of 0.5 mm for the minimum distance between any terminal branch, and branches below this threshold were pruned selectively. The final hybrid lung model combining the CT resolved middle airway with the distal airway is shown in . It should be noted that our model considers all the secondary bronchi derived from patient CT data and only shows a subset of the full model to aid visualization.
Figure 2. Kitaoka lung model generated for tracheobronchial tree in the left upper lobe (LUL) (a), Combining Kitaoka tree with CT resolved geometry (b), Location of Boolean Union highlighted in blue (c) and Hybrid lung model used in CFD analysis (d).
2.4. Governing equation
The fluid flow is governed by the continuity and Navier Stokes equations that express, respectively, mass and momentum conservations of the control volume, thus
Air was assumed as an ideal gas with constant viscosity at fixed temperature. The airflow was considered laminar and incompressible based on the Reynolds number and Mach number for the flow conditions and geometry considered in this study. For example, the Reynolds number was 2000 and the Mach number was 0.005 for the higher flowrate (30 L/min) considered. Although some studies have indicated that the flow coming out of the larynx is turbulent [Citation28,Citation29], others including Zhang et al [Citation30] have shown that the turbulence dissipates quickly in the bifurcating structure and has negligible intensity after the third generation. Since the focus of this study flows in the distal airways, we have assumed laminar flow condition in the analysis as formulated in the above governing equations.
2.5. Boundary conditions
The above governing equations are solved subject to appropriate boundary conditions. A no-slip, stationary wall boundary condition is applied at the airway walls throughout the hybrid model. Thus, we have assumed that the effect of wall motion on airflow is negligible especially in the distal airway region of interest in this study. The neglect of flow-structure interaction is justified by the relatively low velocity anticipated in the distal region where lung motion is dictated primarily by the motions of the diaphragm and ribcage.
The imposed boundary conditions at the inlets and outlets affect the outcome of CFD analysis of airflow through the tracheo-bronchial tree. Backer et al [Citation31] used CT image-based boundary condition in which the pressure at the outlets was imposed such that airflow into the left and right lungs are proportional to the changes in lung volume. Patient-specific boundary conditions were found to exhibit better agreement with the experimental data than the conventional application of uniform and equal pressure at truncated outlets. Backer et al [Citation32] later extended the study to employ lobar-specific boundary condition and validated the result with measurements obtained from SPECT-CT.
Application of image-derived boundary condition allows the CFD analysis to be performed in stages and reduces computational cost. The fluid domain in this study is divided into two sections with the CT resolved airway up to the lobar entrance constituting the first section and the rest of the airway up to the terminal bronchioles constituting the second section. A pressure boundary condition at the outlets of the first segment is applied iteratively to induce the required total flow rate at the trachea. Since CT data used in this study are derived from a secondary research data, the fractional lobar volume change is obtained from the mean value reported by Yamada et al. [Citation33] for 100 subjects in the supine position. The pressure at the outlets is adjusted so that the flow fractions are satisfied within ± 1% of the fractional volume change as summarized in . The velocity field at the desired outlet, that is the right upper lobe in this case, is mapped at the inlet plane of the second section and acts as the velocity inlet boundary condition for the latter section. A uniform or zero-gauge pressure is imposed at all outlets in the second section since the hybrid geometry ends in the terminal bronchioles. Flow rates of 15 L/min and 30 L/min adopted from the previous work of Yamada et al. [Citation33] are considered to represent breathing conditions at rest and exercise activity, respectively. Steady-state solution is assumed to be achieved when the difference between the mean mass flow of successive sample set of 250 iterations falls below a tolerance level given by the following relation at monitored outlets in addition to tolerances set on residuals for the first section.
Table 1. Calculation of fractional lobar volume change using results reported by Yamada et al. [Citation33].
2.6. Computational details
The commercial solver CONVERGE [Citation34] was used to solve the system of governing equations subject to the above boundary conditions. It should be noted that the time derivative term was treated as a pseudo-step in numerical solution of the discrete equation. Pressure-based PISO algorithm was employed as Navier-Stokes solver scheme with second-order central differencing for convective flux. The CONVERGE solver package generates an orthogonal grid on runtime based on grid control parameters. The boundary layer near the wall of the airways was resolved with local refinement of grid size along the entire wall surface. The final grid size was determined by grid-independent study where further refinement showed negligible change in flow parameters. The results of the test are presented in a subsequent Section 3.1.
3. Results
3.1. Numerical accuracy test
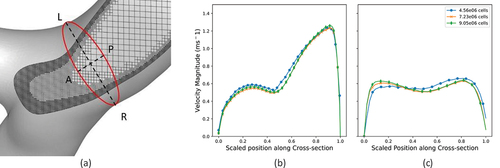
A grid-independent study was first performed on three sets of grid structures (meshes) comprising 4.56 × 10⁶, 7.23 × 10⁶ and 9.05 × 10⁶ control volumes in the first section of the hybrid model in order to assess numerical accuracy of our predicted results. shows a cut-out view of a typical mesh illustrating the refinement of grids near the walls. The magnitude of velocity was monitored at a single cross-section at the right main bronchus just before the second bifurcation along two lateral directions (Left-Right (LR) and Anterior-Posterior (AP)). The predicted profiles of velocity magnitudes utilizing the three grid structures are presented in for the LR profile and for the AP profile at the flowrate of 15 L/min. show that the results do not exhibit any significant change in magnitude beyond the mesh with 7.23 × 10⁶ control volumes. This grid was therefore considered numerically accurate and used for all the results to be presented in the remainder of this section.
Figure 3. Cut-out view of airway showing discretization with mesh refinement near walls (a), and Results from mesh independence study: LR profile (b) and AP profile (c).
3.2. Validation of predicted results
Validation of flow simulation in subject-specific models of lungs requires experimental measurements on the same geometry under similar flow conditions. The data for such validation exercises are rarely available for patient-specific geometry reconstructed from human CT-data as in the present study. Therefore, we have validated our predicted results by comparing with the experimental data of Rochefort et al. [Citation35] obtained by mapping the velocity field in a realistic geometry created by rapid prototyping from CT scan of a healthy airway. shows two velocity profiles at a single cross-section along two orthogonal lateral directions (Left-Right (LR) and Anterior-Posterior (AP)), compared with corresponding profiles obtained from velocimetry at the right main bronchus just before the second bifurcation. corresponds to the LR profile taken from left to right of the cross-section and corresponds to the AP profile taken from anterior to posterior sides of the cross-section similar to the experimental data. The scaled magnitude of the LR profiles exhibits a right-skewed asymmetric velocity profile. The AP profile also exhibits two near-wall peaks on both sides as the experimental profile. The discrepancy in the magnitudes between the prediction and experimental data is attributed to the difference in the subject-specific geometry and choice of location of cross-section between the two sets of data.
Figure 4. Comparison of Simulation Result with Experimental Data Showing LR profile (a), AP profile (b), Previous Numerical Data (c).
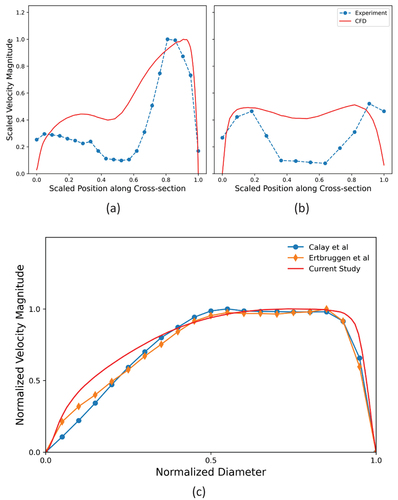
In a second set of validation studies, we also compared our predictions with two previously published numerical results on morphometric asymmetric lung model by Calay et al. [Citation12] and Ertbruggen et al. [Citation36] at a cross-section located one diameter downstream of the firstbifurcation in the right main bronchus. The results are presented in . While the model studied by Calay et al. had bifurcations in a single plane, the model of Ertbruggen et al. included out-of-plane bifurcations based on bronchoscopy measurements on human lung. These asymmetric lung models were deemed comparable to image-based lung model, and both exhibit very similar velocity magnitude profiles to our current study.
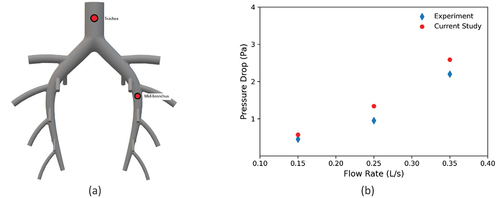
Finally, we validated the capacity of the CFD model to predict pressure drop in the airways by comparing our predicted results with pressure drop data obtained from an experimental measurement on a simplified pig lung airway [Citation37]. The study measured the pressure drop between the trachea and selected mid-bronchus utilizing differential pressure transducer. The simplified pig airway and locations of pressure probes are illustrated in . We performed CFD analysis on this simplified geometry with the same solver and mesh tolerances used in our study but matched the boundary conditions with the experiment. shows the predicted and experimental pressure drops presented as paired points for the three different flowrates considered. Both sets of results exhibit nonlinear increase in pressure drop with increasing flow rate due to greater energy loss at the bifurcations. The predictions are generally in good agreement with the experimental data. The slight increase in discrepancy between the two sets of results at higher flowrates may be attributed to the increase in uncertainty of the measurement.
Figure 5. Pressure probe location on simplified pig airway geometry (a) and comparison between calculated pressure drop with experimental result (b).
3.3. Pressure field
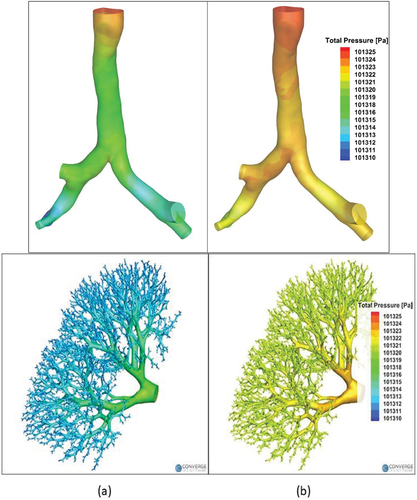
The hybrid model was used for CFD analysis of steady airflow in the right upper lobe from the trachea to the terminal bronchioles. The contours of total pressure at the wall are presented in for the two breathing conditions investigated (30 L/min for in left column and 15 L/min for 6b in the right column). The results for the first section of the hybrid model are shown in the top row while the corresponding results in the second section are shown in the bottom row. The pressure decreases gradually from the trachea to the terminal bronchioles under both breathing conditions investigated and both sections of the hybrid mode, with higher pressure drop observed at higher flow rate. There occurs local variation of pressure due to curvature of the airway and near bifurcations in the first section. The mass-weighted pressure drops from the trachea to the terminal bronchioles are found to be 6 Pa and 14 Pa for resting and light activity breathing conditions, respectively. These results are consistent with previous studies that employed stochastic coupling [Citation21] and transmission line model [Citation38] to demonstrate that there is little variation of pressure downstream of the upper airways (mouth and glottis).
Figure 6. Contours of total pressure for flow rate of 30 l/min (a) and 15 l/min (b). Profiles in middle airway (first section) are on top and profiles in distal airways (second section) are at the bottom.
3.4. Velocity field
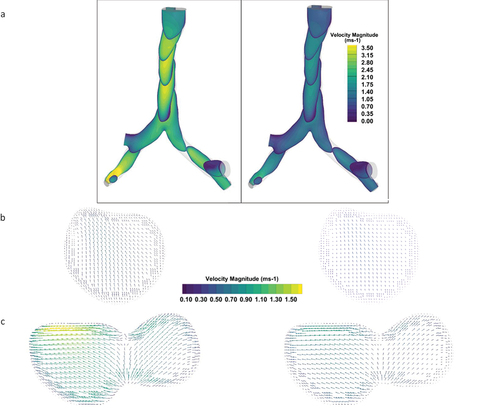
The predicted velocity field in the first section of the hybrid model is presented in for the two breathing conditions considered. The contours of axial velocity at different longitudinal cross-sections are shown in . shows the secondary flow vectors at an axial cross-section near the tracheal inlet. The corresponding secondary flow vectors at a cross-section just before the first bifurcation is shown in . shows that a complex asymmetric velocity profile quickly develops after a few tracheal diameters from the inlet that are markedly different from the profile obtained from idealized geometric models used in
Figure 7. Velocity field in the 1st section for flow rate of 30 l/min and 15 l/minPlane Slice Showing Contours of Velocity Magnitude (a) Vector Contours of Secondary Velocity near inlet cross-section (b) and carinal section(c).
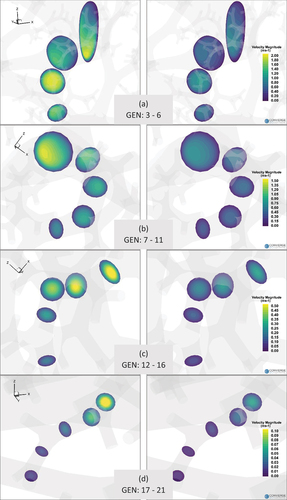
The contour maps of axial velocity magnitudes in the distal airways are presented in for airway tree ranging from generations 3 to 21. For the analysis of velocity in the distal airways, we randomly chose a flow path starting from the third generation and ending in generation 21 before terminating as terminal bronchiole. The axial velocity is then calculated at cross-sections located midway along the branch lengths. therefore represents the contours of axial velocities per generation along the selected flow path for 30 L/min
Figure 8. Contours of axial velocity magnitude in distal airways starting from generation 3 up to generation 21 for 30l/min and 15l/min.
We also compared the secondary flow at generation 7 in the selected airway for the two breathing conditions considered. The secondary velocity patterns (not shown here for brevity) differ significantly between the two breathing conditions although the magnitude of the secondary flow is quite low compared to the axial velocities. Two distinct recirculation zones are observed at the higher flow rate while the secondary flow is negligible at the lower flow rate. No significant secondary flow is observed for the higher flow rate after the 10th generation.
3.5. Mass flow distribution
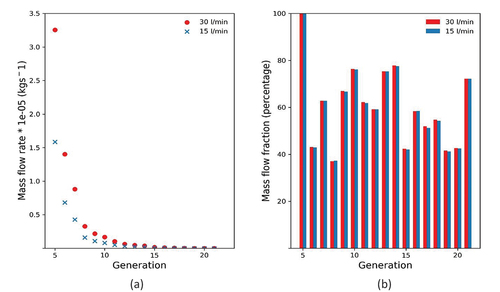
The predicted mass flow distributions in the distal airways for the two breathing conditions investigated are presented on a generation basis in two forms in . The results obtained for the exercise condition (30 L/min) are shown in red colour while the corresponding results for resting condition (15 L/min) are shown in blue. shows the mass flow rate through the generation down the selected airway path, exhibiting an exponential decay for both flow conditions considered. is a histogram of the fraction of air flowing into the daughter vessels relative to the total air flow in the previous generation plotted as percentages. The generational mass flow distribution indicates rapid distribution of air in the distal region of the airway as the flow is quickly divided by the bifurcating airway structure. This trend explains the high ventilation capacity of the lung structure even at low flow rates despite very little pressure drops in the distal airways. The high decay rate of airflow also indicates relatively small variation of volume in the alveolar region even when the flow rate is doubled. also shows there is very little variation in flow fraction divisions in the daughter branches for the two flow rates investigated.
Figure 9. Mass flow rate in the distal generations (a) and mass flow fractions in terms of flow in parent branch (b) through the selected airway path.
4. Discussion
A detailed analysis of air flow in the distal airways has been presented. The computational method utilizes a hybrid lung geometry integrating patient-specific primary geometry derived from CT datasets with a distal airway geometry based on deterministic algorithm. The hybrid model enables subject-specific boundary conditions to be utilized and reduces computational intensity and cost. The methodology can be readily adapted for accurate and cost-effective analysis of regional flow in any lobe provided the patient CT data are available.
The pressure drops in the first few generations of the trachea-bronchial tree contribute significantly to the overall pressure drop along the entire airway tree. There is a nonlinear increase in pressure drop with higher flowrate, indicating the need for increased respiratory effort during heavy breathing. The asymmetric velocity profile in the distal airways up to the 15th generation indicates the velocity profile in the parent branch has significant effect on the flow profile in the daughter branch and needs special consideration for accurate prediction of flow field in the distal airway. However, the assumption of uniform velocity inlet will be acceptable as inlet boundary condition provided the distal region of interest lies beyond the 15th generation. There is minimal variation in flow fraction divisions in the daughter branches. This observation indicates that the geometric features of the distal airways (i.e. dimensions and orientation) in 3D space relative to their parent branches dominate the flow distribution into the daughter branches rather than the actual breathing rate, at least for the breathing ranges considered in this study. This result may have implication in the use of mechanical ventilators for patients who have difficulty breathing on their own.
The meshing process for the CONVERGE solver employed for the computation occurs at runtime, which differs from typical CFD workflow where the mesh is well defined before the start of the solution process. This approach reduces the user input time for the meshing step of the workflow but requires a higher number of grid nodes (control volumes) to resolve the flow near the wall. This attribute may be a significant advantage as computational power is rapidly improving and user interaction for volume meshing is minimized. Post-processing of the complex geometry of the distal airway presents a unique challenge. In addition to the need for handling large datasets, it is essential to control surface transparency for improved flow visualization. The stationary wall boundary condition imposed on the luminal wall presents a limitation of the current study as airways typically deform during the actual breathing cycle. However, this assumption is widely accepted in previous studies for analysis of representative steady flow in lungs. Besides, the effect of flow-structure interaction is expected to be minimal in the distal airways of interest in this study due to the relatively low velocity. In addition, deformation in the lobe is known to be largely controlled by the motion of the diaphragm and the ribcage, rather than the luminal flow. Furthermore, the experimental data published in previous studies and used for validation of our numerical predictions were based on rigid structures. Notwithstanding, this assumption may not accurately represent airflow when the dynamic response to wall deformation becomes significant in transient analysis and may need to be relaxed in future studies.
5. Limitations of study
Several simplifications and assumptions were made that must be relaxed or improved in future studies. The flow was considered quasi-steady for the purpose of providing insight on flow behaviour in the distal airways at a specific instance of the breathing cycle. This assumption may not be suitable for transient analysis over the complete breathing cycle. The flow was also assumed to be laminar, thereby ignoring the turbulence that had been observed in the trachea in some studies. This assumption could be justified by the results of other studies indicating rapid turbulence decay in the first few generations of the tracheo-bronchial tree. Future studies will benefit from exploration of turbulence models such as Large Eddy Simulations [Citation16] or variations of Reynolds Transport Models [Citation24] that can adequately resolve turbulent-laminar transition phenomena.
Pressure distribution in the alveolar region of the lung was assumed to be spatially uniform by application of uniform pressure boundary condition at the outlets of the distal airway (sexond section of the hybrid model). This assumption is appropriate for the hybrid model since all the terminating branches represent terminal bronchioles with no truncation of the airways. The effect of upper airways was not considered in this study because the high-velocity jet emanating from the narrow region in the pharynx and larynx is quickly dissipated as air flows through the downstream bifurcating airway structure. As a result, the effect of the upper airway on flow in distal airways is not expected to be significant. In addition, the breathing conditions considered were adapted from a previously published study of Yamada et al. [Citation33]. Subsequent studies should explore a range of realistic breathing conditions beyond the two that were investigated here.
The coupling of the two segments of the hybrid method although practical may not adequately represent how the lung actually works. The proposed coupling method however provides a compromise between computational intensity and cost of replicating the complete tracheobronchial tree (TBT) for computation of airflow. The CFD case studies presented therefore provide proof-of-concept information for future detailed and advanced analysis that will incorporate other realistic features of lung dynamics including transient breathing pattern and fluid-structure interaction.
6. Conclusion
The primary objective of the study was to numerically model and analyse steady airflow in human distal airways. The analysis utilizes a hybrid lung geometry integrating patient-specific primary geometry derived from CT datasets with a distal airway geometry based on deterministic algorithm. The hybrid geometry spans the trachea to the terminal bronchioles of the airway tree. Subject-specific geometry and boundary conditions were utilized to improve accuracy of the predictions. Two breathing conditions were investigated and adopted from a previous study to represent resting and exercise activity. The results were first assessed for numerical accuracy through a grid-independence test. Then, the predictions were validated using published experimental and numerical data.
The findings of this study are summarized below.
The axial velocity profile remains asymmetric up to the 15th generation of the tracheo-bronchial tree after which it is approximately symmetric under both the resting and light-activity breathing conditions considered.
A secondary flow develops in the trachea well before the bifurcation due to the airway curvature.
The secondary flow pattern in the distal airways differs significantly between the two breathing conditions considered and persists further down the generations at the higher flow rate.
The magnitude of the secondary flow in the distal airways is small relative to the axial flow.
Although the peak velocity decreases gradually, the mass flow rate decreases exponentially as the flow divides at the bifurcations.
The geometric features of the airway are the primary determinant of flow distribution in the distal airways.
The numerical method may be suitable for analysis of airflow in both healthy and pathological airways through the application of patient-specific geometry and boundary conditions. It should however be noted that patient-specific boundary condition demands greater computational effort compared to the usual application of uniform pressure boundary condition, but it is essential in order to accurately represent physiological condition that is specific to the patient.
Notwithstanding the simplifications and limitations of the model as detailed in a previous section 5, the hybrid model developed in this study has successfully predicted the gross features of flow in distal airways and the results that are consistent with physiological observations. Such results include the asymmetric splitting of flow between the right and left lungs, non-linear increase in pressure drop at higher breathing rate and efficient distribution of air in distal regions for respiration. The methodology also represents a good compromise between computational intensity and cost.
The results obtained have physiological relevance. The hybrid model that incorporates subject-specific features appears to adequately predict the distal air flow. Thus, it can readily be adapted for future studies investigating regional and overall flow distributions in patients with asthma and COPD, diseases which are often prevalent in the distal airways. The results obtained for mass flow distribution relative to input flow rate has implication for patients with the need for assisted breathing through mechanical ventilation, such as patients in Intensive Care Units (ICUs) or severe COVID-19 treatment. Specifically, the predicted minimal change in mass flowrate in the distal airways between the two breathing conditions investigated implies that there may be little improvement of ventilation in obstructed distal airways beyond a specified mechanical ventilation input. This study has thus demonstrated that the application of mechanical ventilation requires optimization in order to avoid flow overload that often causes Ventilator-Induced Lung Injury (VILI) [Citation39,Citation40] rather than increase flow to the distal airways as desired. VILI has been implicated in several COVID-19 deaths.
The geometric features of the distal airways are affected by excessive deposition of cells, mucous or airway remodelling due to immune response. The hybrid lung model developed in this study may be readily adapted for detailed analysis of flow in the distal airway generations as well as regional flow distribution by employing the relevant pathological conditions. It can be used for lobectomy planning. Lobectomy is the partial or full removal of lung lobes that is often utilized as surgical treatment for subjects with lung disease including cancer and diseases inherited due to genetic predisposition or smoking habits [Citation41]. The methodology developed in this study isolates lobes by application of lobe-specific boundary conditions for detailed analysis. It is thus ideally suitable for future analysis of such pathological situations.
Acknowledgments
The study was partially supported by the US National Science Foundation, Grant number 1200841. CONVERGENT Science provided the computational fluid dynamic solver and post-processing suite utilized in this study. Dr. Hansen Mansy of Biomedical Acoustics Research lab, UCF provided the simplified porcine airway data utilized for model validation.
Disclosure statement
No potential conflict of interest was reported by the author(s).
References
- J. Choi, M.H. Tawhai, E.A. Hoffman, C.-L. Lin, et al., On intra-and intersubject variabilities of airflow in the human lungs, Phys. Fluids. 21 (10) 2009 Oct 13, pp. 101901. 10.1063/1.3247170
- A.J. Bates, R. Cetto, D.J. Doorly, R.C. Schroter, N.S. Tolley, A. Comerford, et al., The effects of curvature and constriction on airflow and energy loss in pathological tracheas, Respir. Physiol. Neurobiol., 2016 Dec 1, 234, pp. 69–78. 10.1016/j.resp.2016.09.002
- T. Aikawa, S. Shimura, H. Sasaki, M. Ebina, and T. Takishima, et al., Marked goblet cell hyperplasia with mucus accumulation in the airways of patients who died of severe acute asthma attack, Chest. 101 (4) 1992 Apr 1, pp. 916–921. 10.1378/chest.101.4.916
- A.S. Buist and B.B. Ross, Predicted values for closing volumes using a modified single breath nitrogen test, Am. Rev. Respir. Dis. 107, 5, (May 1973), pp. 744–752. doi:10.1164/arrd.1973.107.5.744
- J.A. Stockley, B.G. Cooper, R.A. Stockley, et at, Small airways disease: Time for a revisit?, Int. J. Chron. Obstruct. Pulmon. Dis. 7 (Aug 2017), pp. 2343–2353. doi:10.2147/COPD.S138540
- E.R. Weibel, A.F. Cournand, and D.W. Richards, Morphometry of the Human Lung, Springer, Berlin, 1963 Jan. 10.1007/978-3-642-87553-3
- K. Horsfield, G. Dart, D.E. Olson, G.F. Filley, G. Cumming, et al., Models of the human bronchial tree, J. Appl. Phys. 31 (2) (Aug 1971), pp. 207–217. doi:10.1152/jappl.1971.31.2.207
- T.J. Pedley, R.C. Schroter, and M.F. Sudlow, The prediction of pressure drop and variation of resistance within the human bronchial airways, Respir. Physiol. 9 (3) (1970 Jun 1), pp. 387–405. doi:10.1016/0034-5687(70)90094-0
- T. Heistracher and W. Hofmann, Flow and deposition patterns in successive airway bifurcations, Ann. Occup. Hyg. 41 (inhaled_particles_VIII) 1997 Jan 1, pp. 537–542.
- T.B. Martonen, Y. Yang, and Z.Q. Xue, Influences of cartilaginous rings on tracheobronchial fluid dynamics, Inhal. Toxicol. 6 (3) (1994 Jan 1), pp. 185–203. doi:10.3109/08958379408995231
- Y. Liu, R.M. So, and C.H. Zhang, Modeling the bifurcating flow in a human lung airway, J. Biomech. 35 (4) (2002 Apr 1), pp. 465–473. doi:10.1016/S0021-9290(01)00225-1
- R.K. Calay, J. Kurujareon, and A.E. Holdø, Numerical simulation of respiratory flow patterns within human lung, Respir. Physiol. Neurobiol. 130 (2) (2002 Apr 1), pp. 201–221. doi:10.1016/S0034-5687(01)00337-1
- N.H. Johari, J. Balaiyah, and Z. Ahmad Effect of chronic obstructive pulmonary disease on airflow motion using computational fluid dynamics analysis. International Conference on Computer, Communications, and Control Technology (I4CT), Langkawi, Malaysia, (pp. 249–254), 2014 Sep 2.
- N. Nowak, P.P. Kakade, and A.V. Annapragada, Computational fluid dynamics simulation of airflow and aerosol deposition in human lungs, Ann. Biomed. Eng. 31, 4, (Apr 2003), pp. 374–390. doi:10.1114/1.1560632
- S. Qi, Z. Li, Y. Yue, H.J. van Triest, Y. Kang, et al., Computational fluid dynamics simulation of airflow in the trachea and main bronchi for the subjects with left pulmonary artery sling, Biomed. Eng. Online. 13 (1) (Dec 2014), pp. 1–5. doi:10.1186/1475-925X-13-85
- A. Islam, A. Rouhollahi, and M. Lauria, et al. Modeling air flow in pathological human airway with patient specific CT-Data, A SME International Mechanical Engineering Congress and Exposition, Columbus, Ohio, USA, Virtual, (Vol. 85598, p. V005T05A036). 2021 Nov 1
- O.J. Ilegbusi, Z. Li, B. Seyfi, Y. Min, S. Meeks, P. Kupelian, A.P. Santhanam, et al., Modeling airflow using subject-specific 4DCT-based deformable volumetric lung models, J. Biomed. Imaging, 2012 Jan 1, pp. 4–4. 10.1155/2012/350853
- T. Gemci, V. Ponyavin, Y. Chen, H. Chen, R. Collins, et al., Computational model of airflow in upper 17 generations of human respiratory tract, J. Biomech. 41 (9) 2008 Jan 1, pp. 2047–2054. 10.1016/j.jbiomech.2007.12.019
- H.O. Coxson, Quantitative computed tomography assessment of airway wall dimensions: Current status and potential applications for phenotyping chronic obstructive pulmonary disease, Proc. Am. Thorac. Soc. 5 (9) (2008 Dec 15), pp. 940–945. doi:10.1513/pats.200806-057QC
- A. Fabijańska, M. Janaszewski, and M. Postolski, et al. Airway tree segmentation from ct scans using gradient-guided 3d region growing. Progress in Pattern Recognition, Image Analysis, Computer Vision, and Applications: 14th Iberoamerican Conference on Pattern Recognition, CIARP, Guadalajara, Jalisco, Mexico. Proceedings 14 2009 (pp. 247–254). 2009 Nov 15-18.
- D. Keith Walters, G.W. Burgreen, R.L. Hester, D.S. Thompson, D.M. Lavallee, W.A. Pruett, X. Wang, et al., Cyclic breathing simulations in large-scale models of the lung airway from the oronasal opening to the terminal bronchioles, J. Fluids Eng. 136, (10) 2014 Oct 1. 10.1115/1.4027485
- S. Choi, S. Yoon, J. Jeon, C. Zou, J. Choi, M.H. Tawhai, E.A. Hoffman, R. Delvadia, A. Babiskin, R. Walenga, C.-L. Lin, et al., 1D network simulations for evaluating regional flow and pressure distributions in healthy and asthmatic human lungs, J. Appl. Physiol. 127 (1) 2019 Jul 1, pp. 122–133. 10.1152/japplphysiol.00016.2019
- M.H. Tawhai, A.J. Pullan, and P.J. Hunter, Generation of an anatomically based three-dimensional model of the conducting airways, Ann. Biomed. Eng. 28, 7, (Jul 2000), pp. 793–802. doi:10.1114/1.1289457
- A. Fedorov, R. Beichel, J. Kalpathy-Cramer, J. Finet, J.-C. Fillion-Robin, S. Pujol, C. Bauer, D. Jennings, F. Fennessy, M. Sonka, J. Buatti, S. Aylward, J.V. Miller, S. Pieper, R. Kikinis, et al., 3D slicer as an image computing platform for the quantitative imaging network, Magn. Reson. Imaging. 30 (9) 2012 Nov 1, pp. 1323–1341. 10.1016/j.mri.2012.05.001
- H. Kitaoka, R. Takaki, and B. Suki, A three-dimensional model of the human airway tree, J. Appl. Physiol. 87 (6) (1999 Dec 1), pp. 2207–2217. doi:10.1152/jappl.1999.87.6.2207
- H. Kitaoka, S. Koc, and S. Tetsumoto, et al. 4D model generator of the human lung,“Lung4Cer”. 35th Annual International Conference of the IEEE Engineering in Medicine and Biology Society (EMBC), IEEE, Osaka, Japan. (pp. 453–456). 2013 Jul 3-7.
- B.M. Stanton and B.A. Koeppen, eds, Berne & Levy Physiology, 6th, Mosby/Elsevier, Philadelphia, 2008. pp. 418–422.
- C. Kleinstreuer and Z. Zhang, Airflow and particle transport in the human respiratory system, Annu. Rev. Fluid Mech. 42 (1) (2010), pp. 301–334. doi:10.1146/annurev-fluid-121108-145453.
- C.L. Lin, M.H. Tawhai, G. McLennan, E.A. Hoffman, et al., Characteristics of the turbulent laryngeal jet and its effect on airflow in the human intra-thoracic airways, Respir. Physiol. Neurobiol. 157 (2–3) 2007 Aug 1, pp. 295–309. 10.1016/j.resp.2007.02.006
- Z. Zhang and C. Kleinstreuer, Computational analysis of airflow and nanoparticle deposition in a combined nasal–oral–tracheobronchial airway model, J. Aerosol. Sci. 42 (3) (2011 Mar 1), pp. 174–194. doi:10.1016/j.jaerosci.2011.01.001
- J.W. De Backer, W.G. Vos, C.D. Gorlé, P. Germonpré, B. Partoens, P.M. Parizel, W. De Backer, et al., Flow analyses in the lower airways: Patient-specific model and boundary conditions, Med. Eng. Phys. 30 (7) (2008 Sep 1) pp. 872–879. 10.1016/j.medengphy.2007.11.002
- J.W. De Backer, W.G. Vos, S.C. Vinchurkar, R. Claes, A. Drollmann, D. Wulfrank, P.M. Parizel, P. Germonpré, and W. De Backer, et al., Validation of computational fluid dynamics in CT-based airway models with SPECT/CT, Radiology. 257 (3) (Dec 2010), pp. 854–862. doi:10.1148/radiol.10100322
- Y. Yamada, M. Yamada, S. Chubachi, Y. Yokoyama, S. Matsuoka, A. Tanabe, Y. Niijima, M. Murata, K. Fukunaga, M. Jinzaki, et al., Comparison of inspiratory and expiratory lung and lobe volumes among supine, standing, and sitting positions using conventional and upright CT, Sci. Rep. 10 (1) 2020 Oct 1, pp. 1–2. 10.1038/s41598-020-73240-8
- K.J. Richards, P.K. Senecal, and E. Pomraning, Converge 3.0.19, Convergent Science, Madison, WI, 2022.
- L. de Rochefort, L. Vial, R. Fodil, X. Maître, B. Louis, D. Isabey, G. Caillibotte, M. Thiriet, J. Bittoun, E. Durand, G. Sbirlea-Apiou, et al., In vitro validation of computational fluid dynamic simulation in human proximal airways with hyperpolarized 3He magnetic resonance phase-contrast velocimetry, J. Appl. Physiol. 102 (5) (May 2007), pp. 2012–2023. doi:10.1152/japplphysiol.01610.2005
- C. Van Ertbruggen, C. Hirsch, and M. Paiva, Anatomically based three-dimensional model of airways to simulate flow and particle transport using computational fluid dynamics, J. Appl. Physiol. 98, 3, (Mar 2005), pp. 970–980. doi:10.1152/japplphysiol.00795.2004
- P.P.T Gamage, F. Khalili, M.D. Khurshidul Azad, H. A. Mansy. Modeling inspiratory flow in a porcine lung airway, J. Biomech. Eng. 140 (6), (2018 Jun 1), pp. 061003. doi:10.1115/1.4038431
- B. Ma and K.R. Lutchen, An anatomically based hybrid computational model of the human lung and its application to low frequency oscillatory mechanics, Ann. Biomed. Eng. 34, 11, (Nov 2006), pp. 1691–1704. doi:10.1007/s10439-006-9184-7
- A. Kumar and F. Anjum, Ventilator-Induced Lung Injury (VILI), 2023 Apr 27. in StatPearls, K. Shumway, ed., [Internet]. StatPearls Publishing, Treasure Island (FL), 2023 Jan. PMID: 33085391.
- P. D’Avignon, G. Hedenström, and C. Hedman, XIII. Pulmonary complications in respirator patients, Acta Med. Scand. 154 (S316) (1956 Jan 12), pp. 86–90. doi:10.1111/j.0954-6820.1956.tb06263.x
- G. Rea and M. Rudrappa, Lobectomy, in StatPearls [Internet], 2023 Jan StatPearls Publishing, Treasure Island (FL), 2023 Feb 13. PMID: 31971762.