?Mathematical formulae have been encoded as MathML and are displayed in this HTML version using MathJax in order to improve their display. Uncheck the box to turn MathJax off. This feature requires Javascript. Click on a formula to zoom.
ABSTRACT
Controlling antibiotic drug resistance requires understanding extinction and emergence mechanisms of emerging bacteria. Selective pressure from prolonged antibiotic misuse may cause high-level antimicrobial resistance. Self-medication and other socioeconomic factors reduce antibiotic use, accelerating the emergence and extinction of resistant pathogens through stochastic fluctuation. This continuous antibiotic self-medication exposes individuals and communities to antibiotic resistance, especially in low- and lower-middle-income countries, according to current literature. We developed a stochastic drug-resistance model that integrates socio-economic growth and antibiotic use to study extinction and strain establishment in this paper. We analytically derived the extinction threshold using the multi-type branching process and obtained pathogen extinction conditions that match numerical experiments. The model's sensitivity analysis identifies extinction dynamics' key parameters. Our results show that higher income, awareness, and lower antibiotic use may increase the chance of extinction by reducing antibiotic misuse, along with strain transmission potential. These analyses may help public health policymakers combat drug resistance.
1. Introduction
The ever-increasing spread of drug resistance is a serious threat to global health, and it has received a lot of attention in the microbiological and medical communities [Citation1]. The evolution of sensitive strain through mutation and plasmid transfer accelerates the drug-resistance process [Citation2–4]. While the development of mutant variants is a random process that occurs at the within-host level, plasmids are transmitted from one bacterium to another (even from another species) at the population level, primarily through conjugation [Citation5].
In order to establish themselves within the population, phenotypically different variations of mutant strains emerge in a small number of hosts and eventually escape from stochastic extinction and transmission in the population [Citation6]. Endless mutant strains demonstrating various levels of resistance are thus able to rigidly fix themselves in the population [Citation7]. For example, resistance occurs in Mycobacterium tuberculosis usually through point mutations, whereas many other bacterial pathogens can acquire resistance by horizontal transfer [Citation8]. Mutation rates also vary widely – for example, the mutation rate of influenza is very high compared to any other pathogen, whereas it can be several orders of magnitude lower in the case of malaria than that of influenza [Citation9; Citation10]. In contrast, vancomycin-resistant S. aureus or the spread of the gene NDM-1 develops resistance through the transfer of genetic material between species via horizontal gene transfer [Citation11; Citation12]. Often plasmids may contain several resistance genes so that one drug can select for multi-resistance [Citation13]. The rapid spread of plasmids through bacterial populations enables them to escape negative selection by moving to other hosts [Citation14]. The dynamics of resistance under plasmid-borne and mutational mechanisms might therefore differ, but these differences are not yet largely explored.
On the other end of the spectrum, there is a strong association between the economic growth of nations and the current global drug-resistance scenario [Citation15–17]. The ever-increasing antibiotic consumption and development of resistance are observed in many countries worldwide ( and E2 in Appendix). A report by the World Bank Group in 2016 entitled Drug Resistant Infections: A threat to Our Economic Future indicates that resistance has the potential to cause similar or more economic damage than the 2008 financial crisis [Citation18]. According to an expected future projection in this paper, medication resistance can lead low-income nations to lose more than 5% of their GDP and lock approximately 28 million people in poverty by the year 2050. The increase in the current global burden of resistance was mainly due to high consumption in LMIC through self-medication [Citation19]. According to the World Health Organization (WHO), nearly 80% of the antibiotics used in LMICs are used in community settings, with approximately 20–50% of the antibiotics used inappropriately, while more than two-thirds of antibiotics available in the pharmaceutical sector are used for self-medication [Citation18–20]. A new study shows self-medication incidence data in WHO Southeast Asian Region nations [Citation21] (See in the Appendix). However, unregulated and improper antibiotic use has an impact on the building of resistance in the population by altering the pathogen’s appearance and extinction process.
In order to determine the probability of an outbreak or the disease extinction for such infections, a Continuous-Time Markov Chain (CTMC) framework is more efficient than a deterministic version of the model and its metrics [Citation40–44]. The theory of multi-type branching process is used to determine the stochastic threshold of extinction [Citation42; Citation45; Citation46; Citation47]. Many stochastic models have been developed to estimate the probability of extinction of infections and organisms applying branching processes in the field of ecological populations, cellular processes, genetics, and epidemics on networks [Citation48–50]. However, to our knowledge, there is no modelling work emphasizing discussions on the stochastic extinction of drug resistance that incorporates the socioeconomic factors involving self-medication in the development of drug resistance in the community.
In our previous work, we developed a model to understand the dynamics of drug-resistance phenomena involving socio-economic growth in population [Citation15]. The earlier model was built upon several simplistic assumptions such as linear economic growth over time, and the linear effect of income on the inappropriate use of antibiotics through self-medication. In addition, no mutation or plasmid transfer was assumed in the earlier model. We relaxed such assumptions and enhanced the model in the current framework. We establish the current framework as a CTMC model, which describes the random behaviour that appears in the transmission of resistant strain in the population.
We perform both analytical derivation and numerical computation of the extinction threshold, and they exhibit the right match. We also perform a sensitivity analysis to identify the parameters that have the most impact on the extinction of the strains. Our model demonstrates that the transmission potential of respective strains plays a major role in extinction, but at the same time, higher income, awareness, and lower antibiotic use may increase the chance of establishment and extinction significantly. These analyses are beneficial to health policy-makers and may quantify some parameters that are important to controlling the situation.
The organization of paper is as follows: In Section 2, we describe the integrated framework of antibiotic usage, socioeconomic growth, and transmission of drug-resistant strain in the population, Section 3 describes basic model properties, Section 4 illustrates the stochastic implementation of the dynamic model and computes the probability of extinction, Section 5 describes numerical computation and results. Finally, we discuss the limitations and scope of the research in this area.
2. Model
In this paper, we extend our previous deterministic drug-resistance model to a stochastic framework where emergence and selection of resistant strain, the spread of infection, and volume of drug use are highly stochastic in nature, although the skeleton of the stochastic model is based on an amalgamation of socio-economic growth, ecology of infectious disease, and antibiotic (mis)use by individuals including mutation and plasmid transfer [Citation15]. See for different components and interactions among them. Here, we briefly describe different components of the model:
Figure 1. Schematic of the integrated model system combining (a) infection process component (b) Economic production component, and (c) Antibiotic overuse components. Arrows indicate feedback from one component on the other generating the self-reinforcing dynamics of the system.
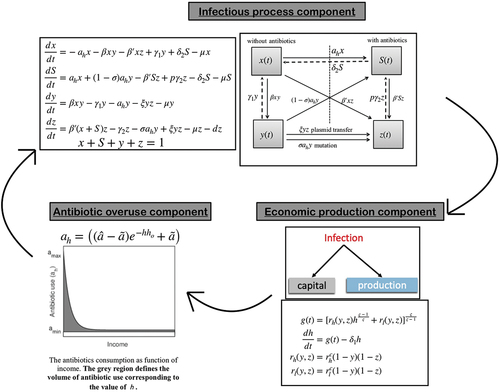
2.1. Economic growth component
In the economic growth component, we used the Constant Elasticity of Substitution production function, introduced by Solow [Citation51], that describes that the production technology has a constant percentage change in capital due to marginal change in technical substitution [Citation51,Citation52]. The effective output per unit labour (i.e. capital) is given by the following equation:
where is the production function,
and
are shared in the output from capital and labour respectively with
.
is the elasticity of substitution between capital and technology-augmented labour, determining the homogeneity of the production function. Leontief, linear and Cobb Douglas functions are special cases of the CES production function [Citation51]. Considering depreciation, the rate of change of capital becomes:
where is the capital (income) at time
scaled to the labour supply and
is the rate of capital depreciation.
2.2. Disease transmission component
We extend the classic Susceptible-Infected-Susceptible (SIS) framework to model disease transmission due to both strains – sensitive and resistant. We assume drug-resistant strain is already present and circulating in the population, and individuals are either colonized by sensitive strains or by drug-resistant strains and not both. The population is a closed population and divided into four compartments: Susceptible not using antibiotics , susceptible using antibiotics
, infected by sensitive strain
, and infected by resistant strain
. We assume that a fraction of individuals colonized with sensitive strains will select pre-existing antibiotic-resistant mutants, and the resistant population increases proportionally to antibiotic usage (in unit Daily Defined Dosages (DDDs)). In contrast, plasmid transfer occurs through contacts between individuals colonized with a sensitive strain and colonized with a resistant strain at the rate
. The parameter
defines natural mortality and
is death due to the severity of drug resistance. The rate of mutation is given by
.
is the average duration of colonization of sensitive strain and
is the average duration of colonization of resistant strain.
is the average duration of antibiotic consumption.
is the fraction of the recovered individuals who are still taking antibiotics. exhibits the schematic of the interaction among disease compartments. The following coupled differential equations govern the dynamics:
where . We can exclude the differential equation of
from system (3), because population is a closed population.
2.3. Antibiotic misuse
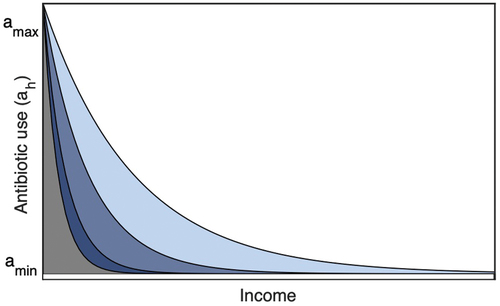
Irrational use of antibiotics has become a frequent practice in developing countries. Self-medication and over-the-counter (OTC) drug use is widespread in low and lower-middle-income countries (LMICs) [Citation53–57]. Countries in the WHO Southeast Asian region, like India, Bangladesh, Nepal, Bhutan, Indonesia, Korea, Sri Lanka, and Thailand, have high self-medication [Citation21; Citation56] (see and E2 in Appendix). However, there is no empirical evidence against this complex nonlinear association between self-medication practice and the economic growth of the population. We consider an exponential function to represent the reciprocal relation between socioeconomic status and self-medication in a population compared to the linear relation assumed in our previous paper [Citation15; Citation58]:
To test our hypothesis, we illustrate and compare the complex outcomes as emergent properties of parsimonious integrated models. In the exponential framework, antibiotic (mis)use is high, say when income (capital) is low, and approach a minimum level
whenever income is high.
exhibits the function schematic. The parameter
is a crucial parameter that indicates the sensitivity of public’s education and awareness level to antibiotic utilization [Citation15; Citation59]. The area under the curve determines antibiotic consumption. explains that the lower the value of
, the higher the self-medication, and hence higher the antibiotic consumption.
Figure 2. The schematic of the antibiotics consumption as function of income. The shaded region under the curve defines the volume of antibiotic use corresponding to the different values of . From upper to lower curves the values of
are taken as {0.5, 1, 2, 3}.
2.4. Integrated model system
We consider the share parameters and
in the growth model (1) to be functions of strain prevalence because the most immediate impact of health on economic growth occurs through the cumulative effects of all infections [Citation19; Citation20; Citation60; Citation61; Citation62]:
where parameters and,
determine the growth of capital in the absence of any infection in the population and (
. Combining (1) - (6), we have the following coupled differential equations representing the integrated system as follows:
where , and
.
3. Basic model properties
The initial conditions:
and the parameters are real positive. In order to show that our model is well-posed and biologically meaningful, we will prove that the solution set of the given model is positively invariant [Citation63].
Lemma 3.1
Each solution of the model with the non-negative initial condition is non-negative for all
.
Proof.
Let
We can rewrite the model as
where
Now,
Following the invariant property of a dynamical system (see [Citation63]), we see that is positively invariant set for the system given by Equationequations (7)
(7)
(7) . This implies that our problem is mathematically well-posed.
3.1. Basic reproduction ratio
The disease-free equilibrium (DEF) is given by:
We use the next-generation matrix method to find out the basic reproduction number [Citation64–67]. We have two compartments
and
where new infections appear. So, calculating the next-generation matrix from a model (7), we have
The spectral radius of i.e,
is the basic reproduction number which is given by:
where ,
,
and
are transmission potentials of sensitive and resistant strains, respectively.
(1) If , then DFE is globally asymptotically stable.
(2) If , then there exists a unique endemic equilibrium which is locally asymptotically stable.
See appendix A1 for more information.
4. Stochastic implementation of integrated model
The basic reproduction number articulated above can be used to determine, on average, whether the appearance of a small number of infectious host pathogens will result in a major outbreak or disease will eventually die out. However, stochastic extinction may occur even if , which is called stochastic fade-out of an epidemic [Citation44,Citation46]. It is necessary to consider a stochastic model in order to determine the probability of disease extinction or predict a major outbreak that occurs by a pathogen. In this section, we implement the same deterministic model (7) to a continuous-time Markov chain (CTMC) model with a finite number of population and considered the multi-type Galton-Watson branching process (GWbp) to calculate the probability generating functions (pgf) from the CTMC model. For a general idea about the GWbp, please see the references [Citation46,Citation68,Citation69]. It may be worthwhile to mention here that the conditions
does not hold further for the stochastic model.
4.1. CTMC model and derivation of extinction probability
We implement ,
and
as discrete-valued random variables at time
. The dynamics of the CTMC model can be interpreted in terms of the infinitesimal transition probabilities for stochastic processes using the vector
given as
The transition probabilities and their rates are given in .
Table 1. State transitions and rates.
Using the model equations in (7), we compute the probability generating function (pgf) for offspring from sensitive strain , given
and
is
and offspring probability generating function (pgf) for resistant strain , given
and
is
where denotes the individual in the compartment of sensitive strain and resistant strain, respectively. The power to
denotes the number of offspring generated from one respective individual. Detailed calculations of the probability-generating functions are given in Appendix A2.
Remark 1. (1,1) is always a fixed point of and
, i.e.,
and
. Also,
‘s are not linear, i.e.,
This gives,
The expectation matrix is irreducible [Citation40,Citation42]. Since off-spring pgfs are non-linear, and
is irreducible, there are at most two fixed points in [0,1]
[0,1], which depends on the spectral radius
of matrix
. The branching process is called sub-critical, critical or super-critical if
,
or
, respectively. The existence of a non-trivial extinction probability in a parameter regime is determined by
. We use the Jury condition to compute the parameter regime where
(see Appendix A3)
Now, suppose , and
, we have a unique second fixed point. Then
gives
which produces quadratic equation in
Similarly gives
As colonization by drug-sensitive strain in the community inhibits invasion by drug-resistant [Citation15], the probability of extinction of resistant strain with initial condition is given by
where are obtained from Equationequations (9)
and (Equation10
).
5. Numerical computation and results
We implement the entire model given by Equationequations (7)(7)
(7) as a stochastic system using a tau-leap algorithm, which is an event-driven approximated method of the Gillespie algorithm used for the simulation of stochastic systems [Citation70]. In the process of developing antibiotic drug resistance, we consider a small population, where event-driven stochasticity is more relevant [Citation71; Citation72]. The unit for the time step of the simulation is
. The algorithm updates the propensity functions at each interval length
and then the reaction happens. Here, all demographic processes (i.e. birth and death) and disease processes (i.e. transmission, recovery, mutation and plasmid transfer), drug use, and growth of income in the deterministic model Equationequations (7)
(7)
(7) are assumed to be event-driven. lists all the state transitions between model variables. The summary of tau-leap algorithm is as follows: let
be a disease compartment. Let
be the list of events (such as the transmission of infection, recovery, mutation, plasmid transfer, etc.) that occurs at the rate
(most of our reactions are density dependent) and with a state change matrix
. First, we initialize the model with the initial condition
and then calculate the event rates
. We choose a fixed time step, i.e.
. For each event
, we then sample
from a Poisson distribution with mean
. This
is the number of times each event occurs during the time interval
. Finally, we update the state by
. The initial populations for the stochastic run are considered as follows:
,
,
,
, with a total population of 200.
5.1. Mechanism of emergence and probability of extinction
We explore the extinction dynamics under two mechanisms: mutation and plasmid transfer. The mutation is omnipresent in the mechanism of evolution, but the ability of horizontal gene transfer differs tremendously between pathogens [Citation78].
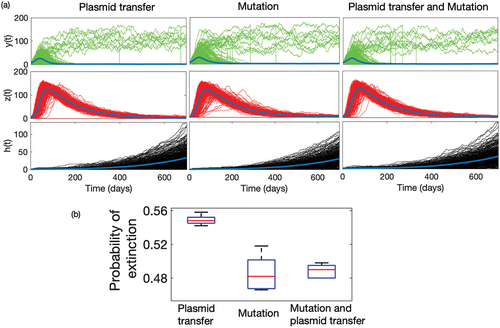
represents the time series of sensitive and resistant strains obtained from 10,000 sample runs of the model when both plasmid transfer and mutation drive the resistance separately, and simultaneously. The average population of resistant strain grows and becomes extinct much faster in the case of plasmid transfer, which is not the same as the case of mutation. In the case of mutational resistance, both the growth and decay of resistance are relatively slow. The emergence of resistance through plasmid transfer follows a mass-action law, which ensures that the multiplication of resistance depends on the current densities of the resistant population
itself. So, the process develops faster. In contrast, mutation depends only on the density of sensitive strains
in the population. The continuous mutation from
, though at a very small rate, ensures the longer-time persistence of resistant mutants in the community. We estimate the probability of extinction of resistant strains from these time-series simulations. For example, the mean time of extinction for Plasmid transfer is approximately 598 days, while for the case of mutation and both (Plasmid transfer & mutation) show approx. 700 days. also exhibits a box plot of this probability under different mechanisms over a longer period, and shows that it is much higher in the case of plasmid transfer. We observe a similar qualitative scenario when we consider the linear functional relation between economic status and antibiotic usage ( in Appendix). However, the extinction of resistant strains provides a selective advantage for sensitive strain
, but it also decays in the presence of antibiotic use. As the rate of overall plasmid transfer is relatively much higher than mutation, sensitive strain
also decays faster compared to the case of mutational resistance.
Figure 3. (a) Time series of sensitive strain (Green) and resistant strain
(Red) and income
(Grey) under different mechanistic process of emergence: mutation, plasmid transfer, and both mutation and plasmid transfer. (b) Box plot of probability of extinction of resistant strain
under different process. We have simulated the model 5000 times for 700 days, and calculated the number of extinction at the
day for three different processes with different initial conditions. In numerical case, we consider the extinction probability as proportion of runs which attains the value ‘0’ by 700 days.
5.2. Probability of disease extinction
Using parameter values given in , we numerically compute the probability of extinction of resistance strain under different initial values and compare the results obtained analytically from Equationequation (11)(11)
(11) . We consider 10,000 stochastic runs of the model under the same parameter regime with the same initial conditions and obtain that the proportion of resistant strain
hits zero. presents the
, the probability of extinction under different initial values both analytically and numerically. As seen from the , both numerical approximations and analytical estimates of
match with each other.
Table 2. Baseline parameter values for simulation.
Although we have not experimented with this extensively, the general pattern shows that the probability of extinction of resistance is higher when the initial number of the population with sensitive strain is high. This is also reflected in Equationequation (11)(11)
(11) . A probable ecological explanation for this is that the resistant strain cannot invade the population when the density of the sensitive strain is high. However, the probability of extinction is significantly low when the population with a resistant strain is initially greater than the population with a sensitive strain. The resistant pathogen circulates in the community and eventually establishes itself in the population by out-competing the sensitive strain.
5.3. Sensitivity analysis
A public health objective to eradicate or control the pathogen outbreak is to determine all pivotal characteristics of an epidemic that drives the infection. We compute partial rank correlation coefficients (PRCC) and perform a sensitivity analysis to determine the impact of uncertainty in the outcomes due to variations in certain parameters of the model [Citation79–82]. PRCC measures the strength of the relationship between the model outcomes and the parameters, stating the degree of the effect that each parameter has on the outcome. We assume that all the model parameters are uniformly distributed. We have carried out 1000 simulations of the model using the ranges and baseline values given in .
The sensitivity analysis indicates the parameters that have the most influence on drug resistance transmission dynamics. Identification of given important parameters is necessary to form effective control measures for combating the spread of resistance. The parameter and
are the two major parameters that influence the dynamics as seen by .
Figure 4. Tornado plot (obtained using PRCC) exhibits influence of crucial parameters on the dynamics of variables ,
and
. The baseline parameters values are given in and
,
,
,
. For PRCC, ODE45 is used to analyse the solution for 0–700 days and the end point is taken to perform the sensitivity analysis.
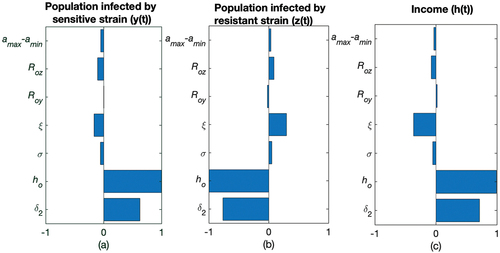
The p-value of these two parameters helps us to understand the significance of the variables ().
Table 3. Probability of disease extinction from Equationequation (11)
(11)
(11) and numerical approximation based on 10,000 sample time series of the model with parameter values
,
,
.
Table 4. -value of determines the significance of parameters
and
.
Excessive use of antibiotics drives the growth of resistance [65]. The parameter reflects the average antibiotic use in the population, as
is the mean duration of antibiotic use. As shows
is inversely proportional to
. Long-term use of antibiotics may fuel resistance in the community. The longer duration of antibiotic use gives rise to more
which declines the
and also income
.
is an important parameter in the dynamics that can be related to the public health control strategy. Restricting the duration of antibiotic use can slowdown the process of emergence of resistance by decreasing the selective pressure. In a study, it was observed that over-prescription of antibiotics was prevalent in patients for pulmonary infiltrates in ICU [Citation83]. Drugs once started were continued for 4–20 days, disregarding the likelihood of pneumonia or even the absence of an extrapulmonary infection. A clinical control study over a small population in a hospital indicates that some patients diagnosed with recurrent pulmonary infections, who received antibiotic therapy only for 8 days show significantly less frequent emergence of multi-resistant pathogens as compared to patients who received treatment for the usual 20 days [Citation83]. The parameter
determines the impact of education and awareness of the community on antibiotic consumption. According to
(), the lower the value of
, the higher the volume of antibiotic use (see Equationequation 4
(4)
(4) ). Low education and awareness accelerate the imprudent practice of self-medication, which is more prevalent in developing countries. The likelihood of misuse is immense in low- and middle-income countries due to the high cost of treatments and also easy access to over-the-counter (OTC) drugs. Hence,
decreases with increase in
. A higher value of
determines a low level of antibiotic use and low level of resistance, so
and
increase with the increase in value of
.
In particular, the results of this sensitivity analysis may provide insights into the public health authority's ability to design strategies that reduce the burden of drug resistance in the community. Public health programmes can use social media to spread awareness and educate people about the problem of drug resistance, put limitations on selling drugs over-the-counter and can provide incentives for proper treatment. Education and awareness can curtail significantly self-medication and over-the-counter (OTC) antibiotic consumption.
In , is positively correlated with
and negatively correlated with
as more the transmission of sensitive strain, more is the increase in
population and decrease in the
population.
is positively related with
as rising in the transmission of resistance strain will increase the population
, which in turn, shrink the population of
and scale down the income
due to socio-economic impact of disease and infections. So,
is negatively related to
.
Resistance to antibiotics can occur either by mutations or by plasmid transfers, which are the two most important factors assumed in the current model of antibiotic drug resistance. With the increase in and
,
increases () and antibiotic consumption also increases while income decreases (). Antibiotics eliminate drug-sensitive strains, leaving behind resistant strains to proliferate due to natural selection [Citation84]. So,
and
have a negative impact on the population of
().
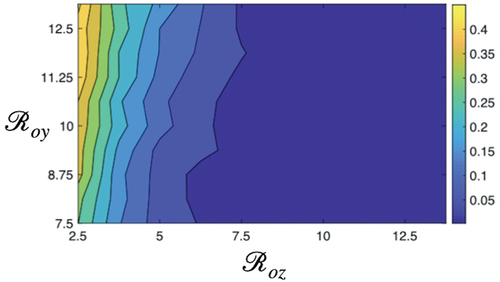
5.4. Impact of  and on probability of extinction
Basic reproduction numbers are very important parameters that impact the probability of extinction. The basic reproduction number of sensitive strain is given by:
The transmission potential of resistant strain is given by the basic reproduction number
From , when sensitive strain will persist in the population. As a result, the population infected with resistance strain will be less, hence there will be a high probability of extinction of
(). When
, the resistant strain easily dominates the sensitive strain, as the fitness cost for a resistant strain is less. The higher the value of
, the easier the elimination of sensitive strain. The community will be invaded by the resistant strain. With values
, both sensitive and resistant strains coexist in the population – this region determines the medium probability of extinction. Thus, for high extinction of
basic reproduction number of the sensitive strain should be greater than the reproduction number of the resistant strain to existing in the population in the presence of the resistance strain. Together, it is observed that
is more influential in changing the extinction dynamics compared to
. However, this pattern also depends on other socio-economic parameters such as poverty, income, self-medication, poor community hygiene, and so on.
Figure 5. Impact of and
on extinction of resistance strain given by the contour plot. It depicts that for lower value of
only sensitive strain exist so probability of extinction is high. When fitness of resistance strain increases
, strains starts multiplying and thus invade the sensitive strain.
5.5. Impact of the volume of antibiotic consumption, awareness, and education level on the probability of extinction
Although sensitivity analysis indicates a high correlation of drug resistance with the volume of drug use, in this section, we quantify the nonlinear dependence of these variates by portraying the probability of extinction of resistant strain in the two-parameter regime, the awareness level and the variability of drug use
by the community.
shows the contour plot of probabilities of extinction for and difference
of antibiotic consumptions. The image follows a pattern from the lower to the higher value of the probability of extinction of
. It exhibits a high probability of extinction when the difference
is low, but there is a little impact of
. In contrast, there is a high non-linear dependence of
, when the difference is relatively higher. The probability of extinction increases from low to moderate as the
increases when the difference in antibiotic use is high. With higher
the total volume of antibiotic use decreases, and hence the fitness level of
shrinks ensuring the co-existence of strains, and so, the probability of extinction is medium.
Figure 6. The contour plot of resistance dynamics depending the differences in maximum and minimum drug usages and
. The low education in developing nations drives higher antibiotic use. In developed nations difference in drug usage is low, and hence
has negligible impact. The increased difference
implies a low-middle income countries where education and knowledge about antibiotic use plays an important role. For higher values in difference and
, density of population infected with resistance strain is more, which makes the extinction difficult. Baseline parameters are given in .
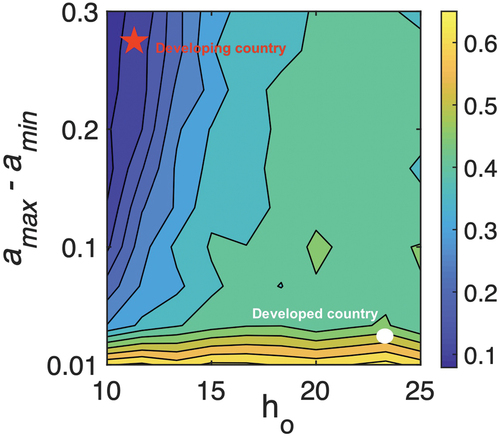
We may characterize this non-linear pattern of the probability of extinction in terms of the development profile of nations. As indicated by the red star and white circle, we can identify that developing countries are apparently situated in the left-uppermost corner of the diagram, whereas developed populations are placed in the right-lowermost corner. Extinction is more unlikely in developing nations. Partly, because of the low economy and inappropriate use of antibiotics increase the burden of disease in such communities, which also inhibits socio-economic growth and further promotes self-medication in the population. In fact, Klein et al. (2018) indicates in a study that the daily dosage per person has increased by 65% in India and 70% in China since 2000. If other countries follow this path, the researchers pointed out that global antibiotic use could reach 125 billion doses per year, up from 42 billion in 2015. In a recent study, antibiotic use increased 65%, and antibiotic consumption rate increased 39% [Citation17]. Thus, education and awareness about self-medication play an important factor in the establishment and removal of resistant strains from the community, and the public health community should focus on campaigning more awareness programmes in developing populations.
6. Discussion
The biological process of drug resistance in pathogens can be divided into two phases: i) the individual-level process is the emergence or appearance of resistant mutants in healthy individuals, and ii) the population-level phenomenon – the establishment of the pathogen [Citation78]. Thus, public health intervention should be a combination of both individual and population level.
The proliferation of resistance and its abundance in society is closely dependent on socioeconomic status, which is a composite measure that typically incorporates economic status (measured by income), social status (measured by awareness and education), and work status (measured by occupation) [Citation86]. In the current analysis, we hypothesize an exponential function to represent the reciprocal relation between socioeconomic status and self-medication in the population, and examine the impact of such factors on the emergence and extinction of resistance by developing a non-linear CTMC model integrating socioeconomic growth and antibiotic misuse. A multi-type branching process is considered to approximate the nonlinear CTMC and estimate the probability of disease outbreak or extinction ().
Both analytical derivation and numerical computation of the probabilities of extinction of resistance strains mirror each other for different initial sizes of infectives in the population. The results clearly indicate that the probability of eliminating resistance is high if initially fewer people are incurred with resistance as opposed to the situation where , initially, a large number of people are already infected with resistance strain. It will be difficult to control the situation, once resistance gets established in the population. The analysis also reveals that interventions to control the spread of resistance should be initiated at the beginning of the outbreak. The sensitivity analysis strongly depicts that public health authorities should focus on improvements in the cost of treatment and health facilities, putting control on overuse and misuse of antibiotics including OTC drug sales and increasing awareness programmes of antibiotic resistance among the common public. Knowledge and delving into the biology of antibiotic drug resistance have a significant impact on the implementation and development of policies regarding infection control [Citation87–89].
Estimating the epidemic threshold for the occurrence of a disease outbreak or extinction is an important issue in public health. This is especially true for drug resistance model integrating socioeconomic factors. Every country has its own economic constraints and epidemiological parameters behind the emergence and extinction of drug resistance in its population. Also, different pathogens may have different mechanisms of emergence and selection. Despite these, our stochastic model provides a framework to analyse the likelihood of extinction or establishment of a resistant pathogen depending on income, amount of drug use, epidemiological factors, and others. The PRCC analysis determines parameter dependencies on the probability of extinction of the resistant pathogens. In reality, the association between irrational antibiotic consumption and the socioeconomic growth of the population is more complex and nonlinear, and there is rarely any empirical contribution in support of this. So, we considered a simpler approach to illustrate the complex outcomes as emergent properties of the integrated model of emergence and establishment of drug resistance and socioeconomic factors of the population.
There are scopes to improve the current model and analysis. In reality, resistance may emerge and spread through other means like hospital infection or due to unhygienic conditions. Here, we have only considered antibiotic misuse. A detailed model may be developed to address questions on the emergence and extinction of drug resistance, possibly integrating individual and population-level dynamics of the emergence and establishment of the resistant pathogens. The reciprocal relation between income and antibiotic misuse may not always be true for any community. There are many socio-economic and policy-oriented factors that define the complex relation. One can use the same model framework and investigate the model outcome under different nonlinear relations of income and antibiotic usage through self-medications. Also, the incorporation of health risk behaviours, migration, and case importation in the model framework might increase the accuracy of predictions, which would provide insights into public health for combating resistance globally.
Acknowledgments
The authors thank the Science and Engineering Research Board (SERB), DST, India for financial support (ECR/2016/000591) to conduct this research. We thank Associated Editor and reviewers of the journal for useful comments to represent the materials better in the draft. We also thank the DST-FIST lab in SNIoE for facilitating the computational facilities required for this work.
Disclosure statement
No potential conflict of interest was reported by the author(s).
Additional information
Funding
References
- S.B. Levy and B. Marshall, Antibacterial resistance worldwide: Causes, challenges and responses, Nat. Med. 10 (S12) (2004), pp. S122. doi:10.1038/nm1145.
- F. Luciani, S.A. Sisson, H. Jiang, A.R. Francis, and M.M. Tanaka, The epidemiological fitness cost of drug resistance in mycobacterium tuberculosis, Proceedings of the National Academy of Sciences 106 (2009), pp. 14711–14715.
- P.R. Donald and P.D. Van Helden, The global burden of tuberculosis — combating drug resistance in difficult times, N. Engl. J. Med. 360 (23) (2009), pp. 2393–2395. doi:10.1056/NEJMp0903806.
- A. San Millan, Evolution of plasmid-mediated antibiotic resistance in the clinical context, Trends Microbiol. 26 (12) (2018), pp. 978–985. doi:10.1016/j.tim.2018.06.007.
- J. Davies and D. Davies, Origins and evolution of antibiotic resistance, Microbiol. Mol. Biol. R. 74 (3) (2010), pp. 417–433. doi:10.1128/MMBR.00016-10.
- M.N. Alekshun and S.B. Levy, Molecular mechanisms of antibacterial multidrug resistance, Cell 128 (6) (2007), pp. 1037–1050. doi:10.1016/j.cell.2007.03.004.
- H.H. Chang, T. Cohen, Y.H. Grad, W.P. Hanage, T.F. O’Brien, and M. Lipsitch, Origin and proliferation of multiple-drug resistance in bacterial pathogens, Microbiol. Mol. Biol. Rev. 79 (1) (2015), pp. 101–116. doi:10.1128/MMBR.00039-14.
- H.R. van Doorn, E.C. Claas, K.E. Templeton, A.G. van der Zanden, A. Te Koppele Vije, M.D. de Jong, J. Dankert, and E.J. Kuijper, Detection of a point mutation associated with high-level isoniazid resistance in mycobacterium tuberculosis by using real-time PCR technology with 3′-minor groove binder-DNA probes, J. Clin. Microbiol. 41 (10) (2003), pp. 4630–4635. doi:10.1128/JCM.41.10.4630-4635.2003.
- M.M. Tanaka, C.T. Bergstrom, and B.R. Levin, The evolution of mutator genes in bacterial populations: The roles of environmental change and timing, Genetics 164 (3) (2003), pp. 843–854. doi:10.1093/genetics/164.3.843.
- R.M. Ribeiro, S. Bonhoeffer, and M.A. Nowak, The frequency of resistant mutant virus before antiviral therapy, Aids 12 (5) (1998), pp. 461–465. doi:10.1097/00002030-199805000-00006.
- M.G. Pinho, Mechanisms of beta-lactam and glycopeptide resistance in staphylococcus aureus, S. Mol. Gen 3 (2008), pp. 207–226.
- L.M. Weigel, D.B. Clewell, S.R. Gill, N.C. Clark, L.K. McDougal, S.E. Flannagan, J.F. Kolonay, J. Shetty, G.E. Killgore, and F.C. Tenover, Genetic analysis of a high-level vancomycin-resistant isolate of staphylococcus aureus, Science 302 (5650) (2003), pp. 1569–1571. doi:10.1126/science.1090956.
- B. Levin, M. Lipsitch, V. Perrot, S. Schrag, R. Antia, L. Simonsen, N. Moore Walker, and F. Stewart, The population genetics of antibiotic resistance, Clin. Infect. Dis. 24 (Supplement_1) (1997), pp. S9–S16. doi:10.1093/clinids/24.Supplement_1.S9.
- P.J. Johnsen, J.P. Townsend, T. Bøhn, G.S. Simonsen, A. Sundsfjord, and K.M. Nielsen, Factors affecting the reversal of antimicrobial-drug resistance, Lancet. Infect Dis 9 (6) (2009), pp. 357–364. doi:10.1016/S1473-3099(09)70105-7.
- B. Malik and S. Bhattacharyya, Antibiotic drug-resistance as a complex system driven by socio-economic growth and antibiotic misuse, Sci. Rep 9 (1) (2019), pp. 9788. doi:10.1038/s41598-019-46078-y.
- S. Gandra, D. Barter, and R. Laxminarayan, Economic burden of antibiotic resistance: How much do we really know?, Clin. Microbiol. Infect 20 (10) (2014), pp. 973–980. doi:10.1111/1469-0691.12798.
- E.Y. Klein, T.P.V. Boeckel, E.M. Martinez, S. Pant, S. Gandra, S.A. Levin, H. Goossens, and R. Laxminarayan, Global increase and geographic convergence in antibiotic consumption between 2000 and 2015, Proceedings of the National Academy of Sciences 115 (2018), pp. E3463–E3470.
- O.B. Jonas, A. Irwin, F.C.J. Berthe, F.G. Le Gall, and P.V. Marquez, Drug-resistant infections: A threat to our economic future, Final Report, HNP/Agri. Glob. Anti. micro. Res. Initiative vol. 2 (2017).
- N. Torres, B. Chibi, L. Middleton, V. Solomon, and T. Mashamba-Thompson, Evidence of factors influencing self-medication with antibiotics in low and middle-income countries: A systematic scoping review, Public Health 168 (2019), pp. 92–101. doi:10.1016/j.puhe.2018.11.018.
- J.E. McGowan, Economic impact of antimicrobial resistance, Emerging Infect. Dis. 7 (2) (2001), pp. 286. doi:10.3201/eid0702.010228.
- G. Nepal and S. Bhatta, Self-medication with antibiotics in who southeast asian region: A systematic review, Cureus 10 (2018). doi:10.7759/cureus.2428.
- S. Biswas, A. Ghosh, K. Mondal, S. Dalui, M. Haldar, and S. Biswas, Self-medication with antibiotics among undergraduate nursing students of a government medical college in eastern india, IJPR 5 (2015), pp. 239–243.
- N. Ganesan, S. Subramanian, R.H. Jaikumar, and S. Kumar, Self-medication and indiscriminate use of antibiotics without prescription in Chennai, India: A major public health problem, J. Pharm. Sci. 1 (2014), pp. 130–141.
- A. Nair, M.K. Doibale, S.K. Kulkarni, V.K. Domple, P.S. Rajput, and A.D. Shingare, Pattern of self-medication with antibiotics among undergraduate medical students of a government medical college, Int. J. Preven Public Health Sci. 1 (2015), pp. 9–13.
- B. Pal, K. Murti, A. Gupta, U. Choudhury, M. Rastogi, H. Pandey, C.S. Lal, K. Pandey, and P. Das, et al., Self medication with antibiotics among medical and pharmacy students in north india, Curr. Res.Med. 7 (2) (2016), pp. 7–12. doi:10.3844/amjsp.2016.7.12.
- R. Shubha, M.K. Savkar, and G. Manjunath, Self medication pattern among dentists with antibiotics, J. Evol. Med. Dent. Sci. 2 (46) (2013), pp. 9037–9041. doi:10.14260/jemds/1567.
- S. Virmani, M. Nandigam, B. Kapoor, P. Makhija, and S. Nair, Antibiotic use among health science students in an Indian university: A cross sectional study, Clin. Epidemiol Glob. Health. 5 (4) (2017), pp. 176–179. doi:10.1016/j.cegh.2017.04.005.
- U. Hadi, D.O. Duerink, E.S. Lestari, N.J. Nagelkerke, S. Werter, M. Keuter, E. Suwandojo, E. Rahardjo, P. van den Broek, and I.C. Gyssens, Survey of antibiotic use of individuals visiting public healthcare facilities in indonesia, Int J Infect. Dis. 12 (2008), pp. 622–629. doi:10.1016/j.ijid.2008.01.002.
- K. Kurniawan, J. Posangi, and N. Rampengan, Association between public knowledge regarding antibiotics and self-medication with antibiotics in teling atas community health center, east indonesia, Med. J. Indones. 26 (1) (2017), pp. 62–69. doi:10.13181/mji.v26i1.1589.
- A. Widayati, S. Suryawati, C. de Crespigny, and J.E. Hiller, Self medication with antibiotics in yogyakarta city Indonesia: A cross sectional population-based survey, BMC Res. Notes 4 (1) (2011), pp. 1–8. doi:10.1186/1756-0500-4-491.
- S.S. Kim, S. Moon, and E.J. Kim, Public knowledge and attitudes regarding antibiotic use in south korea, J. Korean Acad. Nurs 41 (6) (2011), pp. 742–749. doi:10.4040/jkan.2011.41.6.742.
- I. Banerjee, B. Sathian, R.K. Gupta, A. Amarendra, B. Roy, P. Bakthavatchalam, A. Saha, and I. Banerjee, Self-medication practice among preclinical university students in a medical school from the city of pokhara, nepal, Nepal J. Epidemiol. 6 (2) (2016), pp. 574. doi:10.3126/nje.v6i2.15165.
- N. Pant, R. Sagtani, M. Pradhan, A. Bhattarai, and A. Sagtani, Self-medication with antibiotics among dental students of Kathmandu-prevalence and practice, Nepal Med. Coll. J 17 (2015), pp. 47–53.
- A.K. Sah, R.K. Jha, and D. Shah, Self-medication with antibiotics among nursing students of nepal, IJPSR 7 (2016), pp. 427–430.
- D. Rathish, B. Wijerathne, S. Bandara, S. Piumanthi, C. Senevirathna, C. Jayasumana, and S. Siribaddana, Pharmacology education and antibiotic self-medication among medical students: A cross-sectional study, BMC Res. Notes 10 (1) (2017), pp. 1–5. doi:10.1186/s13104-017-2688-4.
- K. Sirijoti, P. Hongsranagon, P. Havanond, and W. Pannoi, Assessment of knowledge attitudes and practices regarding antibiotic use in trang province, thailand, J. Health Res. 28 (2014), pp. 299–307.
- M. Biswas, M.N. Roy, M.I.N. Manik, M.S. Hossain, S.T.A. Tapu, M. Moniruzzaman, and S. Sultana, Self medicated antibiotics in Bangladesh: A cross-sectional health survey conducted in the Rajshahi city, BMC. Public Health 14 (1) (2014), pp. 1–7. doi:10.1186/1471-2458-14-847.
- M. Seam, O. Reza, R. Bhatta, B.L. Saha, A. Das, M. Hossain, S. Uddin, P. Karmakar, and M. Choudhuri, et al., Assessing the perceptions and practice of self-medication among bangladeshi undergraduate pharmacy students, Pharmacy 6 (1) (2018), pp. 6. doi:10.3390/pharmacy6010006.
- T. Tshokey, D. Adhikari, T. Tshering, S. Wangmo, and K. Wangdi, Assessing the knowledge, attitudes, and practices on antibiotics among the general public attending the outpatient pharmacy units of hospitals in Bhutan: A cross-sectional survey, Asia Pac. J. Public Health 29 (7) (2017), pp. 580–588. doi:10.1177/1010539517734682.
- ] L.J. Allen, An Introduction to Stochastic Processes with Applications to Biology, Chapman and Hall/CRC, 2010. 10.1201/b12537
- O.A. Van Herwaarden and J. Grasman, Stochastic epidemics: Major outbreaks and the duration of the endemic period, J. Math Biol. 33 (6) (1995), pp. 581–601. doi:10.1007/BF00298644.
- L.J. Allen and G.E. Lahodny Jr, Extinction thresholds in deterministic and stochastic epidemic models, J Biol Dyn 6 (2) (2012), pp. 590–611. doi:10.1080/17513758.2012.665502.
- D. Ludwig, Persistence of dynamical systems under random perturbations, Siam Rev. 17 (4) (1975), pp. 605–640. doi:10.1137/1017070.
- D.G. Kendall, Deterministic and stochastic epidemics in closed populations, in Proc. 3rd Berkeley symp, Math. Statist. Prob 4 (1956), pp. 149–165.
- F. Ball, D. Mollison, and G. Scalia-Tomba, Epidemics with two levels of mixing, Ann. Appl. Probab 7 (1) (1997), pp. 46–89. doi:10.1214/aoap/1034625252.
- L.J. Allen and P. van den Driessche, Relations between deterministic and stochastic thresholds for disease extinction in continuous-and discrete-time infectious disease models, Math. Bio. sci 243 (1) (2013), pp. 99–108. doi:10.1016/j.mbs.2013.02.006.
- S. Karlin, A First Course in Stochastic Processes, Academic press, 2014. San Deigo, CA.
- F. Brauer, An introduction to networks in epidemic modeling, in Mathematical Epidemiology, Springer Berlin Heidelberg, 2008, pp. 133–146. 10.1007/978-3-540-78911-6_4
- M.E. Newman, Spread of epidemic disease on networks, Phys. Rev. E 66 (1) (2002), pp. 016128. doi:10.1103/PhysRevE.66.016128.
- D. Balcan and A. Vespignani, Invasion threshold in structured populations with recurrent mobility patterns, J. Theor. Biol. 293 (2012), pp. 87–100. doi:10.1016/j.jtbi.2011.10.010.
- J. Robinson, The production function and the theory of capital, Rev. Econ. Stud 21 (2) (1953), pp. 81–106. doi:10.2307/2296002.
- D.J. Hodges, A note on estimation of cobb-Douglas and ces production function models, Econ.: J. Econ. Soc. 37 (4) (1969), pp. 721–725. doi:10.2307/1910448.
- B. Godman, F. Acurcio, and A. Guerra Júnior, et al., Initiatives among authorities to improve the quality and efficiency of prescribing and the implications, J. Pharma. Care Health Sys 1 (3) (2014), pp. 1–15. doi:10.4172/2376-0419.1000113.
- F. Islahudin, A.M.A. Tamezi, and N.M. Shah, Knowledge, attitudes and practices about antibiotic use among the general public in malaysia, Southeast Asian J. Trop. Med. Public Health 45 (2014), pp. 1474.
- M. Ocan, E.A. Obuku, F. Bwanga, D. Akena, S. Richard, J. Ogwal-Okeng, and C. Obua, Household antimicrobial self-medication: A systematic review and meta-analysis of the burden, risk factors and outcomes in developing countries, BMC. Public Health 15 (1) (2015), pp. 742. doi:10.1186/s12889-015-2109-3.
- L. Grigoryan, F.M. Haaijer-Ruskamp, J.G. Burgerhof, R. Mechtler, R. Deschepper, A. Tambic-Andrasevic, R. Andrajati, D.L. Monnet, R. Cunney, and A.D. Matteo, et al., Self-medication with antimicrobial drugs in europe, Emerging Infect. Dis. 12 (3) (2006), pp. 452. doi:10.3201/eid1203.050992.
- E. Gebeyehu, L. Bantie, M. Azage, and M. Ciccozzi, Inappropriate use of antibiotics and its associated factors among urban and rural communities of Bahir Dar city administration, northwest ethiopia, PLoS One 10 (9) (2015), pp. e0138179. doi:10.1371/journal.pone.0138179.
- M.N. İ̇̇lhan, E. Durukan, S.Ö. Ilhan, F.N. Aksakal, S. Özkan, and M.A. Bumin, Self-medication with antibiotics: Questionnaire survey among primary care center attendants, Pharmacoepidemiol Drug Saf 18 (12) (2009), pp. 1150–1157. doi:10.1002/pds.1829.
- B. Malik, H. Hasan Farooqui, and S. Bhattacharyya, Disparity in socio-economic status explains the pattern of self-medication of antibiotics in India: Understanding from game-theoretic perspective, R. Soc. Open Sci. 9 (2) (2022), pp. 211872. doi:10.1098/rsos.211872.
- M.H. Bonds, D.C. Keenan, P. Rohani, and J.D. Sachs, Poverty trap formed by the ecology of infectious diseases, Proceedings of the Royal Society B: Biological Sciences 277 (2009), pp. 1185–1192.
- C.N. Ngonghala, M.M. Pluciński, M.B. Murray, P.E. Farmer, C.B. Barrett, D.C. Keenan, and M.H. Bonds, Poverty, disease, and the ecology of complex systems, PLoS Biol. 12 (4) (2014), pp. e1001827. doi:10.1371/journal.pbio.1001827.
- M.H. Bonds, A.P. Dobson, D.C. Keenan, and M.E. Hochberg, Disease ecology, biodiversity, and the latitudinal gradient in income, PLoS Biol. 10 (12) (2012), pp. e1001456. doi:10.1371/journal.pbio.1001456.
- Y. Luo, S. Tang, Z. Teng, and L. Zhang, Global dynamics in a reaction–diffusion multi-group sir epidemic model with nonlinear incidence, Nonlinear Anal Real World Appl 50 (2019), pp. 365–385. doi:10.1016/j.nonrwa.2019.05.008.
- S. Rushton and A. Mautner, The deterministic model of a simple epidemic for more than one community, Biometrika 42 (1–2) (1955), pp. 126–136. doi:10.1093/biomet/42.1-2.126.
- A. Nold, Heterogeneity in disease-transmission modeling, Math. Biosci 52 (3–4) (1980), pp. 227–240. doi:10.1016/0025-5564(80)90069-3.
- H.W. Hethcote and H.R. Thieme, Stability of the endemic equilibrium in epidemic models with subpopulations, Math. Biosci 75 (2) (1985), pp. 205–227. doi:10.1016/0025-5564(85)90038-0.
- J.M. Heffernan, R.J. Smith, and L.M. Wahl, Perspectives on the basic reproductive ratio, J. R. Soc. Interface 2 (4) (2005), pp. 281–293. doi:10.1098/rsif.2005.0042.
- G.E. Lahodny and L.J. Allen, Probability of a disease outbreak in stochastic multipatch epidemic models, Bull. Math. Biol. 75 (7) (2013), pp. 1157–1180. doi:10.1007/s11538-013-9848-z.
- L. G Jr, R. Gautam, and R. Ivanek, Estimating the probability of an extinction or major outbreak for an environmentally transmitted infectious disease, J. Biol. Dyn 9 (sup1) (2015), pp. 128–155. doi:10.1080/17513758.2014.954763.
- D.T. Gillespie, Approximate accelerated stochastic simulation of chemically reacting systems, J. Chem. Phys. 115 (4) (2001), pp. 1716–1733. doi:10.1063/1.1378322.
- I. Soumpasis and F. Butler, A comparison of deterministic and stochastic epidemic models for the risk assessment of salmonella at the preharvest level of pork production, FOODSIM 2008 Proceedings (2008).
- M.J. Keeling and P. Rohani, Modeling Infectious Diseases in Humans and Animals, Princeton University Press, 2011.
- H.H. Farooqui, S. Selvaraj, A. Mehta, D.L. Heymann, and A.C. Singer, Community level antibiotic utilization in India and its comparison vis-à-vis European countries: Evidence from pharmaceutical sales data, PLoS One 13 (10) (2018), pp. e0204805. doi:10.1371/journal.pone.0204805.
- X. Chen and F. Fu, Social learning of prescribing behavior can promote population optimum of antibiotic use, Aip. Conf. Proc. 6 (2018), pp. 139. doi:10.3389/fphy.2018.00139.
- D. Austin, M. Kakehashi, and R. Anderson, The transmission dynamics of antibiotic–resistant bacteria: The relationship between resistance in commensal organisms and antibiotic consumption, Proceedings of the Royal Society of London. Series B: Biological Sciences 264 (1997), pp. 1629–1638.
- M. Subbiah, E.M. Top, D.H. Shah, and D.R. Call, Selection pressure required for long-term persistence of bla cmy-2-positive inca/c plasmids, Appl. Environ. Microb. 77 (13) (2011), pp. 4486–4493. doi:10.1128/AEM.02788-10.
- V.V. Volkova, C. Lanzas, Z. Lu, Y.T. Gröhn, and M.G. Roberts, Mathematical model of plasmid-mediated resistance to ceftiofur in commensal enteric Escherichia coli of cattle, PLoS One 7 (5) (2012), pp. e36738. doi:10.1371/journal.pone.0036738.
- P.A. zur Wiesch, R. Kouyos, J. Engelstädter, R.R. Regoes, and S. Bonhoeffer, Population biological principles of drug-resistance evolution in infectious diseases, Lancet. Infect. Dis 11 (3) (2011), pp. 236–247. doi:10.1016/S1473-3099(10)70264-4.
- M. Besnard, S. Lastere, A. Teissier, V. Cao-Lormeau, and D. Musso, Evidence of perinatal transmission of zika virus, French Polynesia, December 2013 and February 2014, Eurosurveillance 19 (13) (2014), pp. 20751. doi:10.2807/1560-7917.ES2014.19.13.20751.
- S. Marino, I.B. Hogue, C.J. Ray, and D.E. Kirschner, A methodology for performing global uncertainty and sensitivity analysis in systems biology, J. Theor. Biol. 254 (1) (2008), pp. 178–196. doi:10.1016/j.jtbi.2008.04.011.
- M.D. McKay, R.J. Beckman, and W.J. Conover, A comparison of three methods for selecting values of input variables in the analysis of output from a computer code, Technometrics 42 (1) (2000), pp. 55–61. doi:10.1080/00401706.2000.10485979.
- M.A. Sanchez and S.M. Blower, Uncertainty and sensitivity analysis of the basic reproductive rate: Tuberculosis as an example, Am. J. Epidemiol. 145 (12) (1997), pp. 1127–1137. doi:10.1093/oxfordjournals.aje.a009076.
- J. Chastre, M. Wolff, J.Y. Fagon, S. Chevret, F. Thomas, D. Wermert, E. Clementi, J. Gonzalez, D. Jusserand, and P. Asfaret al., Comparison of 8 vs 15 days of antibiotic therapy for ventilator-associated pneumonia in adults: A randomized trial, Jama 290 (19) (2003), pp. 2588–2598. doi:10.1001/jama.290.19.2588.
- A.F. Read and R.J. Woods, Antibiotic resistance management, Evol. Med. Public Health 2014 2014 (1) (2014), pp. 147. doi:10.1093/emph/eou024.
- M. Kolář, K. Urbánek, and T. Látal, Antibiotic selective pressure and development of bacterial resistance, Int. J. Antimicrob. Agents 17 (5) (2001), pp. 357–363. doi:10.1016/S0924-8579(01)00317-X.
- D.B. Dutton and S. Levine, Overview, methodological critique, and reformulation, Pathways To Health (1989), pp. 29–69.
- S.B. Levy, Balancing the drug-resistance equation, Trends Microbiol. 2 (10) (1994), pp. 341–342. doi:10.1016/0966-842X(94)90607-6.
- R.J. Williams and D.L. Heymann, Containment of antibiotic resistance, Science 279 (5354) (1998), pp. 1153–1154. doi:10.1126/science.279.5354.1153.
- B.G. Spratt, Antibiotic resistance: Counting the cost, Curr. Biol. 6 (10) (1996), pp. 1219–1221. doi:10.1016/S0960-9822(96)00700-2.
- J. Heesterbeek and K. Dietz, The concept of ro in epidemic theory, Stat. Neerl 50 (1) (1996), pp. 89–110. doi:10.1111/j.1467-9574.1996.tb01482.x.
- O. Diekmann and J.A.P. Heesterbeek, Mathematical Epidemiology of Infectious Diseases: Model Building, Analysis and Interpretation, Vol. 5, John Wiley & Sons, 2000. Great Britain
- T.C. Porco and S.M. Blower, HIV vaccines: The effect of the mode of action on the coexistence of HIV subtypes, Math. Popul. Stud 8 (2) (2000), pp. 205–229. doi:10.1080/08898480009525481.
- C. Castillo-Chavez, S. Blower, P. Van den Driessche, D. Kirschner, A.A. Yakubu, and C. Castillo-Chavez, Mathematical Approaches for Emerging and Reemerging Infectious Diseases: Models, Methods, and Theory, Vol. 126, Springer Science & Business Media, 2002. 10.1007/978-1-4613-0065-6
- A.N. Hill and I.M. Longini Jr, The critical vaccination fraction for heterogeneous epidemic models, Math. Biosci 181 (2003), pp. 85–106. doi:10.1016/S0025-5564(02)00129-3.
Appendix A
A1. Next-generation matrix
The basic reproductive number, is the most important metric in disease modelling, and one of the most valuable ideas that mathematical thinking has brought to epidemic theory [Citation67,Citation90]. The magnitude of
is used to measure the risk of an epidemic in emerging infectious diseases. It is defined as the expected number of secondary cases produced by a single infection in a totally susceptible population. The next-generation approach is a more general method of computing
for SIR-type extended models [Citation64–66]. In next-generation method,
is defined as the spectral radius of the ‘next-generation operator’ [Citation67].
Consider there are compartments out of which
are infected. Define the vector
, where
denotes the number or proportion of individuals in the
compartment. Let
be the rate of appearance of new infections in compartment
and let
, where
is the rate of transfer of individuals into compartment
by all other means and
is the rate of transfer of individuals out of
compartment. The difference
, gives the rate of change of
.
include infections that are newly arising, but does not include terms which describe transfer of infectious individuals from one infected compartment to other.
denotes transfers of infections from one compartment to another. We can form the next generation matrix
from matrices of partial derivatives of
and
.
and
where is the disease-free equilibrium. The entries of
give the rate at which infected individuals in
produce new infections in
, times the average length of time an individual spends in a single visit to compartment
.
is given by the spectral radius (dominant eigenvalue) of the matrix
[Citation91–94].
A2. Computation of pgfs for the drug-resistance model
Let time be continuous, and let
,
,
,
, represent discrete random variables for the number of susceptibles with antibiotics, the number of infected individuals with sensitive strain and resistant strain, respectively. We consider a small population, such that all variables are bounded.
Since and
are the only variables that are directly responsible for the emergence of resistance in the community, we apply the multi-type branching process and compute pgfs for these two variables.
The offspring pgf for given
and
is given by:
To describe the probabilities in the calculation above, one individual with sensitive strain dies or is removed with probability , this means an individual with sensitive strain dies or is removed before infecting with resistance strain. The
giving birth to
with probability
. This means that an individual with a sensitive strain infects another individual with a sensitive strain which results in
. The term
means an individual with a sensitive strain produces two individuals with sensitive strains. A single
gives birth to a single individual with resistance with probability
.
Similarly, the pgf for , given
and
For , one individual with resistant strain dies or is removed with probability
. An individual with a resistant strain infects another individual with the resistant strain which results in
with probability
. The term
means an individual with resistant strain produces two individuals.
A3. Jury condition and computation of extinction probability
Proposition.
A non-negative square matrix A of order is irreducible
, where I is n
n identity matrix and
stands element wise larger than.
Since the off-spring pgf is non-singular or not simple and the expectation matrix is irreducible, then there are at most two fixed points in [0,1]
[0,1]. The probability of disease extinction or persistence depends on the size of the spectral radius of matrix
,
. The branching process is called subcritical, critical or supercritical if
,
or
respectively. We are interested in a parameter regime of our model, where it is supercritical and we have nontrivial probabilities of disease extinction. Below, we use the Jury condition to determine the supercritical parameter regime.
(1) If or
then (1,1) is only fixed point of the system and the probability of disease extinction is 1.
Jury conditions: The necessary and sufficient condition for a real 2 2 matrix A to have eigenvalue with modulus less than 1 is
The 2 2 matrix
satisfies
jury conditions hold.
Now,
(a) The inequality , which gives
(b) The inequality implies
which finally shows,
So, assuming our parameters are in the complement of this regime given by Equationequations (12)(12)
(12) and (Equation13
(13)
(13) ), we have the following:
(2) and there exists a unique second fixed point
, which determines the existence or persistence of disease.
Considering gives
Similarly, gives
Thus, the probability of extinction of the resistant strain with the initial condition is given by:
Figure E1. Plots of the antibiotic use (left panel) and resistance prevalence (right panel) for different antibiotics. These data are for some of the representative developing nations which compares the antibiotic use and level of resistance corresponding to certain selected antibiotics. The time series shows that the increment in antibiotics use over the years increases continuously, which increases the resistance level in these nations over the years.
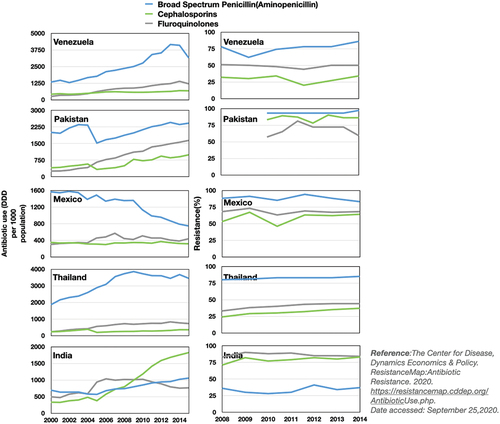
Figure E2. SMA prevalence in different countries: India (blue, 1–7 [Citation22–27]), Indonesia (cyan, 8–10 [Citation28–30]), Korea (green, 11 [Citation31]), Nepal (grey, 12–14 [Citation32–34]), Sri Lanka (black, 15 [Citation35]), Thailand (maroon, 16 [Citation36]), Bangladesh (purple, 17–18 [Citation37,Citation38]), Bhutan (yellow, 19 [Citation39]). Data obtained from [Citation21].
![Figure E2. SMA prevalence in different countries: India (blue, 1–7 [Citation22–27]), Indonesia (cyan, 8–10 [Citation28–30]), Korea (green, 11 [Citation31]), Nepal (grey, 12–14 [Citation32–34]), Sri Lanka (black, 15 [Citation35]), Thailand (maroon, 16 [Citation36]), Bangladesh (purple, 17–18 [Citation37,Citation38]), Bhutan (yellow, 19 [Citation39]). Data obtained from [Citation21].](/cms/asset/832241b9-6dfc-458a-a554-b5ce19645f1c/nmcm_a_2244175_f0008_oc.jpg)
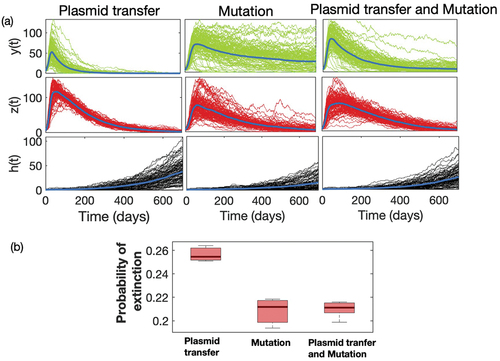
Figure E3. (a) Time series of sensitive strain (Green) and resistant strain
(Red) and income
(Grey) under different mechanistic process of emergence: mutation, plasmid transfer, and both mutation and plasmid transfer. (b) Box plot of probability of extinction of resistant strain
under different process.