
 ?Mathematical formulae have been encoded as MathML and are displayed in this HTML version using MathJax in order to improve their display. Uncheck the box to turn MathJax off. This feature requires Javascript. Click on a formula to zoom.
ABSTRACT
Despite the increased research interest in wayfinding assistance systems, research on the appropriate point in time or space to automatically present a route instruction remains a desideratum. We address this research gap by reporting on the results of an outdoor, within-subject design wayfinding study (). Participants walked two different routes for which they requested spoken, landmark-based turn-by-turn route instructions. By means of a survival analysis, we model the points in space at which participants issue such requests, considering personal, environmental, route- and trial-related variables. We reveal different landcover classes (e.g., densely built-up areas) and personal variables (e.g., egocentric orientation and age) to be important, discuss potential reasons for their impact and derive open research questions.
1. Introduction
Navigation is an intrinsically complex task, during which “[the] navigator is continuously busy in a sequential process of decision making whose essence is to match internal with external information as it comes” (Stern & Portugali, Citation1999, p. 99). Given this complexity, research on decreasing the cognitive load of pedestrian wayfinders by means of mobile assistance systems has seen much interest for more than 15 years (see, e.g., Coors, Elting, Kray & Laakso, Citation2005; Geldof & Dale, Citation2002; Millonig & Schechtner, Citation2007, for early attempts). However, almost all of these studies neglect the problem of timing to present route instructions: Users of wayfinding assistance systems are supposed to either choose the suitable point in time themselves or, as is the case for commercial systems, route instructions are given based on distance-based algorithmic approaches ignoring personal characteristics. This system behavior, however, is likely to result in increased cognitive load (see, e.g., Winter, Citation2003). The present paper reports on the first outdoor in-situ study designed to understand the points in time/space at which pedestrians (which is, arguably, the most frequently used navigation modality) would actually need spoken, landmark-based, turn-by-turn route instructions. By identifying influential variables and their effect, we contribute to a deeper understanding of wayfinding behavior with respect to preferred timing of the presentation of route instructions. In doing so, we use Giannopoulos, Jonietz, Raubal, Sarlas and Stähli (Citation2017) as a starting point of our study, as they present the first in-depth study of timing for pedestrian navigation systems in a virtual environment: We adapt the empirical setup to the in-situ nature of our study in order to increase ecological validity and take the opportunity to consider an increased number of variables relating to personal, route-related and environmental factors (see Section 3 for a rationale). We have, however, chosen to apply the same data analysis method as Giannopoulos et al. did: They utilized a time-to-event model, which is suitable to address the problem of predicting when a system should automatically present navigation instructions. At the same time, it is not a so-called black-box as, e.g., many machine learning approaches would have been.
2. Related Work
According to Montello (Citation2005), navigation comprises two activities, namely wayfinding and locomotion. While locomotion describes the movement of one’s body through the environment and includes tasks like avoiding obstacles, wayfinding encompasses route planning and all related decision-making processes to reach a given destination. During navigation, we constantly receive sensory information about our physical environment and need to connect it with our knowledge to update our location and determine future decisions along our route (see Stern & Portugali, Citation1999, p. 99). Theoretical reasoning and empirical evidence (see, e.g., Fang, Li & Shaw, Citation2015; Giannopoulos, Kiefer, Raubal, Richter & Thrash, Citation2014; Schmidt, Beigl & Gellersen, Citation1999), therefore, suggest that a wayfinder’s cognitive load is impacted by personal characteristics, the environment and the actual route through this environment. Reducing the cognitive load of users is, hence, one of the major aims in designing wayfinding assistance systems (not only) for pedestrians. Scholars have pursued this objective by means of working (1) on the content, structure and presentation of route instructions and (2) on the adaptation of wayfinding systems to the user’s personal needs. In this section, we review both strands of prior work and, thereby, provide evidence for a lack of research on the timing of route instructions, in particular for pedestrian navigation systems.
2.1. Research on route instructions
Researchers have put emphasis on understanding the way humans communicate route instructions in order to mimic this process in wayfinding assistance systems for pedestrians over many years. Research on verbal human-to-human communication of route instructions and it’s underlying cognitive processes (see, e.g., Hölscher, Tenbrink & Wiener, Citation2011) revealed that landmarks are used frequently (see, e.g., Lovelace, Hegarty & Montello, Citation1999; May, Ross, Bayer & Tarkiainen, Citation2003; Michon & Denis, Citation2001) across different spatial environments (see, e.g., Sarjakoski et al., Citation2013, for hiking instructions). Empirical evidence has been provided that the use of landmarks has a positive impact on wayfinding performance (see, e.g., Ross, May & Thompson, Citation2004; Tom & Denis, Citation2004) and that the absence of landmarks in an environment is compensated by an increased granularity in verbal human-to-human route instructions (see Hirtle, Richter, Srinivas & Firth, Citation2010). Research on incorporating landmarks (see Richter & Winter, Citation2014, for a thorough overview of the concept) in route instructions for wayfinding assistance systems has, consequently, become a predominant research topic, including modeling (see, e.g., Caduff & Timpf, Citation2008; Nothegger, Winter & Raubal, Citation2004; Nuhn & Timpf, Citation2017; Raubal & Winter, Citation2002; Winter, Citation2003), empirical assessment (see, e.g., Götze & Boye, Citation2016; Kattenbeck, Citation2017; Kattenbeck, Nuhn & Timpf, Citation2018; Quesnot & Roche, Citation2015) of salience and the automatic selection of landmarks (see, e.g., Duckham, Winter & Robinson, Citation2010; Lander, Herbig, Löchtefeld, Wiehr & Krüger, Citation2017; Lazem & Sheta, Citation2005; Rousell & Zipf, Citation2017; Wang & Ishikawa, Citation2018).
Beyond the focus on important elements in human-to-human route instructions, researchers have worked on the formulation of route instructions in wayfinding assistance systems for pedestrians. The concept of spatial chunking (Klippel, Tappe & Habel, Citation2002) has been of particular importance in these endeavors, as it reduces cognitive load in wayfinders by adapting the level of granularity in route instructions. This idea has been picked up algorithmically (see, e.g., Richter & Klippel, Citation2005) resulting in guidelines for cognitively ergonomic route directions (Klippel, Richter & Hansen, Citation2009) which take, e.g., different levels of hierarchical spatial knowledge into account. In line with these guidelines, empirical evidence also suggests that the granularity of route instructions increases in human-to-human route instructions if wayfinding decision situations lack landmarks (Hirtle et al., Citation2010). As the body of knowledge on adverse effects of wayfinding assistance systems on spatial knowledge acquisition grows (see, e.g., Ishikawa, Citation2019), scholars have also studied ways to overcome this issue. One very recent advancement in this domain is the so-called orientation instructions (Schwering, Krukar, Li, Anacta & Fuest, Citation2017) which enhance spatially chunked instructions by including additional environmental information to support acquisition of route and survey knowledge (see Krukar, Anacta & Schwering, Citation2020). Neither the research efforts on landmarks nor on formulating route instructions reflect on how the timing of a route instruction would impact these. This lack of consideration also holds true for research on modalities and presentation of route instructions. Beyond the prevalent map-based approaches, research on modalities and presentation modes has primarily focused on their impact on wayfinding effectiveness and efficiency by studying, for example augmented photographs (see, e.g., Walther-Franks & Malaka, Citation2008; Wang & Ishikawa, Citation2018), audio (see, e.g., Holland, Morse & Gedenryd, Citation2002), augmented reality (see, e.g., Rehrl, Häusler, Leitinger & Bell, Citation2014), vibro-tactile signals (see, e.g., Giannopoulos, Kiefer & Raubal, Citation2015) or music (see, e.g., Hazzard, Benford & Burnett, Citation2014). In addition to that, the studies on the presentation of instructions have also considered the reduction of attentional load (see, e.g., Stähli, Giannopoulos & Raubal, Citation2020, 2021) and effect on spatial knowledge acquisition (see, e.g., Brügger, Richter & Fabrikant, Citation2018).
2.2. Research on personalization of wayfinding assistance systems
Optimal wording, choosing the most suitable landmark among a set of candidates and the ideal presentation mode can, beyond general solutions, depend heavily on user characteristics. Personalization of wayfinding assistance systems for pedestrians has, consequently, seen increased interest. Empirical evidence has been collected for the increase in wayfinding performance through adaptation of, e.g., the presentation of route instructions to self-report sense of direction (see, e.g., Bienk, Kattenbeck, Ludwig, Müller & Ohm, Citation2013). Researchers (see, e.g., Klippel et al., Citation2009; Zimmer, Münzer & Baus, Citation2010) have also developed frameworks for the design of navigation aids emphasizing the adaption to user characteristics such as spatial abilities. Similarly, personal interests have been incorporated into salience models, in order to be exploited for choosing personalized landmarks (see Nuhn & Timpf, Citation2020). Moreover, a large branch of research is dedicated to adapting systems to users with special needs, such as mobility impaired people (see, e.g., Barhorst-Cates, Rand & Creem-Regehr, Citation2019; Cheraghi, Almadan & Namboodiri, Citation2019) or visually compromised persons (see, e.g., Ding et al., Citation2007; Völkel & Weber, Citation2008).
2.3. Timing
So far, we have seen considerable effort dedicated to optimizing wayfinding assistance systems for pedestrians with respect to the structure, granularity and presentation of route instructions, as well as adapting it to user’s personal preferences and needs. All of these research efforts, however, neglect – with exception of Giannopoulos et al. (Citation2017)– the key question of presenting a navigation instruction to a pedestrian at the right point in time. This is, on the one hand, in contrast to the attention timing has seen in research on car navigation systems (see below); on the other hand, it is also in contrast to other empirical findings (see, e.g., Brügger, Richter & Fabrikant, Citation2019, who provide strong evidence for the interaction between system behavior and wayfinder behavior) and theoretical claims. In their theoretical account based on Maslow’s theory, Fang et al. (Citation2015) emphasize the importance of including personal preferences in order to be able to predict user behavior and to make pedestrians feel more comfortable by adjusting navigational instructions to the dynamic change of environment. This hints toward the importance of research on which factors influence the preferred timing of navigational instructions based on a user’s personal preferences.
Despite the fact that timing of route instructions is a desideratum with respect to pedestrian wayfinding, it has seen much interest in car navigation systems. This fact is also stated by Giannopoulos et al. (Citation2017), who present the first study on the timing of pedestrian navigation instructions. As a starting point, the authors thoroughly reviewed literature on timing in car navigation systems and found several variables to be important: environmental factors (traffic, visibility of road signs), driver’s characteristics (age, gender), driving speed and attributes of the navigational instruction (length, upcoming turn/maneuver). Subsequently, the empirical part of their study, which was conducted in a virtual environment, found similar factors which influence user preferences in timing of pedestrian navigational instructions (see Giannopoulos et al., Citation2017, p. 16:9): These factors include personal characteristics like age and spatial abilities as well as route-specific aspects, such as the shape of the upcoming intersection, its visibility or the length of the route segment. The findings by Giannopoulos et al. are in line with empirical evidence that wayfinders make spatial decisions before they arrive at an intersection (see, e.g. Brunyé, Gardony, Holmes, & Taylor, Citation2018) and stress the impact of personal and spatial characteristics the environment has on the complexity of wayfinding decision situations (Giannopoulos et al., Citation2014).
3. Goal of study and variables used
The goal of the present study builds on these results: By means of an in-situ study, we investigate preferred timing of spoken, turn-by-turn, landmark-based route instructions based on personal, environmental, route- and trial-related characteristics used as explanatory variables. We, thereby, focus on modeling the first point in time after a turn at which wayfinders request a route instruction as this knowledge can be used, e.g., to minimize uncertainty and cognitive load by not delaying instructions, or to avoid disturbing the wayfinder by giving instructions too early. It is important to note that timing is understood positional throughout this study, i.e., we model the distance from the previous turning point to the location at which a route instruction was requested for the first time. Given the fact that prior evidence for preferred timing was hardly collected, we follow a primarily exploratory path of analysis. This means we tested variables for their impact on preferred timing, thereby covering personal, environmental and trial-related characteristics. We have deliberately chosen not to include the modality of the presented route instruction (e.g., pictorial, text-based etc.) as an exploratory variable for research economy reasons as this would have increased sample size demands considerably.
3.1. Personal variables
Our general aim was to include personal variables which are rather stable over time; this is reasonable, as a future assistance system exploiting our results should avoid to ask users for information frequently. We have, hence, decided to include age, gender, spatial strategies and personality (see Supplementary Material A for details). Numerous studies provided evidence that age (see, e.g., Kirasic, Citation2000; Taillade, N’Kaoua & Sauzéon, Citation2016) and gender (see, e.g., Coluccia & Louse, Citation2004, for a review of differences in wayfinding strategies between sexes) have an impact on wayfinding behavior. Similarly, spatial strategies were assessed as prior evidence indicating that cognitive styles impact wayfinding behavior (Brunyé et al., Citation2018; Nori, Palmiero, Bocchi, Giannini & Piccardi, Citation2020). We used the German language FRS scale (Münzer, Fehringer & Kühl, Citation2016; Münzer & Hölscher, Citation2011), which consists of three subscales: global/egocentric orientation, which reflects SOD according to Münzer et al. (Citation2016), allocentric orientation and knowledge about cardinal directions.
Personality has been assessed using the Big Five personality trait theory (Goldberg, Citation1990; John & Srivastava, Citation1999), which explains personality along the dimensions of openness, extraversion, neuroticism, agreeableness and conscientiousness. These personality traits have been influential in wayfinding studies (see, e.g., Bae & Montello, Citation2019). We used the short version of the Big-Five-Inventory (Rammstedt, Kemper, Klein, Beierlein & Kovaleva, Citation2012) in order to reduce experiment time. We expected that participants will behave differently based on their trait scores: For example, people scoring high on conscientiousness might request a route instruction earlier reflecting their tendency to be organized (see, e.g., Costa & McCrae, Citation2010, p. 245).
Finally, we also asked participants about the number of years they have been living in Vienna and their ability to find their way around the city. Both aspects may have an impact on timing due to the increased knowledge about the spatial layout of this particular urban environment in general.
3.2. Environmental variables
We included numerous environmental variables (see Supplementary Material A), thereby focusing on variables which can be computed with reduced computational effort from Volunteered Geographic Information (VGI, Goodchild, Citation2007) and further open source data.
3.2.1. Route-related variables
The group of route-related variables (named independent in the model by Giannopoulos et al., Citation2014) contains variables (see Supplementary Material A) which can be grouped into three broad categories. Geometry related features of intersections were retrieved from https://intersection.geo.tuwien.ac.at/ (see Fogliaroni, Bucher, Jankovic & Giannopoulos, Citation2018) or derived thereof. Considering these features is in line with prior evidence on the importance of the geometry for the complexity of wayfinding decision situations (see Giannopoulos et al., Citation2014). Distance related features include the overall route length, the lengths of the current and previous segment, and the distance between the previously passed turning point and the location from which a landmark/POI is visible along a segment between two subsequent turning points. The third group of variables relates to the sequence of segments along a given route.
3.2.2. Further Environmental variables
As mentioned above, we use auditory, landmark-based, turn-by-turn route instructions and exploit POI as a proxy (see Section 4.1.2) to choose salient features to be referenced (see, e.g., Duckham et al., Citation2010, for evidence that this is a reasonable approach). We have taken, consequently, the densities of POI and landcover classes along a route segment into account. We calculate POI densities based on OSM data for a variety of tags (e.g., amenity:restaurant, nature:tree) based on a buffer of drawn around a particular segment in order to capture all potentially visible objects along this route segment. In addition to that, we consider landcover classes based on Urban Atlas (European Comission, Citation2012) as these provide a proxy for important aspects of the spatial environment which may impact the comprehensibility of the route instruction. Based on the experimenter’s impression in-situ, we have chosen to calculate landcover shares using a
buffer around each route segment.
3.3. Trial-related variables
We considered trial duration, the weekday and the familiarity of a participant with the trial environment. The weekday may have an impact on timing as it may relate to different degrees of crowdedness (e.g., passersby may obscure a landmark referenced in a route instruction). Second, we included familiarity with the environment in which a route is located in for two reasons: Familiarity is generally agreed upon to have an effect on wayfinding behavior (see, e.g., Muffato & Meneghetti, Citation2020); moreover, empirical evidence suggests that spatial strategies and familiarity interact (Nori & Piccardi, Citation2011; Piccardi, Risetti & Nori, Citation2011).
4. Methods
This section provides a detailed account of the experimental design, the procedure of the outdoor study on which our work is based and the data analysis method used. It is important to note that the experiments were part of a larger data collection effort. We will, therefore, only explain those parts of the design and procedure that are needed to reproduce the results of this paper.
4.1. Materials
The entire experiment consisted of two parts: The first part contributed to the design of route instructions for the outdoor study and started simultaneously with the participant acquisition during March 2020; the second part was the outdoor study itself which took place between June and October 2020. Prior to participation in both parts of the study, participants provided their informed consent (this document was developed under the guidance of TU Wien’s officer for research ethics, Dr. Marjo Rauhala) and agreed to the data privacy statement of the Research Division Geoinformation of TU Wien.
4.1.1. Acquisition of routes
We collected routes for our study by means of an online questionnaire during which we also collected data on the personal variables (see Section 3.1). The procedure was mainly driven by the fact that the experiment was – beyond timing – designed to address research questions related to familiarity with the environment. Participants were asked to outline polygons in Vienna they are familiar with and to highlight and name places they know within these polygons. In order to ensure a reasonable experimental time, two of these places were randomly selected on the condition that they are between and
of walking distance apart. One of these places served as a starting point, the other one was set as the destination and these roles were randomly assigned. Subsequently, we asked participants to sketch the route they would choose between these two points using a polyline drawing tool. In order to collect familiar routes, we, subsequently, asked our participants to sketch their preferred route between these two places instead of using a representative route (see Mazurkiewicz, Kattenbeck, Kiefer & Giannopoulos, Citation2020) connecting these places.
4.1.2. Generating auditory route instructions
In order to design landmark-based route instructions, a systematic approach is followed using the algorithm described by Rousell and Zipf (Citation2017) to identify POI for each turning point (see Section 4.2 for a reason). In short, this algorithm, which is based on OSM data, considers all POIs and buildings located within a radius from the decision point as a potential landmark. Each of these candidate landmarks is assigned a suitability value which is calculated based on the object’s relative position to the decision point, its advance visibility, salience (generalized values between 0 and 1 for specific OSM tags) and the direction of travel. We implemented this algorithm using Python 3.8 (Van Rossum & Drake, Citation2009) and the OSMNX-library (Boeing, Citation2017) to retrieve building footprints and the street network. Subsequently, the experimenter visited each of the routes in person and checked the selected landmark for potential ambiguities. This in-situ check ensured the suitability of the suggested landmarks and helped to avoid confounding effects stemming from confusion due to the use of unsuitable objects in route instructions. The results of this in-situ check including reasons why landmarks were not used, are given in . The suggested landmark was adopted for 36.8% of all turning points. In 23.3% of the cases, however, no landmark was suggested at all due to the unavailability of POI or missing POI data. shows an example of a situation in which a potential ambiguity resulted based on the spatial layout (
), whereas is an example of salience overestimation due to the generalized salience values (
). Finally, at 11.4% of the turning points either the POI no longer exists or visibility calculation issues occurred (see Rousell & Zipf, Citation2017, for details on this problem).
Table 1. Actions taken based on the in-situ check of landmarks generated by the algorithm described by Rousell and Zipf (Citation2017)
Figure 1. Example of potential ambiguity. At the illustrated turning point (yellow circle), participants would have to make a left turn. The algorithm described by Rousell and Zipf (Citation2017) suggests to use the POI which is tagged with amenity:bank and named Erste Bank (green circle). Based on this, the route instruction would be (translated to English): Turn left at Erste Bank. However, this would have been ambiguous (see the red arrow) given the local spatial layout [source of background image: Filipe et. al (Citation2020)].
![Figure 1. Example of potential ambiguity. At the illustrated turning point (yellow circle), participants would have to make a left turn. The algorithm described by Rousell and Zipf (Citation2017) suggests to use the POI which is tagged with amenity:bank and named Erste Bank (green circle). Based on this, the route instruction would be (translated to English): Turn left at Erste Bank. However, this would have been ambiguous (see the red arrow) given the local spatial layout [source of background image: Filipe et. al (Citation2020)].](/cms/asset/6212fae2-d5a4-48be-8ab1-96d0debdb777/hscc_a_1942474_f0001_oc.jpg)
Figure 2. Example of overestimated salience. The algorithm by Rousell and Zipf (Citation2017) picks the beauty salon (red circle) as the most suitable landmark. However, this landmark cannot be recognized easily when approaching the turning point as can be derived from the picture on the left (for the specific spatial layout see the map on the right). The mall called Lugner City (highlighted in green) is clearly more salient and, hence, the algorithm’s choice was overruled by the experimenter [left: image by creator istefanos retrieved from Mapillary on Feb 26th, 2021, licensed under CC BY 4.0 and cropped); source of background image on the right: Filipe et. al (Citation2020)].
![Figure 2. Example of overestimated salience. The algorithm by Rousell and Zipf (Citation2017) picks the beauty salon (red circle) as the most suitable landmark. However, this landmark cannot be recognized easily when approaching the turning point as can be derived from the picture on the left (for the specific spatial layout see the map on the right). The mall called Lugner City (highlighted in green) is clearly more salient and, hence, the algorithm’s choice was overruled by the experimenter [left: image by creator istefanos retrieved from Mapillary on Feb 26th, 2021, licensed under CC BY 4.0 and cropped); source of background image on the right: Filipe et. al (Citation2020)].](/cms/asset/343591c9-9f4a-4b60-b757-1b801804cbc5/hscc_a_1942474_f0002_oc.jpg)
Based on the revised set of POI, we build the German language route instructions by analogy with Rousell and Zipf (Citation2017) (e.g., “Turn left after the Starbucks café.”, p. 13) as can be seen by the following example (English translation: Turn left at the pharmacy):
For cases in which the POI’s name was clearly visible in-situ, names were mentioned in the route instruction; otherwise, landmarks were referred to by their entity class, i.e. similarly to the example above. The resulting route instructions were synthesized using the Google Cloud Text-to-Speech Engine (Inc, Citation2020).
4.2. Experiment procedure
The outdoor study was designed as a within-subjects design study during which each participant walked two different routes. We will refer to walking one of these routes as trial throughout this text. During one of these trials, participants walked the route which they had sketched during the online data collection phase and they were, therefore, familiar with it. The other trial was done on unfamiliar terrain, i.e. this route was randomly picked from the set of routes other participants had provided and which did not cross areas that were marked as ‘familiar’ by the current participant.
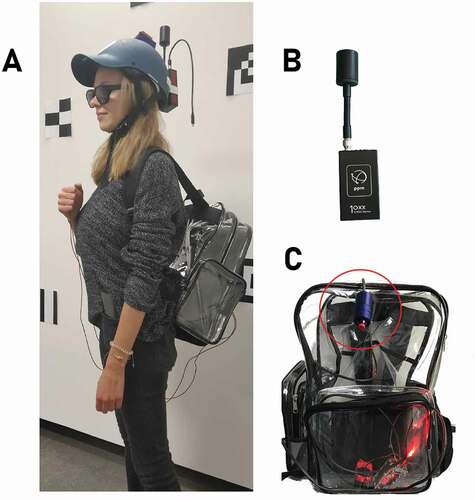
During each of the trials, trajectories were collected using a high precisionFootnote1 GNSS receiver (PPM 10-xx38, see ). Participants requested route instructions by operating a custom-built clicker device which lights up a red LED that signalizes route instruction requests to the experiment conductor. Instructions were played to the participant through Bluetooth earphones they wore which were connected to the experimenter’s phone. This point in time was logged by a smartphone application running on a mobile phone carried by the experimenter. In addition to that, head (xSens MTi-300 IMU) and eye movement data (PupilLabs Invisible) was collected but not used in the current study as we wanted to study the impact of those variables which are independent of specific equipment.
Figure 3. A: A sample participant in full equipment. B: GNSS receiver (PPM 10-xx38). C: During the experiment, participants requested navigation instructions using a custom-built clicker-device (circled in red) which triggers an LED light located in the backpack informing the experimenter about the request.
Prior to each trial, participants were carefully instructed to press the button of the clicker to request a route instruction whenever and as often as they wanted to. By means of an example which was not part of the actual route, they were, moreover, made explicitly aware of the fact that they will be given landmark-based route instructions. As mentioned above, we provided route instructions exclusively for turning points, a decision which is in line with the idea of spatial chunking (Klippel et al., Citation2002); moreover, it increases ecological validity as the majority of state-of-the-art wayfinding assistance systems provides route instructions only for turning points. As a consequence of this decision, participants were instructed that once they had requested an instruction, the received instruction might not be relevant for the upcoming intersection, i.e., the participants would have to continue to walk straight ahead until they have reached the intersection to which the instruction matched. In order to be also able to observe preferred timing of route instructions in a familiar environment, participants were explicitly asked to request and strictly follow the route instructions. They were, furthermore, reminded of the destination of the route they had drawn during the data acquisition process to avoid memory biases. On start of the trial, the experimenter pointed participants to the direction in which they should start walking.
4.3. Data availability
The (pre-)processing scripts as well as the raw data used in this paper will be made available through https://geoinfo.geo.tuwien.ac.at/resources/ (DOI: 10.5281/zenodo.4298703) in order to facilitate reproducibility of the results.
4.4. Data pre-processing
Experiments were conducted between June and October 2020.Footnote2 Participants were acquired through personal contact, posts on social media platforms and leaflets; they were reimbursed through a lottery. Overall, people (female:
, male:
,
,
,
) took part in the online questionnaire and, of these,
persons (female:
, male:
,
,
,
) completed both parts of the experiments (i.e.,
trials). Applying a case-wise deletion approach, we had to exclude 18 trials, primarily due to data loss by equipment malfunction. This leads to a final number of
trials to be included in our analysis.
4.4.1. Segmentation of Data
Finding meaningful route segments is an essential pre-processing part for our data analysis. We find segments based on actual user behavior, a decision which is based on the fact that not all intersections may be perceived as decision points by pedestrians due to the structure of the environment. Hence, each segment starts either at the starting point or at the intersection to which the previous route instruction referred to. A segment ends at the first intersection along the route after a participant has requested a route instruction for the first time. provides an overview of the algorithm used to segmentize our data based on OSM data. Intersections are circled in black, a trial’s smoothed GPS track is given in blue, the locations of the projected intersections are circled in yellow and green circles indicate the locations of route instruction requests. Two different cases are distinguished: Part A of the figure shows the default case in which the segment starts at the last turning point 3 and ends at the first intersection 4 after the location at which a route instruction was requested for the first time on this segment (green circle). Part B of the figure shows an example in which the segment extends from the starting point of the route (red circle) to intersection 2. The reason is the actual user behavior (this happened on 40 segments overall): In this example, intersection 1 is not perceived as an intersection as the participant would have otherwise asked for a route instruction before reaching this intersection. It is important to note that if intersection 1 would have been a turning point, the experimenter would have played the instruction to the participant and the segment would have been removed from the dataset (see below for the data cleaning procedure).
Figure 4. Segmentation process. Two possible situations: A (default case): The segment starts at the last turning point denoted as 3. The first intersection after the click position is denoted as 4 and the segment ends at this intersection. B: A route segment covering the distance from the starting point to intersection 2. It is reasonable to assume that the participant has not perceived intersection 1 as a decision point because the instruction is requested after it had been passed background image: Story Citation2013].
![Figure 4. Segmentation process. Two possible situations: A (default case): The segment starts at the last turning point denoted as 3. The first intersection after the click position is denoted as 4 and the segment ends at this intersection. B: A route segment covering the distance from the starting point to intersection 2. It is reasonable to assume that the participant has not perceived intersection 1 as a decision point because the instruction is requested after it had been passed background image: Story Citation2013].](/cms/asset/eff35af4-bd5a-499b-be4f-e9c333a2a4f6/hscc_a_1942474_f0004_oc.jpg)
This procedure yields segments, of which
segments remain after applying further data cleaning procedures:
11 segments are affected by misunderstandings: either participants admittedly misinterpret the task or the experimenter mistakenly played the next instruction instead of the current one;
27 segments are excluded as on these occasions participants request a route instruction on familiar routes only when the destination is already visible to them. This behavior contradicts the actual experiment task as some participants report to not have requested the instruction for navigation purposes in these situations;
33 segments are eliminated because the participants requested a route instruction for an intersection before entering the segment to which this intersection actually belonged to; these cases do not reflect the target variable of the survival analysis (see Section 5 below).
4.5. Survival Analysis Model
The advances in the family of so-called survival analysis models have been mainly driven by the biomedicine domain (see Hosmer, Lemeshow & May, Citation2011; Kalbfleisch & Prentice, Citation2011, for a detailed overview). This model type shows methodological and conceptual advantages over traditional regression approaches (see, e.g., Bhat & Pinjari, Citation2007). In brief, these models perceive duration as a survival process and focus on the share of individuals that survives past a given point in time or space. A focal element of these models revolves around the notion of hazard, i.e., the rate at which the duration process changes over time. The application of survival analysis models in spatial settings are explored and exemplified for the first time by Waldorf (Citation2003). A number of applications have built upon that work and utilized such models for distance-related questions such as trip-length modeling (see, e.g., Anastasopoulos, Islam, Perperidou & Karlaftis, Citation2012; Sarlas & Axhausen, Citation2018).
Among these models and for cases which focus primarily on prediction, choosing fully parametric models is most appropriate as these fully describe the basic underlying survival distribution and, at the same time, quantify how this distribution changes as a function of the explanatory variables (Hosmer et al., Citation2011). Two categories of such models exist and these differ with respect to their assumptions about how the survival function is affected by the explanatory variables. While proportional hazard models assume that the explanatory variables have a constant multiplicative effect on the underlying hazard function, this relationship is assumed to be also multiplicative on the time scale by accelerated failure time (AFT) models. By analogy with Giannopoulos et al. (Citation2017), we estimate an AFT model. This choice stems from the nature of the modeled process, i.e. it is presumed that the impact of the explanatory variables is amplified as users move forward in space.
represents the timing or distance of instructions for an individual with a cumulative distribution function
. The survival function represents the probability of observing a survival distance higher than
, denoted as
. Subsequently, the hazard function, defined as the probability of a process ending at point
given that it has lasted up to point
, is as follows:
Essentially, the knowledge of either of the functions ,
, or
enables the direct inference of the remaining two. For the case of AFT models with a Weibull survival function,
is defined as
, with
representing the effect of explanatory variable
, and an error component
. Applying a log transformation results in:
with following the extreme minimum value distribution, denoted as
with
being the scale parameter. The corresponding hazard and the survival functions are given as:
with and
. The equation for the median survival time can, subsequently, be derived by setting
and solving the equation for
:
Formula (2) shows that ‘s quantify the effect of the explanatory variables on
, which can, for this case, be interpreted as semi-elasticity values, i.e., 100*
is the approximate percentage change on T for a unit change on
. That change is, however, not constant along the corresponding survival function (see Formula 4). For instance, based on Formula (5), the impact of a change on
on its median
is given by:
5. Asking for an instruction for the first time after a turn – Results
As mentioned above, the auditory route instructions were landmark-based, exclusively referred to turning points and could be requested as often as participants wished to do so. Given this setup, we proceed with the estimation of an AFT model describing when the first request for an instruction was triggered by the participant. As will be shown, simple common sense rules like ‘the earlier the better’ do not hold. The modeling results can, consequently, be deployed within a system that automatically presents route instructions to users. All calculations were done using the open-source statistical software R (Core Team, R., et al, Citation2013), exploiting version 3.2–7 of the Survival package (Therneau, Citation2014).
Requests for route instructions, though, have two conjoint dimensions, a temporal and a spatial one while they are naturally bound by the length of the segment per case. For this reason, we choose to focus exclusively on the spatial dimension of the matter as this renders the results invariant to potential walking speed fluctuations which normally arise due to various (unobserved) factors. Therefore, the dependent variable of interest is the distance between last turning point or start of route and the position at which the first request for a navigation instruction is made. We apply a normalization to the range of by division by the segment length per case, in order to meet the model’s estimation prerequisite of uniform duration periods for all observations.
Subsequently, an AFT model is estimated with a Weibull duration distribution in place, similarly to the one presented in Formula (4). The choice of the form of the parametric survival function is made based on the Akaike Information Criterion (AIC), whereas the estimations are performed in terms of maximum likelihood. Furthermore, standard errors are clustered accordingly in order to account for the dependence among observations using a robust sandwich estimator.
The model specification involves the identification of which explanatory variables have a statistically significant impact on the outcome of interest. At the outset, this process is mainly driven by our assumptions about which characteristics of the person, route, trial and environment might influence the decision to request instructions. Nevertheless, all available explanatory variables (see Supplementary Material A) are thoroughly tested on their ability to improve the fit of the model in terms of AIC (a metric that penalizes overfitting), along with the statistical significance of the corresponding parameters ( values). Moreover, a pseudo-goodness of fit measure, the Nagelkerke
(Nagelkerke et al., Citation1991) is calculated based on the following formula:
In addition to that, absence of multicollinearity is ensured based on the calculation of the corresponding variance inflation factors (VIFs), which is required as multicollinearity could potentially invalidate the employed statistical tests and parameter estimations. It should be noted that the VIF calculation is done on the ordinary least squares (OLS) counterpart of the employed model, with the addition of a constant term, as the required measure cannot be calculated for the case of AFT models. Having said this, no multicollinearity issues (
) are detected. Finally, we used the OLS counterpart to calculate Cook’s distance (Cook, Citation1977) in order to detect highly influential observations (leverage
5%) resulting in two observations being eliminated from the sample. While the used variables are explained in , descriptive statistics of the employed sample are given in and the results of the parameter estimation and the accompanied goodness-of-fit measures, are presented in .
Table 2. Description of influential variables according to our model results. Categories: P: participant, R: route, T: trial, E: environment. Sources: OQ: online questionnaire that was completed by participants, UA: Urban Atlas, OSM: OpenStreetMap
Table 3. Summary statistics of the observations used for model estimation. (d): denotes a dichotomous variable; for these variables column mean represents the proportion in the sample, SD: standard deviation, Min: minimum value, Max: maximum value, distance norm.: normalized distance; all other variable names are explained in
Table 4. Normalized timing of instructions based on the AFT model. The variables are explained in Table 2
Parameters may be interpreted in terms of sign and magnitude: An estimate with a positive sign implies a longer survival (i.e., instructions will be required at a location which is further away from the last turning point and, thus, at a later point in time), while a negative sign means the opposite. Concerning the magnitude, a quantitative interpretation can be made based on Formulas (2) and (6). Based on the estimated parameters, we can obtain point estimates for quantiles of the distribution (e.g., the median) which are of potential interest for predicting the distance at which the system should automatically present a route instruction.
The parameters’ size in has to be interpreted in conjunction with the different value ranges of the variables and ceteris paribus, i.e., the values show the impact of a variable on the condition that all other variables remain unchanged. In summary, the model comprises personal, environmental, route- and trial-related variables, some of which are only rendered significantly based on interactions with other variables. The obtained estimates indicate that participants request a route instruction later as a function of their age (variable age_gt_40), on segments longer than
(variable lngSgm,) and in unfamiliar conditions if they score below average on the personality trait extraversion (variable BFI_e_low). All remaining variables describe an earlier request for an instruction: This holds for three different landcover classes (variables LC_1, LC_2 and LC_3) and well global/egocentric oriented people (variable sum_ego). In addition to that, a person who scores below average on the personality trait openness (variable BFI_o_low) will request a route instruction earlier when walking through unfamiliar terrain. Similarly, for long segments in unfamiliar environments (variable lngSgm:unfamiliar) participants ask for instructions earlier.
provide further elaboration and interpretation of the model results: In , the median predictions (calculated based on Formula 5) are plotted against the actual ones. The presence of a strong positive correlation between the two (; t-value = 2.23 with df = 239) provides evidence for the model’s explanatory power of instruction timing variance.
Figure 5. Predicted median survival values based on the estimated AFT model compared against the observed ones.
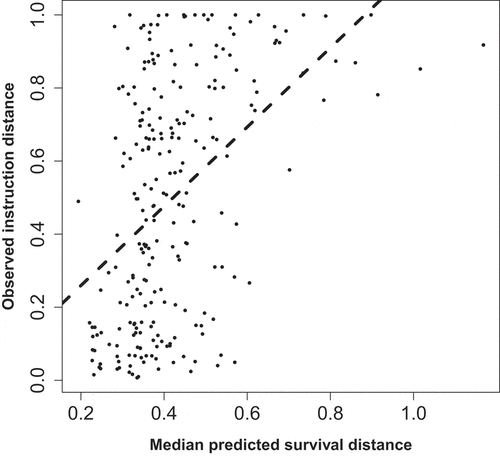
Figure 6. Empirical survival rates for two given subsets of observations (;
;
;
; left: familiar, right: unfamiliar segments), compared against the mean predicted ones. Dotted lines represent the 95% CI.
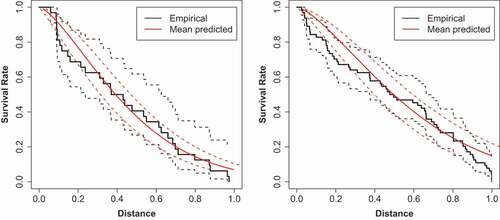
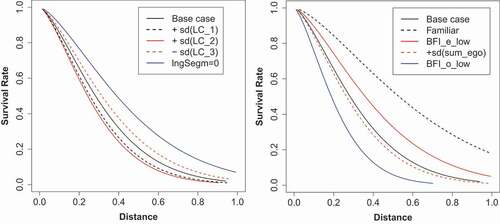
Figure 7. Variation of survival rate predictions due to explanatory variables modifications (continuous variables = 1 standard deviation (
), dummy variables =
1) compared to a base case scenario (BFI_o_low = 0, lngSegm = 1, age_gt_40 = 0, BFI_e_low = 0, unfamiliar = 1). Variable names are explained in .
In , empirical survival results are compared against predicted ones for two common cases: ,
,
, and
, i.e., people who are below 40 years of age, having a below average degree of openness/extraversion and walk on long segments. The familiar setting is shown on the left, whereas the unfamiliar case is shown on the right and the empirical survival function, predicted mean survival function and the corresponding 95% CI are given. The figure illustrates that in both cases, the predicted mean survival rates (calculated based on Formula 4 using the parameter estimates and the mean values of the remaining explanatory variables) are very close to the empirical ones while their 95% CI are always overlapping. Essentially, those functions demonstrate the distributional effect that different variables exert on the studied process. In this respect, the resulting functions can be employed to infer the point in space where a certain share of wayfinders requests instructions (e.g., 50%).
Finally, the impact of the different explanatory variables on the predicted survival rates is demonstrated by modifying those variables accordingly, and by plotting the resulting survival rates per case (). We define an artificial observation representing a wayfinder younger than 40 years of age, scoring above average on traits openness and extraversion, and walking on unfamiliar segments longer than as a base case (
,
,
,
,
; sample means are used for the remaining continuous variables, see ): On the left-hand side of the figure, the environmental and route characteristics of the base case are modified while on the right-hand side, the trial and personal ones are changed. The modification on the dummy variables consists of turning them on/off; the continuous variables are modified by adding/subtracting a value equal to their respective standard deviation. For instance, the black dashed line on the left side of the figure resembles the baseline artificial observation with an increase only in LC_1 by one standard deviation. Similarly, the red line resembles the baseline artificial observation with an increase only in LC_2, while the red dashed line shows the impact of a decrease on LC_2. The blue line resembles the baseline artificial observation with a change from
to
, indicating that the wayfinder is now walking on a short segment. In each of these cases, the normalized distance between the start of a segment and the position at which an instruction is requested changes substantially and the variables lngSegm (length of segment), BFI_o_low (below average degree of openness) and familiarity show the highest impact (see the right-hand side of ).
6. Discussion
We discuss the findings in terms of the identified influential variables and provide possible reasons for their influence. We start with the group of environmental variables (LC_*) and continue with the effect of segment length (lngSgm) and its interaction with familiarity (lngSgm:unfamiliar). Subsequently, the main effects of personal variables (age_gt_40 and sum_ego) and, finally, the remaining interactions between familiarity and personality traits (unfamiliar:BFI_e_low and unfamiliar:BFI_o_low) are discussed. In doing so, we will use terms such as earlier and later despite having analyzed normalized distance, which is reasonable based on the fact that an increased distance between the position of the first request of a route instruction and the last turning point implies a later point in time.
6.1. Environmental variables
According to our model, people request route instructions the earlier for route segments the higher the proportion of land cover classes LC_1, LC_2 or LC_3 is along them. LC_1 represents the Urban Atlas class 12100 (Industrial, commercial, public, military and private units), Comission (Citation2012, ), LC_2 subsumes Urban Atlas classes 11100 and 11210, i.e., it comprises areas of predominantly residential use with a soil sealing of >50% (see European Comission, Citation2012, p. 13–14), and LC_3 comprises classes 11220 and 11230, i.e., it similarly indicates land of predominantly residential use but with less soil sealing (10–50%, Comission, Citation2012, p. 14). In urban areas, LC_1 covers mostly public buildings (e.g., universities, museums) and associated features. Along our routes, LC_2 shows a medium-sized positive correlation () with the presence of OSM features tagged as shop, while higher shares of LC_3 are predominantly located in the outskirts of Vienna. The average building footprint differs considerably between these three classes in the case of Vienna (LC_1:
, LC_2:
, LC_3:
). LC_1, LC_2 and LC_3 together comprise all landcover classes representing building-covered areas in our data and, as the experiment took place in an urban area, areas along the segments belong for the most part to these classes (
), while the remaining area shares are dominated by the classes 12220 (open areas like roads and parking spaces) and 14100 (green urban areas). The model suggests an increased delaying effect as the average building size grows: The magnitude of the coefficients increases approximately by 10% between LC_3 and LC_2 and by 7% between LC_2 and LC_1. One potential explanation is that the line-of-sight to intersections and landmarks is affected by the presence of larger buildings. This interpretation is in line with, e.g., research indicating the importance of visibility in advance for landmark salience (see, e.g., Kattenbeck, Citation2017; Winter, Citation2003): If the layout of the spatial environment or elements therein block the wayfinders’ view, they might need an instruction earlier in order to have sufficient time to make their spatial decision. This may relate to the general increase in cognitive load which may be caused by larger buildings and high building density (coverage by buildings: LC_1: 46.8%, LC_2: 50.8%, LC_3: 25%) as this may impede the perception of the environment.
6.2. Route variables
The model further suggests that route instructions were requested later when participants travel on segments which were longer than (lngSgm). However, this effect is reversed for long segments on unfamiliar terrain (lngSgm:unfamiliar). The overall size of this negative effect is, therefore, in line with the AFT results obtained by Giannopoulos et al. (Citation2017), who find earlier requests on long segments (all participants were unfamiliar in their case): Exclusively persons who are unfamiliar with the environment want to receive an instruction earlier on long segments. It is reasonable to assume that on long segments, the upcoming decision point is seen later due to objects potentially restricting visibility, such as crowds or (driving or parking) cars. As a consequence, unfamiliar persons might experience a higher degree of difficulty of wayfinding (see, e.g., Farr, Kleinschmidt, Yarlagadda & Mengersen, Citation2012) and, hence, uncertainty due to their less developed mental representation. Familiar persons, however, are more confident due to their mental representation of the environment and its spatial peculiarities and, consequently, feel less pressure to request a route instruction early on.
6.3. Personal variables
With respect to personal variables, our results suggest that participants older than 40 years of age tend to request route instructions later, a finding based on approx. 10% of all route segments. All of these participants have not only spent the majority of their adulthood in Vienna but also consider their ability to find their way around in Vienna (question WIEN1, see Supplementary Material B) very close to or above average (,
,
).Footnote3 Therefore, it is reasonable to assume that the cognitive graph (see Warren, Citation2019) of this group of people is well developed as mental representations develop over time based on experience (see, e.g., Kitchin, Citation1994).
As experienced wayfinders in this particular city, in general, they feel less pressure to reduce their uncertainty by requesting a route instruction early on – irrespective of their familiarity with the particular environment. On the other hand, an opposite effect would have been also in line with prior evidence (see, e.g., Coutrot et al., Citation2018, p. 2862, who provide evidence that spatial abilities deteriorate between 19 and 60 years). Our findings on age are, moreover, different to those reported by Giannopoulos et al. (Citation2017), who found a main effect for both, age and the age group of people who are older than 27 years of age. Taken together, further investigation of potential reasons for these conflicting results are needed (see Section 7).
As mentioned above, we used the German-language spatial strategies questionnaire FRS (Münzer & Hölscher, Citation2011) to assess spatial strategies of participants. This scale comprises three subscales, namely global/egocentric, allocentric and knowledge of cardinal directions (see Münzer et al., Citation2016). Of these, the ability to orient oneself globally/egocentric, which is interpreted by Münzer et al. as SOD, has a significant negative impact according to our model (variable sum_ego): People who show better global/egocentric orientation will request a route instruction earlier. Again, this contradicts the finding by Giannopoulos et al. (Citation2017), who report that only people with low spatial abilities (measured by the Santa Barbara Sense of Direction (SBSOD) scale, see Hegarty, Citation2002) show a tendency to request instructions earlier. The reason for this difference may, therefore, relate to the different self-report measurements: The FRS questions reflect a person’s ability to keep track of one’s own position in the environment – which is particularly important for our task as people were instructed to walk straight until they can make sense out of an instruction. These participants can make an earlier request as they are confident in their ability to make sense out of it, even if they have to move further along in the environment.
6.4. Interactions between familiarity and personality traits
Drawing on common sense, a main effect of familiarity on timing would seem plausible, i.e., we would have expected that people ask later for instructions when traveling on familiar routes (and vice versa). However, familiarity is only rendered significant when interacting with two Big Five personality traits. Indeed, all interaction terms that were rendered significant relate to the subgroup of trials taking place in an unfamiliar environment. First, people scoring below average on the openness dimension request a route instruction earlier on unfamiliar routes. According to Costa and McCrae (Citation2010), people who score high on trait openness “[…] enjoy novelty and variety […] [and] have a high appreciation of beauty in art and nature” (Costa & McCrae, Citation2010, p. 243). The city of Vienna is, generally speaking, a city with a lot of historic buildings with highly decorated facades. When walking through unfamiliar terrain, people with an openness below average may, therefore, pay less attention to the beauty of this environment and ask for an instruction early on in order to have more time to focus on the wayfinding task itself.
Second, a low level of extraversion shows an impact when people are unfamiliar with the environment. Our data suggest that people who are rather reserved and show a tendency to be passive (see Costa & McCrae, Citation2010) cover a longer normalized distance from the last turning point before they request a further route instruction in unfamiliar environments. While this finding seems to be in line with the tendency to be rather passive, it leaves much room for further research (see Section 7) as a single person may score below average on both traits, extraversion and openness, resulting in a situation in which both dimensions show contradictory impacts.
6.5. Limitations
Several limitations apply to our study. First, the age distribution of our participants is heavily right-skewed with the majority of people being no older than 26 years. Further studies are, consequently, needed to fully understand the impact of age. Second, we have deliberately focused on auditory route instructions in this study as this modality allows wayfinders to use their smartphones for other purposes than navigating in parallel. Having said this, however, further studies are needed to understand the impact that route instruction modality has on timing. Third, a methodological limitation applies: Survival analysis cannot model cases in which the survival time is zero, i.e., we excluded participants who requested a route instruction at a distance of zero to the turning point. In order to understand the reasons for this behavior, we would have needed to collect the reasons for clicks, which we decided not to do in the current study in order to avoid confounding effects resulting from the required think-aloud procedure. A fourth limitation applies to the potential effect the default instruction may have yielded: For the sake of ecological validity, auditory route instructions were given for turning points only. Whether participants would have shown a different behavior if they would have been able to request a route instruction for every intersection remains, therefore, a matter of future research. A final limitation refers to our behavior-based approach toward data segmentation. We did not want to interrupt participants once a trial had started (e.g., through think-aloud procedures) and this decision comes at an implementation cost: We have to extrapolate the way participants perceived the spatial environment from their behavior. For example, if a person has not requested a route instruction before passing the first intersection on a segment, we assume that this person has not perceived this intersection (otherwise s/he would have requested a route instruction as s/he could not know that s/he are required to go straight).
7. Conclusion and Future Work
Up until now, timing of route instructions in wayfinding assistance systems for pedestrians has been almost neglected. Using Giannopoulos et al. (Citation2017) as a starting point, we conducted a within-subject, in-situ wayfinding study suitable to gain an insight into the location after a turning point at which a wayfinding assistance system for pedestrians should present a route instruction for the first time. We applied an AFT-based survival model based on a Weibull distribution to test whether and which environmental, personal, trial or route-related variables have an impact on participants’ timing requests. Our results suggest that older people request instructions later as well as people with low extraversion do in unfamiliar environments. In contrast, the presence of different landcover classes as well as high egocentric orientation abilities result in earlier instruction requests. Similarly, people with low openness, who travel through unfamiliar environments, request instructions earlier. Finally, the length of segments shows both, a significant main effect and an interaction effect with familiarity. Given the model-based approach, we discussed possible reasons for their influence and highlight differences and commonalities between our model and the timing model obtained by Giannopoulos et al. (Citation2017). Based on the results and the discussion thereof, at least six main areas of future research arise:
We have deliberately chosen auditory, landmark-based turn-by-turn instructions throughout this study. Further investigations, however, are needed in order to understand whether the variables involved show a similar impact for other modalities, e.g., text-based route instructions, and/or non-landmark-based route instructions.
Given the fact that we provide route instructions exclusively for turning points, further research is needed whether presenting participants with route instructions for each intersection has an impact on the point in time an instruction will be requested.
While we have focused on collecting behavioral correlates, one of the core questions that arises is about the motivations of a person to request a navigation instruction at a specific point in time, its relation to spatial strategies and the degree of uncertainty in wayfinding as perceived by participants. Based on our results, the experimental protocol used to study this problem should include a variety of landcovers along routes, spatial layouts, objects potentially restricting visibility (e.g., cars, crowdedness), different building sizes along a route and different levels of decision point visibility.
The fact that low openness and low extraversion show contradicting impact leaves much room for further research on whether one of these dimensions is rendered predominant in specific spatial situations or environments.
With respect to spatial orientation, a first question relates to the potential impact different self-report measurements of sense of direction (i.e., SBSOD vs FRS) have on timing. Second, it seems worthwhile to devise research protocols suitable to assess whether SOD may have a different degree of impact as a function of familiarity with the environment.
Based on our results regarding age and the inconsistencies of these when compared to Giannopoulos et al. (Citation2017) it is worthwhile to investigate how persons who have lived most of their life in Vienna (or other cities) and persons of similar age who have spent most of their life in non-urban environments differ in terms of timing preferences. This would also allow to investigate differences in spatial strategies employed between these two groups and could, moreover, be used to shed light on the fact how experience in real-world navigation in a particular environment impacts spatial ability deterioration.
Declaration of conflict of interest
The authors declare that there are no conflicts of interest.
Supplemental Material
Download PDF (52.8 KB)Supplemental Material
Download PDF (42.9 KB)Acknowledgments
We would like to express our sincere gratitude to the people willing to participate in our experiment even during a world-wide health crisis. Moreover, we would like to thank the three anonymous reviewers whose comments helped to significantly improve this paper.
Supplemental data
Supplemental data for this article can be accessed on the publisher’s website.
Correction Statement
This article has been republished with minor changes. These changes do not impact the academic content of the article.
Notes
1 This GNSS receiver achieves an accuracy of when applying the EPOSA (see https://www.eposa.at/, last accessed on March
, 2021) correction, which we have been doing during our experiments. Yet, its accuracy still varies in the urban environment.
2 Due to the COVID-19 pandemic, participants were harder to find than usual.
3 Due to the correlation of between sum_ego and WIEN1 we excluded the latter from the model as the former is based on a validated, psychometric scale.
Related Research Data
References
- Anastasopoulos, P. C., Islam, M. B., Perperidou, D., & Karlaftis, M. G. (2012). Hazard-based analysis of travel distance in urban environments: Longitudinal data approach. Journal of Urban Planning and Development, 138(1), 53–61. doi:10.1061/(ASCE)UP.1943-5444.0000102
- Bae, C. J., & Montello, D. R. (2019). Dyadic route planning and navigation in collaborative wayfinding. In S. Timpf, C. Schlieder, M. Kattenbeck, B. Ludwig, & K. Stewart (Eds.), Proceedings of the 14th International Conference onSpatial Information Theory, COSIT 2019, September 9–13,2019, Regensburg, Germany (Vol.142, pp. 1–20). doi: 10.4230/LIPIcs.COSIT.2019.24
- Barhorst-Cates, E. M., Rand, K. M., & Creem-Regehr, S. H. (2019). Navigating with peripheral field loss in a museum: Learning impairments due to environmental complexity. Cognitive Research: Principles and Implications, 4(1), 41. doi:10.1186/s41235-019-0189-9
- Bhat, C. R., & Pinjari, A. R. (2007). Duration modeling. In D. A. Hensher & K. J. Button (Eds.), Handbook of Transport Modelling: 2nd Edition (pp. 105–131). Emerald Group Publishing Limited.
- Bienk, S., Kattenbeck, M., Ludwig, B., Müller, M., & Ohm, C. (2013). I want to view it my way - interfaces to mobile maps should adapt to the user’s orientation skills. In Proceedings of the 12th International Conference on Mobile and Ubiquitous Multimedia, MUM 2013. doi: 10.1145/2541831.2541841
- Boeing, G. (2017). Osmnx: A python package to work with graph-theoretic openstreetmap street networks. The Journal of Open Source Software, 2(12), 215. doi:10.21105/joss.00215
- Brügger, A., Richter, K.-F., & Fabrikant, S. I. (2018). Which egocentric direction suffers from visual attention during aided wayfinding? In Eye Tracking for Spatial Research, Proceedings of the 3rd International Workshop (pp. 22–27). doi: 10.3929/ethz-b-000222472
- Brügger, A., Richter, K.-F., & Fabrikant, S. I. (2019). How does navigation system behavior influence human behavior? Cognitive Research: Principles and Implications, 4, 5(2019). doi:10.1186/s41235-019-0156-5
- Brunyé, T. T., Gardony, A. L., Holmes, A., & Taylor, H. A. (2018). Spatial decision dynamics during wayfinding: intersections prompt the decision-making process. Cognitive Research: Principles and Implications, 3(1), 13(2018). doi:10.1186/s41235-018-0098-3
- Caduff, D., & Timpf, S. (2008). On the assessment of landmark salience for human navigation. Cognitive Processing, 9(4), 249–267. doi:10.1007/s10339-007-0199-2
- Cheraghi, S. A., Almadan, A., & Namboodiri, V. (2019). CityGuide: A Seamless Indoor- Outdoor Wayfinding System for People With Vision Impairments. In The 21st International Acm Sigaccess Conference on Computers and Accessibility (pp. 542–544). New York, NY, USA: ACM. doi: 10.1145/3308561.3354621
- Coluccia, E., & Louse, G. (2004). Gender differences in spatial orientation: A review. Journal of Environmental Psychology, 24(3), 329–340. doi:10.1016/j.jenvp.2004.08.006
- Comission, E. (2012). Mapping Guide for a European Urban Atlas — Copernicus. urban-atlas-mapping-guide, 30, 2020). Retrieved from https://land.copernicus.eu/user-corner/technical-library/
- Cook, R. D. (1977). Detection of influential observation in linear regression. Technometrics, 19(1), 15–18.
- Coors, V., Elting, C., Kray, C., & Laakso, K. (2005). Presenting Route Instructions on Mobile Devices: From Textual Directions to 3D Visualization. In J. Dykes, A. M. MacEachren, & M. J. Kraak 10:1–10:13 Exploring Geovisualization, Elsevier (529–550). doi:10.1016/B978-008044531-1/50445-0
- Core Team, R., et al. (2013). R: A language and environment for statistical computing. Vienna, Austria.
- Costa, P. T., & McCrae, R. R. (2010). The NEO Inventories. In Neo PI-R professional manual (pp. 223–256). American Psychological Association.
- Coutrot, A., Silva, R., Manley, E., de Cothi, W., Sami, S., Bohbot, V. D., … Spiers, H. J. (2018). Global Determinants of Navigation Ability. Current Biology, 28(17), 2861–2866. doi:10.1016/j.cub.2018.06.009
- Ding, D., Parmanto, B., Karimi, H. A., Roongpiboonsopit, D., Pramana, G., Conahan, T., & Kasemsuppakorn, P. (2007). Design considerations for a personalized wheelchair navigation system. In K. Hoffmann & R. Ruff (Eds.), 29th Annual International Conference of the IEEE Engineering in Medicine and Biology Society (p. 4790–4793). doi: 10.1109/IEMBS.2007.4353411
- Duckham, M., Winter, S., & Robinson, M. (2010). Including landmarks in routing instructions. Journal of Location Based Services, 4(1), 28–52. doi:10.1080/17489721003785602
- Fang, Z., Li, Q., & Shaw, S.-L. (2015). What about people in pedestrian navigation? Geo-Spatial Information Science, 18(4), 135–150. doi:10.1080/10095020.2015.1126071
- Farr, A. C., Kleinschmidt, T., Yarlagadda, P., & Mengersen, K. (2012). Wayfinding: A Simple Concept, A Complex Process, 32(6) , 715-743 doi:10.1080/01441647.2012.712555
- Filipe, M. J., Frank, R. Story, J. Gardiner, H. Rump, … A. Patil. (2020) python-visualization/folium (Version v0.11.0). Zenodo. http://doi.org/10.5281/zenodo.3806268
- Fogliaroni, P., Bucher, D., Jankovic, N., & Giannopoulos, I. (2018). Intersections of our world. In Proceedings of the 10th International Conference on Geographic Information Science (GIScience 2018) (3:1— 3:14).
- Geldof, S., & Dale, R. (2002). Improving route directions on mobile devices. In ISCA Tutorial and Research Workshop (ITRW) on Multi-Modal Dialogue in Mobile Environments. last access on March 3, 2020. Retrieved from http://science.mq.edu.au/~rdale/publications/papers/2002/final42.pdf
- Giannopoulos, I., Kiefer, P., Raubal, M., Richter, K.-F., & Thrash, T. (2014). Wayfinding Decision Situations: A Conceptual Model and Evaluation. In M. Duckham, E. Pebesma, K. Stewart, & A. U. Frank (Eds.), Proceedings of the 8th International Conference on Geographic Information Science (GIScience 2014) (pp. 221–234). doi: 10.1007/978-3-319-11593-1_15
- Giannopoulos, I., Jonietz, D., Raubal, M., Sarlas, G., & Stähli, L. (2017). Timing of Pedestrian Navigation Instructions. In E. Clementini, M. Donnelly, M. Yuan, C. Kray, P. Fogliaroni, & A. Ballatore (Eds.), Proceedings of the 13th International Conference on Spatial Information Theory (COSIT 2017) (pp. 16: 1–16:13).Dagstuhl, Germany: Schloss Dagstuhl–Leibniz-Zentrum fuer Informatik. doi: 10.4230/LIPIcs.COSIT.2017.16
- Giannopoulos, I., Kiefer, P., & Raubal, M. (2015). Gaze nav: Gaze-based pedestrian navigation. In Proceedings of the 17th International Conference on Human-Computer Interaction with Mobile Devices and Services (p. 337–346). Association for Computing Machinery, Inc. doi: 10.1145/2785830.2785873
- Goldberg, L. R. (1990). An alternative “description of personality”: The Big-Five factor structure. Journal of Personality and Social Psychology, 59(6), 1216–1229. doi:10.1037/0022-3514.59.6.1216
- Goodchild, M. F. (2007). Citizens as sensors: The world of volunteered geography. GeoJournal, 69(4), 211–221. doi:10.1007/s10708-007-9111-y
- Götze, J., & Boye, J. (2016). Learning landmark salience models from users’ route instructions. Journal of Location Based Services, 10(1), 47–63. doi:10.1080/17489725.2016.1172739
- Hazzard, A., Benford, S., & Burnett, G. (2014). Walk this way: Musically guided walking experiences. In J. A. Konstan, E. H. Chi, & K. Höök (Eds.), Proceedings of the SIGCHI Conference on Human Factors in Computing Systems (p. 605–614). Association for Computing Machinery. doi: 10.1145/2556288.2557250
- Hegarty, M. (2002). Development of a self-report measure of environmental spatial ability. Intelligence, 30(5), 425–447. doi:10.1016/S0160-2896(02)00116-2
- Hirtle, S., Richter, K.-F., Srinivas, S., & Firth, R. (2010). This is the tricky part: When directions become difficult. Journal of Spatial Information Science, 1, 53–73. doi:10.5311/JOSIS.2010.1.5
- Holland, S., Morse, D. R., & Gedenryd, H. (2002). AudioGPS: Spatial Audio Navigation with a Minimal Attention Interface. Personal and Ubiquitous Computing, 6(4), 253–259. doi:10.1007/s007790200025
- Hölscher, C., Tenbrink, T., & Wiener, J. M. (2011). Would you follow your own route description? cognitive strategies in urban route planning. Cognition, 121(2), 228–247. doi:10.1016/j.cognition.2011.06.005
- Hosmer, J. D. W., Lemeshow, S., & May, S. (2011). Applied survival analysis: Regression modeling of time-to-event data. John Wiley & Sons.
- Inc, G. Google Inc. (2020). Google text-to-speech documentation., 30, 2020. Retrieved from https://cloud.google.com/text-to-speech/docs
- Ishikawa, T. (2019). Satellite navigation and geospatial awareness: Long-term effects of using navigation tools on wayfinding and spatial orientation. The Professional Geographer, 71(2), 197–209. doi:10.1080/00330124.2018.1479970
- John, O. P., & Srivastava, S. (1999). The Big-Five trait taxonomy: History, measurement, and theoretical perspectives. In L. Pervin & O. P. John (Eds.), Handbook of Personality: Theory and research (pp. 102–138). New York: Guilford Press.
- Kalbfleisch, J. D., & Prentice, R. L. (2011). The statistical analysis of failure time data (No. 360). John Wiley & Sons.
- Kattenbeck, M. (2017). How subdimensions of salience influence each other. comparing models based on empirical data. In E. Clementini, M. Donnelly, M. Yuan, C. Kray, P. Fogliaroni, & A. Ballatore (Eds.), Proceedings of the 13th International Conference on Spatial Information Theory (COSIT 2017) (pp.10:1–10:13). doi: 10.4230/LIPIcs.COSIT.2017.10
- Kattenbeck, M., Nuhn, E., & Timpf, S. (2018). Is salience robust? A heterogeneity analysis of survey ratings. In S. Winter, A. Griffin, & M. Sester (Eds.), Proceedings of the 10th International Conference on Geographic Information Science (GIScience 2018) (pp. 7:1-7:16). doi: 10.4230/LIPIcs.GIScience.2018.7
- Kirasic, K. (2000). Age differences in adults’ spatial abilities, learning environmental layout, and wayfinding behavior. Spatial Cognition and Computation, 2(2), 117–134. doi:10.1023/A:1011445624332
- Kitchin, R. M. (1994). Cognitive maps: What are they and why study them? Journal of Environmental Psychology, 14(1), 1–19. doi:10.1016/S0272-4944(05)80194-X
- Klippel, A., Tappe, H., & Habel, C. (2002). Pictorial representations of routes: Chunking route segments during comprehension. In C. Freksa, W. Brauer, C. Habel, & K. F. Wender (Eds.), International Conference on Spatial Cognition (pp. 11–33).
- Klippel, A., Richter, K. F., & Hansen, S. (2009). Cognitively ergonomic route directions. Handbook of Research on Geoinformatics, 230–238. doi:10.4018/978-1-59140-995-3.ch029
- Krukar, J., Anacta, V. J., & Schwering, A. (2020). The effect of orientation instructions on the recall and reuse of route and survey elements in wayfinding descriptions. Journal of Environmental Psychology, 68(2020), 101407. doi:10.1016/j.jenvp.2020.101407
- Lander, C., Herbig, N., Löchtefeld, M., Wiehr, F., & Krüger, A. (2017). Inferring landmarks for pedestrian navigation from mobile eye-tracking data and google street view. Conference on Human Factors in Computing Systems - Proceedings, Part F1276, 2721–2729. doi: 10.1145/3027063.3053201
- Lazem, S. Y., & Sheta, W. M. (2005). Automatic Landmark Identification in Large Virtual Environment: A Spatial Data Mining Approach. In Proceedings of the Ninth International Conference on Information Visualisation (5) (p. 752–757). IEEE Computer Society.
- Lovelace, K. L., Hegarty, M., & Montello, D. R. (1999). Elements of good route directions in familiar and unfamiliar environments. In C. Freksa & D. M. Mark (Eds.), Spatial Information Theory: Cognitive and Computational Foundations of Geographic Information Science (pp. 65–82).
- May, A. J., Ross, T., Bayer, S. H., & Tarkiainen, M. J. (2003). Pedestrian navigation aids: Information requirements and design implications. Personal and Ubiquitous Computing, 7(6), 331–338. doi:10.1007/s00779-003-0248-5
- Mazurkiewicz, B., Kattenbeck, M., Kiefer, P., & Giannopoulos, I. (2020). Not Arbitrary, Systematic! Average-Based Route Selection for Navigation Experiments. In K. Janowicz & J. A. Verstegen (Eds.), Proceedings of the 11th International Conference on Geographic Information Science (GIScience 2021) - Part I (pp. 8: 1–8:16). Dagstuhl, Germany: Schloss Dagstuhl– Leibniz-Zentrum für Informatik. doi: 10.4230/LIPIcs.GIScience.2021.I.8
- Michon, P.-E., & Denis, M. (2001). When and why are visual landmarks used in giving directions? In D. R. Montello (Ed.), International Conference on Spatial Information Theory (COSIT 2001) (pp. 292–305).
- Millonig, A., & Schechtner, K. (2007). Developing landmark-based pedestrian-navigation systems. IEEE Transactions on Intelligent Transportation Systems, 8(1), 43–49. doi:10.1109/TITS.2006.889439
- Montello, D. R. (2005). Navigation. In The Cambridge Hanbook of Visuospatial Thinking (pp. 257–294). Cambridge University Press.
- Muffato, V., & Meneghetti, C. (2020). Knowledge of familiar environments: Assessing modalities and individual visuo-spatial factors. Journal of Environmental Psychology, 67(September), 2019. doi:10.1016/j.jenvp.2020.101387
- Münzer, S., Fehringer, B. C., & Kühl, T. (2016). Validation of a 3-factor structure of spatial strategies and relations to possession and usage of navigational aids. Journal of Environmental Psychology, 47, 66–78. doi:10.1016/j.jenvp.2016.04.017
- Münzer, S., & Hölscher, C. (2011). Entwicklung und Validierung eines Fragebogens zu räumlichen Strategien. Diagnostica, 57(3), 111–125. doi:10.1026/0012-1924/a000040
- Nagelkerke, N. J., et al. (1991). A note on a general definition of the coefficient of determination. Biometrika, 78(3), 691–692. doi:10.1093/biomet/78.3.691
- Nori, R., & Piccardi, L. (2011). Familiarity and spatial cognitive style: How important are they for spatial representation? In J. B. Thomas (Ed.), Spatial Memory: Visuospatial Processes, Cognitive Performance and Developmental Effects (pp. 123–144). Nova Science Publishers, Inc.
- Nori, R., Palmiero, M., Bocchi, A., Giannini, A. M., & Piccardi, L. (2020). The specific role of spatial orientation skills in predicting driving behaviour. Transportation Research Part F: Traffic Psychology and Behaviour, 71, 259–271. doi:10.1016/j.trf.2020.04.009
- Nothegger, C., Winter, S., & Raubal, M. (2004). Selection of salient features for route directions. Spatial Cognition & Computation, 4(2), 113–136. doi:10.1207/s15427633scc0402_1
- Nuhn, E., & Timpf, S. (2020). How to Model Personalised Landmarks? In J. Šķilter, N. New-combe, & D. Uttal (Eds.), Spatial Cognition XII. Spatial Cognition 2020 (pp. 33–49). Springer International Publishing. doi:10.1007/978-3-030-57983-8
- Nuhn, E., & Timpf, S. (2017). A multidimensional model for selecting personalised landmarks. Journal of Location Based Services, 11(3–4), 153–180. doi:10.1080/17489725.2017.1401129
- Piccardi, L., Risetti, M., & Nori, R. (2011). Familiarity and Environmental Representations of a City: A Self-Report Study. Psychological Reports, 109(1), 309–326. doi:10.2466/01.13.17.PR0.109.4.309-326
- Quesnot, T., & Roche, S. (2015). Quantifying the Significance of Semantic Landmarks in Familiar and Unfamiliar Environments. In S. I. Fabrikant, M. Raubal, M. Bertolotto, C. Davies, S. Freundschuh, & S. Bell (Eds.), COSIT 2015: Proceedings of the 12th International Conference on Spatial Information Theory (p. 468–489). Springer International Publishing.
- Rammstedt, B., Kemper, C. J., Klein, M. C., Beierlein, C., & Kovaleva, A. (2012). Eine kurze Skala zur Messung der fünf Dimensionen der Persönlichkeit. GESIS-Working Papers, 22(2), 1–32.
- Raubal, M., & Winter, S. (2002). Enriching wayfinding instructions with local landmarks. In M. Egenhofer & D. Mark (Eds.), International conference on geographic information science Proceedings of the 2nd International Conference on Geographic Information Science (GIScience 2002) (p. 243–259). Springer.
- Rehrl, K., Häusler, E., Leitinger, S., & Bell, D. (2014). Pedestrian navigation with augmented reality, voice and digital map: Final results from an in situ field study assessing performance and user experience. Journal of Location Based Services, 8(2), 75–96. doi:10.1080/17489725.2014.946975
- Richter, K.-F., & Klippel, A. (2005). A Model for Context-Specific Route Directions. In C. Freksa, M. Knauff, B. Krieg-Brückner, B. Nebel, & T. Barkowsky (Eds.), Spatial Cognition IV. Reasoning, Action, Interaction. Spatial Cognition 2004 (p. 58–78). doi: 10.1007/978-3-540-32255-9_4
- Richter, K.-F., & Winter, S. (2014). Landmarks. GIScience for Intelligent Services. Springer International Publishing.
- Ross, T., May, A., & Thompson, S. (2004). The Use of Landmarks in Pedestrian Navigation Instructions and the Effects of Context. In S. Brewster & M. Dunlop (Eds.), International Conference on Mobile Human-Computer Interaction Mobile HCI 2004 (p. 300–304). doi: 10.1007/978-3-540-28637-0_26
- Rousell, A., & Zipf, A. (2017). Towards a landmark-based pedestrian navigation service using OSM data. ISPRS International Journal of Geo-Information, 6(3), 64. doi:10.3390/ijgi6030064
- Sarjakoski, T., Kettunen, P., Halkosaari, H.-M., Laakso, M., Rönneberg, M., Stigmar, H., & Sarjakoski, T. (2013). Landmarks and a Hiking Ontology to Support Wayfinding in a National Park During Different Seasons. In M. Raubal, D. M. Mark, & A. U. Frank (Eds.), Cognitive and Linguistic Aspects of Geographic Space. New Perspectives on Geographic Information Research (pp. 99–119). Heidelberg: Springer.
- Sarlas, G., & Axhausen, K. W. (2018). Commuting distance and individual accessibility. Arbeitsberichte Verkehrs-und Raumplanung, IVT, ETH Zurich, 1376.
- Schmidt, A., Beigl, M., & Gellersen, H.-W. (1999). There is more to context than location. Computers & Graphics, 23(6), 901. doi:10.1016/S0097-8493(99)00120-X
- Schwering, A., Krukar, J., Li, R., Anacta, V. J., & Fuest, S. (2017). Wayfinding through orientation. Spatial Cognition and Computation, 17(4), 273–303. doi:10.1080/13875868.2017.1322597
- Stähli, L., Giannopoulos, I., & Raubal, M. (2021). Evaluation of pedestrian navigation in smart cities. Environment and Planning B: Urban Analytics and City Science, 48(6), 1728–1745. doi:10.1177/2399808320949538
- Stern, E., & Portugali, J. (1999). Environmental cognition and decision making in urban navigation. In Wayfinding behavior: Cognitive mapping and other spatial processes (pp. 99–119).
- Taillade, M., N’Kaoua, B., & Sauzéon, H. (2016). Age-Related Differences and Cognitive Correlates of Self-Reported and Direct Navigation Performance: The Effect of Real and Virtual Test Conditions Manipulation. Frontiers in Psychology, 6. doi:10.3389/fpsyg.2015.02034
- Therneau, T. (2014). A package for survival analysis in S. R Package Version, 2.37-4.
- Tom, A., & Denis, M. (2004). Language and spatial cognition: Comparing the roles of landmarks and street names in route instructions. Applied Cognitive Psychology, 18(9), 1213–1230. doi:10.1002/acp.1045
- Van Rossum, G., & Drake, F. L. (2009). Python 3 Reference Manual. Scotts Valley, CA: CreateSpace.
- Völkel, T., & Weber, G. (2008). Routecheckr: Personalized multicriteria routing for mobil ity impaired pedestrians. In F. Hwang (Ed.), Proceedings of the 10th International ACM SIGACCESS Conference on Computers and Accessibility (pp. 185–192). doi: 10.1145/1414471.1414506
- Waldorf, B. (2003). Spatial patterns and processes in a longitudinal framework. International Regional Science Review, 26(3), 269–288. doi:10.1177/0160017603253788
- Walther-Franks, B., & Malaka, R. (2008). Evaluation of an augmented photograph-based pedestrian navigation system. In A. Butz, B. Fisher, A. Krüger, P. Olivier, & M. Christie (Eds.), Smart Graphics (pp. 94–105). Berlin, Heidelberg: Springer.
- Wang, J., & Ishikawa, T. (2018). A system of automatic generation of landmark-based pedestrian navigation instructions and its effectiveness for wayfinding. In S. Creem-Regehr, J. Schöning, & A. Klippel (Eds.), German Conference on Spatial Cognition (pp. 326–340).
- Warren, W. H. (2019). Non-euclidean navigation. The Journal of Experimental Biology, 222(Suppl_1). doi:10.1242/jeb.187971
- Winter, S. (2003). Route Adaptive Selection of Salient Features. In W. Kuhn, M. F. Worboys, & S. Timpf (Eds.), Spatial information theory. foundations of geographic information science (pp. 349–361). Berlin, Heidelberg: Springer.
- Zimmer, H. D., Münzer, S., & Baus, J. (2010). From Resource-Adaptive Navigation Assistance to Augmented Cognition. In M. W. Crocker & J. Siekmann (Eds.), Resource-Adaptive Cognitive Processes (pp. 35–53). Berlin, Heidelberg: Springer. doi: 10.1007/978-3-540-89408-7_3