
Abstract
Context: Folium Mori, the leaf of Morus alba L. (Moraceae), has been used in traditional Chinese medicine (TCM) for treating diabetes. However, it is unclear which components in the mulberry leaf are effective for the treatment of type 2 diabetes mellitus (T2DM).
Objective: To investigate the flavonoids and polyphenols in mulberry leaves and their antihyperglycemic and antihyperlipidemic effects in T2DM rats.
Materials and methods: Male Sprague-Dawley rats were divided into five groups: normal control (NC), diabetic control (DBC), diabetic group with 0.3 mg/kg b.w./day rosiglitazone (RSG), diabetic group with 7 g/kg b.w./day TCM formula and diabetic group with 2 g/kg b.w./day Folium Mori extract (FME). After 4 weeks, the rats were sacrificed; biochemical parameters, gene and protein expression were measured.
Results: The FBG level was significantly lower in the FME group than in the DBC group (p < 0.05). In oral glucose tolerance test, the AUC was significantly lower in the FME group (p < 0.05). The HOMA-IR level was significantly decreased in the FME group (p < 0.05). FME decreased the total cholesterol (TC), triglyceride (TG) and low density lipoprotein (LDL) levels (p < 0.05). FME increased the mRNA and protein expression of IRS-1, PI3K p85α and Glut-4 increased significantly (p < 0.05). Histological analysis revealed amelioration of lipid accumulation following FME treatment. Additionally, immunohistochemical analysis displayed stronger staining of Glut-4 in the FME group compared to the DBC group.
Discussion and conclusion: FME could decrease the body weight, blood glucose, TG, TC and LDL levels, and improve insulin resistance. FME possessed significant antihyperglycemic and antihyperlipidemic activities via the IRS-1/PI3K/Glut-4 signalling pathway.
Introduction
Diabetes mellitus is a complicated disease, whereby 90% of diabetic cases are non-insulin dependent, also known as type 2 diabetes mellitus (T2DM). Insulin resistance and impaired insulin secretion are the major characteristics of T2DM. Specifically, if body glucose homeostasis in the target tissues is disrupted due to a failure in the control of circulating hormones, insulin resistance occurs, which can result in many chronic complications clinically (Saltiel & Kahn Citation2001; Liu et al. Citation2010; Carnagarin et al. Citation2015). Skeletal muscle is a major contributor to glucose metabolism in humans and animals and therefore, it is considered to be one of the most crucial target organs of T2DM (Zisman et al. Citation2000).
Mulberry leaf (Folium Mori), the leaf of Morus alba L. (Moraceae), has been used as one of the ingredients in traditional Chinese medicine (TCM) for the treatment of diabetes (Zhang et al. Citation2014; Wilson & Islam Citation2015), atherosclerosis (Sugimoto et al. Citation2009; Chan et al. Citation2013) and as an immune booster due to its antioxidant potential (Bharani et al. Citation2010; Yimam et al. Citation2015). Mulberry leaf extract has previously been reported to ameliorate T2DM symptoms and complications, such as dyslipidemia (Trimarco et al. Citation2015), diabetic nephropathy (Zhang et al. Citation2015) and impaired liver functions (Wilson & Islam Citation2015). Mulberry leaf extract consists of various chemical components, including flavonoids, alkaloids and phytochemicals (Nakagawa et al. Citation2010; Kozlov & Danilov Citation2012); however, it is yet unclear, which components are effective for the treatment of T2DM. In the present study, the flavonoids and polyphenols components in mulberry leaves were separated and their respective antidiabetic effect and mechanism of action were investigated.
Impairment in insulin receptor (IR) and IR substrate (Zisman et al. Citation2000) can affect the activation of signalling transduction in T2DM. Many signalling pathways involve the process of glycogen biosynthesis and consumption, of which, adenosine 5′-monophosphate-activated protein kinase and phosphoinositide 3-kinase (PI3K) can control the glycogen metabolism and storage via modulating the glycogen synthase. Upon successful activation of PI3K, translocation of glucose transporter 4 (Glut-4) to the cellular membrane occurs, allowing the control of glucose uptake in target tissues (Ooms et al. Citation2009; Lee et al. Citation2012). Up to date, there have been no studies, which focus on flavonoids and polyphenols in mulberry leaf extract and their relationship with the IRS-1/PI3K/Glut-4 signalling pathway in a T2DM model. Therefore, understanding the IRS-1/PI3K/Glut-4 signalling pathway and the molecular mechanisms involved in T2DM can provide better insight into the use of mulberry leaf for the treatment of T2DM.
Materials and methods
Plant materials
Dried mulberry leaves were purchased from Beijing Weiren traditional Chinese Medicine Factory, China and identified botanically by Prof. Zexin Ma (School of Chinese Material Medical, Beijing University of Chinese Medicine, Beijing, China). A voucher specimen (No. 1410121) was deposited at the Beijing University of Chinese Medicine Experimental Center.
Preparation of plant extraction
The air-dried powdered leaves of Folium Mori (60 kg) were extracted with 600 L water at 70 °C for three intervals of 60, 45 and 30 min, respectively, using a reflux condenser; residuals were extracted with 20 L of 70% ethanol at 80 °C for two intervals of 1 h each. Ethyl acetate and petroleum ether were used to extract ethanol solution; the subsequent water layer was collected and ethanol was recycled. After dilution with water, a D101 macroporous resin was applied, washed with water until colourless and 30% ethanol was used for elution. Following evaporation at room temperature, 130.93 g dried extract was obtained, which contained the flavonoid and polyphenol components.
Chemicals and TCM formula
Streptozotocin (STZ) and rosiglitazone (RSG) were purchased commercially (Sigma-Aldrich, St. Louis, MO). Gorgon fruit, cherokee rose, coptis and astragalus (Huangqi) were purchased from Beijing Weiren traditional Chinese medicine factory as a standard TCM formula for the treatment of T2DM.
Animals and diet
Eight-week-old male Sprague-Dawley rats were purchased from Beijing University Science Center. Rats were kept in a 12-h light–dark cycle, maintained at 23 ± 1 °C, ad libitum. After acclimatization for 2 weeks, rats with weight of 450 ± 20 g were selected for the experiment. This study was approved by the Animal Care and Use Committee. The rats were randomly divided into five groups, with seven rats in each group as follows: normal control (NC), diabetic control (DBC), diabetic group with 0.3 mg/kg b.w./day RSG, diabetic group with 7 g/kg b.w./day TCM formula and diabetic group with 2 g/kg b.w./day Folium Mori extract (FME). During the experiment, rats were fed with commercially available high-fat rat diet. T2DM model in rats was established by feeding 10% fructose solution for the first 2 weeks followed by injection of STZ (35 mg/kg b.w.) dissolved in citrate buffer (pH 4.4), while animals in the NC group were fed with normal drinking water and injected with citrate buffer, as described previously (Govindaraj & Pillai Citation2015). Measurement of fasting blood glucose (FBG) levels were performed 72 h after STZ injection using a portable glucometer on blood collected from tail veins. Rats were considered as diabetic if FBG level >16.7 mmol/L.
Blood glucose determination
After 4 weeks of treatment, blood was collected from the tail vein and FBG level was determined using a commercial kit. Oral glucose tolerance test (OGTT) was performed on all animals on the final week of experiments (week 14). After fasting overnight (12 h), rats were orally fed a 2.0 g/kg dosage of d-glucose solution, and the subsequent blood glucose concentrations were measured after 0, 0.5, 1 and 2 h, respectively. The area under curve (AUC) was calculated as follows: AUC = 0.25 × A + 0.5 × B + 0.75 × C + 0.5 × D (A, B, C and D represented blood glucose levels at 0, 0.5, 1 and 2 h, respectively).
Serum insulin level determination
After fasting overnight (12 h), blood was collected as described above. An insulin ELISA assay kit (Life Technology, Carlsbad, CA) was used to assess serum insulin level according to the manufacturer’s protocol. Next, insulin resistance was evaluated by the homeostasis model assessment of insulin resistance index (HOMA-IR).
Collection of blood and organs
At the end of the experimental period, animals were fasted for 12 h prior to sacrifice. Blood was collected from the abdominal aorta, placed into heparin tubes and kept on ice. The blood samples were centrifuged at 3000 rpm for 15 min, and the separated serum was stored at −80 °C for further analysis. Skeletal tissues were washed with ice-cold saline, dried with filter paper and weighted. Tissue samples including liver and kidney samples were preserved at −40 °C for further analysis.
Plasma lipid profile determination
Plasma lipid profiles were measured using Automated Chemistry Analyser.
Quantitative PCR analysis
Total RNA was extracted using Trizol reagent (Life Technology, Carlsbad, CA) according to the manufacturer’s protocol. The concentration of total RNA was quantified by the absorbance at 260 nm using a Nanodrop spectrophotometer (Thermo, Waltham, MA). Reverse transcription was performed with Prime Script® RT reagent Kit (Takara, Japan) and the cDNA was prepared for real-time PCR. Real-time PCR was performed in triplicate with SYBR® Premix Ex TaqTM II RT-PCR Kit (Takara, Japan) using ABI 7900HT Fast Real-Time PCR System (Applied Biosystems Inc., Foster City, CA). Primers for IRS-1, PI3K p85α and Glut-4 were used to detect the mRNA expression level of glucose uptake-related genes in skeletal muscle, and GAPDH was selected as the internal reference gene. Primers are summarized in and were synthesized by Sangon Biotech (Shanghai, China).
Table 1. Summary of primers used in current study.
Western blot analysis
Skeletal muscle tissues were collected from individual rats and proteins were extracted using RIPA lysis buffer for 10 min, followed by centrifugation. Protein content was quantified using BCA protein measurement kit (Beyotime, China). The resulting proteins were subjected to SDS–PAGE on a 12% acrylamide gel for 0.5 h at 80 V followed by 2.5 h at 100 V. Then, the proteins were then transferred to a PVF membrane for 2 h at 300 mA using wet transfer equipment. The resulting membrane was incubated in blocking solution containing 5% BSA and incubated with primary antibodies against IRS-1 (Abcam, Cambridge, MA, Cat#: ab52167), PI3K p85α (Cell Signaling Technology, Danvers, MA, Cat#: 4292), Glut-4 (Abcam, Cambridge, MA, Cat#: ab654) and β-actin (Cell Signaling Technology, Danvers, MA, Cat#: 3700) at 4 °C overnight. After incubation with secondary antibody for 2 h at room temperature, the membrane was exposed to ECL chemiluminescent reagent (Millipore, USA) for 10 min prior to exposure. To determine protein expression, membranes were exposed to X-ray photographic films in a darkroom, and the band intensities were quantified.
Histopathological analysis
Skeletal muscles of experimental rats were fixed in 10% neutral buffered formaldehyde, dehydrated up to 100% ethanol in a graded series and subsequently embedded in paraffin. Tissue sections were cut into 5 μm thickness using a microtome and the resulting slides were stained with haematoxylin–eosin. Tissue structures were observed under light microscopy (40 × magnification).
Immunohistochemistry analysis
Paraffin embedded sections of skeletal muscles cut into 5 μm thickness were used for immunohistochemical staining. The slides were de-paraffinized and rehydrated, then dipped in 0.01 M citrate buffer (pH 6.0) using a pre-heated water bath to retrieve antigen. The paraffin sections were incubated with 3% H2O2 to quench the activity of endogenous peroxidase. Next, the sections were incubated in 3% BSA to block non-specific binding sites, simultaneously inhibiting endogenous avidin-binding activity. Immunodetection was performed according to the manufacturer’s instruction for the SABC (rabbit IgG)-POD kit. Rabbit anti-phospho-IRS-1 (Ser307), rabbit anti-IRS-1 antibody and rabbit anti-Glut-4 antibody were used (Beijing Bioss Biological Technology Co., Ltd., China) as the primary antibody, and phosphate buffer saline (PBS) was used as a negative control.
Statistical analysis
Data were represented as the mean ± standard deviation (SD). One-way analysis of variance was performed to compare the statistical difference. Significant difference was indicated by p ≤ 0.05. SPSS software version 19 for Windows (SPSS Inc., Chicago, IL) was used for statistical analysis.
Results
FME decreased body weight and improved glucose metabolism
The FBG levels of all rats are summarized in . The FBG level was significantly higher in the DBC group than in the NC group (p < 0.05); in addition, FBG was significantly lower in the TCM and FME groups than in the DBC group (p < 0.05), while no significant difference was observed between the DBC and RSG groups.
Table 2. Effect of FME on FBG, plasma insulin and HOMA-IR.
Following 4 weeks of treatment with FME, overnight-fasted rats were subjected to OGTT. Rats were orally supplemented with 2 g/kg glucose and the blood glucose levels were measured at 0 min, 30 min, 1 h and 2 h, respectively. As shown in , in the NC group, the blood glucose level peaked at 30 min before dropping to the initial level after 120 min. In the DBC group, the blood glucose level rose to a higher level than in the NC group, peaking after 1 h, but remained higher than the initial level after 2 h. In the RSG group, the blood glucose level increased significantly (p < 0.05), and this level was sustained after 1 and 2 h. In the TCM group, the blood glucose level peaked after 1 h and this level decreased slightly at 2 h. In the FME group, the blood glucose level peaked after 2 h. However, this level was lower than the measured levels in the RSG and TCM groups at 30 min, 1 h and 2 h. The results of OGTT were represented as overall AUC of measured glucose level over 2 h. As shown in , the AUCs of DBC, RSG, TCM and FME groups were significantly higher than in the NC group (p < 0.05); meanwhile, there was no significant difference between the DBC and RSG groups, as well as between the DBC and TCM groups. However, the AUC of the FME group was significantly lower than among the DBC, RSG and TCM groups (p < 0.05).
Figure 1. FME protects against glucose intolerance in diabetic rats. (A) Blood glucose level at 0 min, 30 min, 1 h and 2 h after glucose was given at the dosage of 2 g/kg weight. (B) AUC of OGTT. Data were represented as mean ± SD (n = 7). *p <0.05, compared to the NC group; #p <0.05, compared to the DBC group.
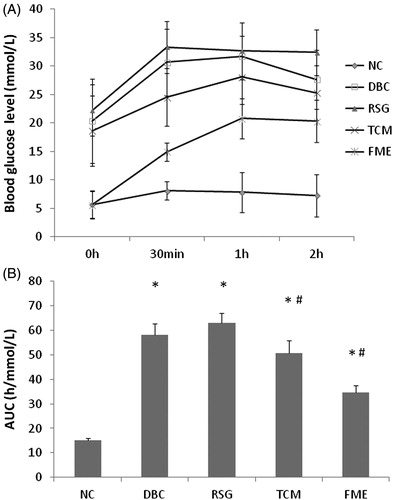
Table 3. Effect of FME on TG, TC, HDL and LDL.
As illustrated in , fasting blood insulin contents in the DBC and RSG groups were significantly higher than in the NC group. HOMA-IR level was significantly decreased in the FME group (p < 0.05), as well as in the TCM group (p < 0.05); it suggested that administration of FME in diabetic rats resulted in a significant improvement to the level of insulin resistance when compared to the DBC group.
FME decreased total cholesterol and triglycerides
As represented in , in the DBC group, total cholesterol (TC) and triglyceride (TG) levels were increased significantly compared to the NC group (p < 0.05). No significant difference was observed in high density lipoprotein (HDL) level between NC and DBC groups, although the low density lipoprotein (LDL) level was significantly higher in the DBC group than in the NC group (p < 0.05). After 4 weeks’ application of RSG, TCM and FME, both the TG and TC levels decreased significantly compared to the DBC group (p < 0.05). No significant differences among RSG, TCM, FME and DBC groups were observed. However, there was a significant decrease in LDL levels in among the RSG, TCM and FME groups compared to the DBC group (p < 0.05), suggesting that administration of FME could decrease TC, TG and LDL levels, similar to RSG and TCM.
Effect of FME on IRS-1, PI3K and Glut-4 expressions in skeletal tissue
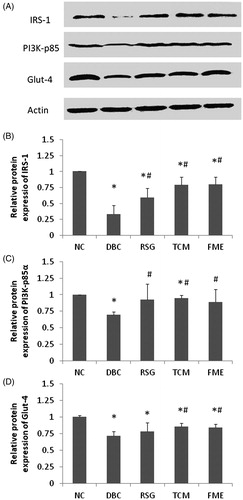
The mRNA expression levels of IRS-1, PI3K p85α and Glut-4 were determined by quantitative real-time PCR (). In the DBC group, the expression of IRS-1, PI3K p85α and Glut-4 decreased significantly (p < 0.05), compared to the NC group. In the RSG and TCM groups, mRNA expression of IRS-1, PI3K p85α and Glut-4 were slightly up-regulated compared to the DBC group (p < 0.05). In the FME group, expressions of IRS-1, PI3K p85α and Glut-4 were significantly increased compared to the DBC group (p < 0.05), reaching the equivalent levels of the NC group. There was a similar tendency in the observed protein expression levels (), where IRS-1, PI3K p85α and Glut-4 protein expression decreased significantly in the DBC group compared to the NC group. In the RSG and TCM groups, elevations in expression of IRS-1, PI3K p85α and Glut-4 were observed. In the FME group, a similar protein expression pattern to RSG and TCM groups was observed. These data suggested that administration of FME in diabetic rats could activate the IRS-1/PI3K/Glut-4 signalling.
Figure 2. Effect of FME on mRNA expression of IRS-1, PI3K and Glut-4 in skeletal tissue. Data were represented as mean ± SD (n = 7). *p <0.05, compared to the NC group; #P <0.05, compared to the DBC group.
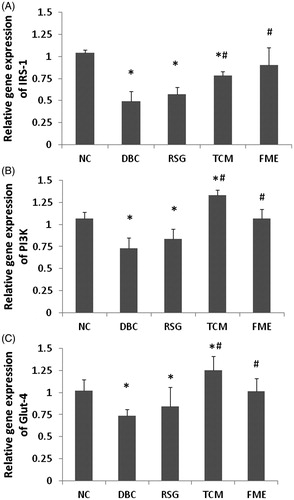
Figure 3. Effect of FME on protein expression in skeletal tissue (A). The relative expression of IRS-1 (B), PI3K (C) and Glut-4 (D) were calculated and were shown, respectively. Data were represented as mean ± SD (n = 7). *p <0.05, compared to the NC group; #p <0.05, compared to the DBC group.
FME ameliorated lipid accumulation in skeletal muscle
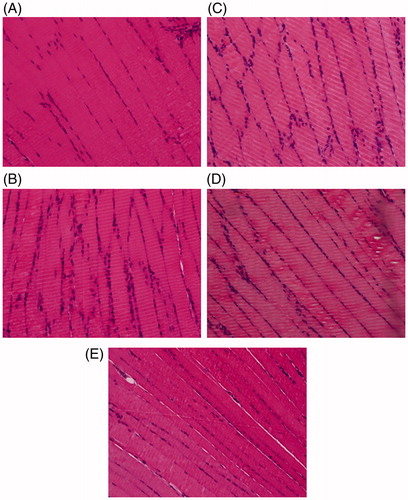
Histological examinations of skeletal tissue in experimental rats were performed (). In the NC group, regular and tightly connected skeletal muscle fibres were observed. In the DBC group, loose skeletal muscle fibres indicated an increase in lipid accumulation in skeletal muscle. In the RSG and TCM groups, lipid accumulation was also clearly observed. However, in the FME group, although lipid accumulation was visible, the connection of muscle fibres was much tighter than in the DBC, RSG and TCM groups. This result suggested that administration of FME in diabetic rats could ameliorate lipid accumulation in skeletal muscle.
Figure 4. Histological observation of skeletal tissues in experimental rats (HE staining, 40×), (A) NC group, (B) DBC group, (C) RSG group, (D) TCM group and (E) FME group.
Immunohistochemistry determination on paraffin sections
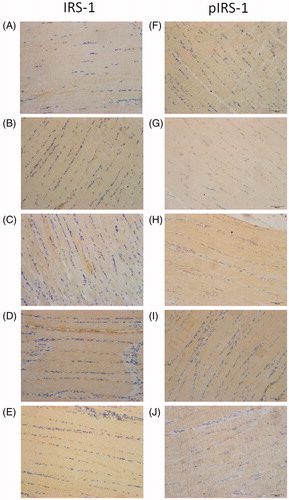
The immunohistochemical staining of IRS-1 and pIRS-1 demonstrated that skeletal tissues were completely stained in each group, with exception of the DBC group, in which pIRS-1 was weakly expressed (). Increased immunostaining of pIRS-1 could be observed in skeletal tissue of the NC, RSG and TCM groups, as well as the FME group, compared to the DBC group.
Figure 5. Immunohistochemical staining of skeletal tissues with IRS-1 and pIRS-1 in experimental rats (40× magnification). (A)–(E) represented the staining of IRS-1 in the NC, DBC, RSG, TCM and FME groups, respectively. (F)–(J) represented the staining of pIRS-1 in the NC, DBC, RSG, TCM and FME groups, respectively.
Additionally, immunohistochemical staining of Glut-4 indicated weakly visible staining in the DBC group, while stronger expressions were observed in the NC, RSG and TCM groups, as well as the FME group. The immunohistochemistry data were in accordance with the protein expression results, as previously described.
Discussion
In the current study, the effect of FME on glucose tolerance and insulin sensitivity in skeletal muscles of SD rats was investigated. A rat model of T2DM was established by application of the STZ-fed method, as previously described (Govindaraj & Pillai Citation2015). The biochemical parameters of the blood serum in response to glucose metabolism were measured to determine insulin resistance. It was established that administration of FME in diabetic rats for 4 weeks has positive effects on FBG and insulin levels. Furthermore, the application of FME significantly improved glucose tolerance in diabetic rats. Specifically, the serum glucose level at 1 and 2 h post-glucose challenge in FME treated diabetic rats was significantly lower than in DBC treated rats, as well as those in the RSG and TCM groups. Similarly, the AUC value of the FME group was significantly lower than that of DBC, RSG and TCM groups. Therefore, this study demonstrated that FME treatment had a superior effect on glucose challenge-stimulated insulin secretion, enhanced glucose metabolism and improved insulin sensitivity substantially in the skeletal muscles, a major organ of glucose metabolism.
Diabetic rats that were fed a high-fat diet were characterized by lipid abnormalities, such as higher levels of TG and TC, due to the increased mobilization of free fatty acids from peripheral deposits to central blood circulation (Veerapur et al. Citation2012). The lipid profile results obtained from the current study demonstrated that FME could reduce TC and LDL level in diabetic rats, with no effect on HDL level. Notably, hyperlipidemia could contribute to the development of hypertension and atherosclerosis, and is considered as a strong risk factor for cardiovascular disease (Cheng et al. Citation2014; Zhang et al. Citation2015). Therefore, FME may be beneficial for the potential treatment and prevention of both T2DM and cardiovascular diseases.
The association between obesity and insulin resistance has been widely investigated. In T2DM individuals, insulin-stimulated glucose deposits in skeletal muscles could be disrupted, resulting in excess fat accumulation in the myocytes (Simoneau et al. Citation1999). In addition, the change in fatty acid metabolism in skeletal muscles was associated with the development of insulin resistance (Wedick et al. Citation2009). In the current study, administration of FME in diabetic rats for 4 weeks significantly decreased the body weight, while improving abnormal fat accumulation in skeletal muscles. Therefore, FME treatment could help in reducing insulin resistance in diabetic rats.
To determine the molecular mechanism of FME, we examined the gene and protein expression of IRS-1, PI3K and Glut-4 in skeletal muscles. Biologically, insulin could interact with its receptor and thereby activating tyrosine kinase, resulting in the activation of IRS-1, PI3K p85α subunit and resulting in downstream translocation of Glut-4. Activation of the IRS-1/PI3K/Glut-4 signalling pathway could boost glucose uptake and metabolism in skeletal muscles (Xu et al. Citation2011; Hu et al. Citation2013). The insulin-stimulated glucose uptake was predominantly handled by the PI3K/PKB pathway, whereby insulin bound to IR to activate the phosphorylation of IRS proteins (Saltiel & Kahn Citation2001). In insulin resistant rats, the phosphorylation of IRS was drastically inhibited (Whelan et al. Citation2010); which corresponded to our results, as represented in . When there was a failure in the activation of insulin-related signalling pathway, this resulted in the resulting insulin resistance and glucose intolerance (Steppan et al. Citation2001; Kim et al. Citation2015). Following the phosphorylation of IRS, PI3K and PKB was activated, which activated glucose transport in skeletal tissue, and consequently, Glut-4 was translocated to the plasma membrane in order to improve glucose metabolism (Dutka et al. Citation2006; Im et al. Citation2007). During the process of T2DM, translocation of Glut-4 from vesicles to plasma membrane was impaired, and studies have reported that transcription of Glut-4 was reduced as a result (Kumar et al. Citation2009; Koren-Gluzer et al. Citation2013).
Following FME treatment, phosphorylation of IRS-1 was significantly increased in skeletal muscles compared to the DBC group, along with the gene and protein expressions of IRS-1, PI3K p85α and Glut-4. These results demonstrated that FME could be valuable for the control of insulin resistance and glucose management by activating the IRS-1/PI3K/Glut-4 signalling pathway.
Conclusion
FME could decrease TG, TC and LDL levels, improve insulin resistance, reduce body weight and lower blood glucose levels in diabetic rats. FME possessed significant antihyperglycemic and antihyperlipidemic activities through activating the IRS-1/PI3K/Glut-4 signalling pathway in skeletal muscles. Therefore, FME can be potentially used as an effective drug for the treatment of T2DM, as well as a nutritional supplement for the prevention of T2DM and cardiovascular diseases.
Funding information
The study was supported by the Fundamental Research Funds for the Central Universities of Beijing University of Chinese Medicine (No. 2013-JYBZZJS-026), Beijing; Beijing Municipal Education Commission to build the project in 2011: Technology platform constructing and prescriptions screening of Chinese medicine treatment of insulin resistance, Beijing.
Disclosure statement
The authors declare that there are no conflicts of interest.
References
- Bharani SE, Asad M, Dhamanigi SS, Chandrakala GK. 2010. Immunomodulatory activity of methanolic extract of Morus alba Linn. (mulberry) leaves. Pak J Pharm Sci. 23:63–68.
- Carnagarin R, Dharmarajan AM, Dass CR. 2015. Molecular aspects of glucose homeostasis in skeletal muscle – a focus on the molecular mechanisms of insulin resistance. Mol Cell Endocrinol. 417:52–62.
- Chan KC, Yang MY, Lin MC, Lee YJ, Chang WC, Wang CJ. 2013. Mulberry leaf extract inhibits the development of atherosclerosis in cholesterol-fed rabbits and in cultured aortic vascular smooth muscle cells. J Agric Food Chem. 61:2780–2788.
- Cheng S, Claggett B, Correia AW, Shah AM, Gupta DK, Skali H, Ni HY, Rosamond WD, Heiss G, Folsom AR, et al. 2014. Temporal trends in the population attributable risk for cardiovascular disease the atherosclerosis risk in communities study. Circulation. 130:820–828.
- Dutka DP, Pitt M, Pagano D, Mongillo M, Gathercole D, Bonser RS, Camici PG. 2006. Myocardial glucose transport and utilization in patients with type 2 diabetes mellitus, left ventricular dysfunction, and coronary artery disease. J Am Coll Cardiol. 48:2225–2231.
- Govindaraj J, Pillai SS. 2015. Rosmarinic acid modulates the antioxidant status and protects pancreatic tissues from glucolipotoxicity mediated oxidative stress in high-fat diet: streptozotocin-induced diabetic rats. Mol Cell Biochem. 404:143–159.
- Hu SW, Chang YG, Wang JF, Xue CH, Shi D, Xu H, Wang YM. 2013. Fucosylated chondroitin sulfate from Acaudina molpadioides improves hyperglycemia via activation of PKB/GLUT4 signaling in skeletal muscle of insulin resistant mice. Food Funct. 4:1639–1646.
- Im SS, Kwon SK, Kim TH, Kim HI, Ahn YH. 2007. Regulation of glucose transporter type 4 isoform gene expression in muscle and adipocytes. Iubmb Life. 59:134–145.
- Kim K, Oh CM, Ohara-Imaizumi M, Park S, Namkung J, Yadav VK, Tamarina NA, Roe MW, Philipson LH, Karsenty G. 2015. Functional role of serotonin in insulin secretion in a diet-induced insulin-resistant state. Endocrinology. 156:444–452.
- Koren-Gluzer M, Aviram M, Hayek T. 2013. Paraoxonase1 (PON1) reduces insulin resistance in mice fed a high-fat diet, and promotes GLUT4 overexpression in myocytes, via the IRS-1/Akt pathway. Atherosclerosis. 229:71–78.
- Kozlov VV, Danilov LL. 2012. Separation of polyprenyl phosphate oligomerhomologues by reversed-phase ion-pair high-performance liquid chromatography. Anal Sci. 28:1021–1023.
- Kumar R, Balaji S, Uma TS, Sehgal PK. 2009. Fruit extracts of Momordica charantia potentiate glucose uptake and up-regulate Glut-4, PPAR gamma and PI3K. J Ethnopharmacol. 126:533–537.
- Lee JY, Kim YR, Park J, Kim S. 2012. Inositol polyphosphate multikinase signaling in the regulation of metabolism. Nutr Phys Activ Aging Obes Cancer. 1271:68–74.
- Liu M, Wu K, Mao X, Wu Y, Ouyang J. 2010. Astragalus polysaccharide improves insulin sensitivity in KKAy mice: regulation of PKB/GLUT4 signaling in skeletal muscle. J Ethnopharmacol. 127:32–37.
- Nakagawa K, Ogawa K, Higuchi O, Kimura T, Miyazawa T, Hori M. 2010. Determination of iminosugars in mulberry leaves and silkworms using hydrophilic interaction chromatography–tandem mass spectrometry. Anal Biochem. 404:217–222.
- Ooms LM, Horan KA, Rahman P, Seaton G, Gurung R, Kethesparan DS, Mitchell CA. 2009. The role of the inositol polyphosphate 5-phosphatases in cellular function and human disease. Biochem J.419:29–49.
- Saltiel AR, Kahn CR. 2001. Insulin signalling and the regulation of glucose and lipid metabolism. Nature. 414:799–806.
- Simoneau JA, Veerkamp JH, Turcotte LP, Kelley DE. 1999. Markers of capacity to utilize fatty acids in human skeletal muscle: relation to insulin resistance and obesity and effects of weight loss. Faseb J. 13:2051–2060.
- Steppan CM, Bailey ST, Bhat S, Brown EJ, Banerjee RR, Wright CM, Patel HR, Ahima RS, Lazar MA. 2001. The hormone resistin links obesity to diabetes. Nature. 409:307–312.
- Sugimoto M, Arai H, Tamura Y, Murayama T, Khaengkhan P, Nishio T, Ono K, Ariyasu H, Akamizu T, Ueda Y. 2009. Mulberry leaf ameliorates the expression profile of adipocytokines by inhibiting oxidative stress in white adipose tissue in db/db mice. Atherosclerosis. 204:388–394.
- Trimarco V, Izzo R, Stabile E, Rozza F, Santoro M, Manzi MV, Serino F, Giacomo Schiattarella G, Esposito G, Trimarco B. 2015. Effects of a new combination of nutraceuticals with Morus alba on lipid profile, insulin sensitivity and endotelial function in dyslipidemic subjects. A cross-over, randomized, double-blind trial. High Blood Press Cardiovasc Prev. 22:149–154.
- Veerapur VP, Prabhakar KR, Thippeswamy BS, Bansal P, Srinivasan KK, Unnikrishnan MK. 2012. Antidiabetic effect of Ficus racemosa Linn. stem bark in high-fat diet and low-dose streptozotocin-induced type 2 diabetic rats: A mechanistic study. Food Chem. 132:186–193.
- Wedick NM, Snijder MB, Dekker JM, Heine RJ, Stehouwer CDA, Nijpels G, van Dam RM. 2009. Prospective investigation of metabolic characteristics in relation to weight gain in older adults: the Hoorn study. Obesity (Silver Spring). 17:1609–1614.
- Whelan SA, Dias WB, Thiruneelakantapillai L, Lane MD, Hart GW. 2010. Regulation of insulin receptor substrate 1 (IRS-1)/AKT kinase-mediated insulin signaling by O-linked beta-N-acetylglucosamine in 3T3-L1 adipocytes. J Biol Chem. 285:5204–5211.
- Wilson RD, Islam MS. 2015. Effects of white mulberry (Morus alba) leaf tea investigated in a type 2 diabetes model of rats. Acta Pol Pharm. 72:153–160.
- Xu TJ, Liu Y, Yuan B. 2011. Effect of insulin in combination with selenium on IRS/PI3K-mediated GLUT4 expression in cardiac muscle of diabetic rats. Eur Rev Med Pharmacol Sci. 15:1452–1460.
- Yimam M, Lee YC, Kim TW, Moore B, Jiao P, Hong M, Kim HJ, Nam JB, Kim MR, Oh JS. 2015. Analgesic and anti-inflammatory effect of UP3005, a botanical composition containing two standardized extracts of Uncaria gambir and Morus alba. Pharmacognosy Res. 7:S39–S46.
- Zhang Q, Lu Y, Ma Z, Li Y, Guo J, Meng Q, Bian H. 2015. A novel formula from mulberry leaf ameliorates diabetic nephropathy in rats via inhibiting the TGF-β1 pathway. Food Funct. 6:3307–3315.
- Zhang T, Zhang CQ, Zhang YY, Tang F, Li HK, Zhang Q, Lin HY, Wu S, Liu YX, Xue FZ. 2015. Metabolic syndrome and its components as predictors of nonalcoholic fatty liver disease in a northern urban Han Chinese population: a prospective cohort study. Atherosclerosis. 240:144–148.
- Zhang Y, Ren C, Lu G, Mu Z, Cui W, Gao H, Wang Y. 2014. Anti-diabetic effect of mulberry leaf polysaccharide by inhibiting pancreatic islet cell apoptosis and ameliorating insulin secretory capacity in diabetic rats. Int Immunopharmacol. 22:248–257.
- Zisman A, Peron OD, Abel ED, Michael MD, Mauvais-Jarvis F, Lowell BB, Wojtaszewski JF, Hirshman MF, Virkamaki A, Goodyear LJ, et al. 2000. Targeted disruption of the glucose transporter 4 selectively in muscle causes insulin resistance and glucose intolerance. Nat Med. 6:924–928.