
Abstract
Context: Hibiscus sabdariffa L. (Malvaceae) is a common traditional tea that has many biological activities.
Objectives: To evaluate the hepatoprotective effect and study the metabolic profile of the anthocyanin-rich extract of H. sabdariffa calyces (HSARE).
Materials and methods: The hepatoprotective activity of HSARE was assessed (100 mg/kg/d for 4 weeks) by examining the hepatic, inflammatory, oxidative stress markers and performing a histopathological examination in rats with thioacetamide (TAA)-induced hepatotoxicity. HSARE was analyzed using ultra-performance liquid chromatography-quadrupole-time-of-flight-photodiode array-mass spectrometry (UPLC-qTOF-PDA-MS).
Results: The UPLC-qTOF-PDA-MS analysis of HSARE enabled the identification of 25 compounds represented by delphinidin and its derivatives, cyanidin, kaempferol, quercetin, myricetin aglycones and glycosides, together with hibiscus lactone, hibiscus acid and caffeoylquinic acids. Compared to the TAA-intoxicated group, HSARE significantly reduced the serum levels of alanine aminotransferase, aspartate aminotransferase and hepatic malondialdehyde by 37.96, 42.74 and 45.31%, respectively. It also decreased hepatic inflammatory markers, including tumour necrosis factor alpha, interleukin-6 and interferon gamma (INF-γ), by 85.39, 14.96 and 70.87%, respectively. Moreover, it decreased the immunopositivity of nuclear factor kappa-B and CYP2E1 in liver tissue, with an increase in the effector apoptotic marker (caspase-3 positive cells), restoration of the altered hepatic architecture and increases in the activities of superoxide dismutase (SOD) and glutathione by 150.08 and 89.23%, respectively.
Discussion and conclusion: HSARE revealed pronounced antioxidant and anti-inflammatory potential where SOD and INF-γ were significantly improved. HSARE possesses the added value of being more water-soluble and of natural origin with fewer side effects expected compared to silymarin.
Introduction
Liver disorders, despite being a worldwide problem, still suffer from inadequate medical management. Liver cell injury can be induced by various toxicants, such as certain chemotherapeutic agents, carbon tetrachloride (CCl4), thioacetamide (TAA), chronic alcohol consumption and microbes (Agarwal Citation2001). Hepatotoxins initially damage the centrilobular region of liver, where there are high levels of cytochrome P450 oxidases that convert potential hepatotoxins to toxic intermediates, releasing reactive oxygen species (ROS) and inducing lipid peroxidation and the production of proinflammatory cytokines (Luster et al. Citation2000). Tumour necrosis factor alpha (TNF-α) and interleukin-6 (IL-6) are considered the major hepatotoxic mediators in several experimental models of liver injuries (Zhang et al. Citation2004).
Corticosteroids and antiviral drugs are considered the best conventional remedies for the treatment of liver disease despite their known adverse effects (Yang et al. Citation2008). Silymarin is one of the oldest plant products used as a hepatoprotective (Pradhan & Girish Citation2006). The drug has poor water solubility, leading to a low bioavailability. It also possesses a laxative effect and causes bloating, dyspepsia, nausea and irregular stools due to increased bile secretion and flow (Jacobs et al. Citation2002). To our knowledge, a successful and safe therapy to prevent the progression of the hepatic disease is not yet available. Hibiscus sabdariffa, as a member of the family Malvaceae (Castañeda-Ovando et al. Citation2009), shows antioxidant, antigenotoxic and biomodulatory effects on various cells in animals exposed to toxic agents (Ramirez-Rodrigues et al. Citation2011). The plant also has antimicrobial, diuretic and antihypertensive effects (Alarcon-Aguilar et al. Citation2007). Water-soluble extracts of H. sabdariffa, containing several antioxidants, such as a protocatechuic acid (Liu et al. Citation2002) and anthocyanins (Wang et al. Citation2000), have the power to prevent peroxidative liver damage (Tatsuzawa et al. Citation1994). The anthocyanin-rich extract of H. sabdariffa calyces (HSARE), which is known to be water-soluble, was reported to be useful against diseases for which oxidative stress plays a role in their aetiopathogenesis, probably through its antioxidant and free radical-defusing effects (Ozkol et al. Citation2015).
The growing interest in phytomedicine and herbal supplements drives the development of analytical methods for the quality control of multicomponent mixtures, e.g., ‘plant-derived nutraceuticals’. Concerns regarding quality control have stimulated a search for ultra-performance analytical methods (Farag et al. Citation2014). Ultra-performance liquid chromatography (UPLC) has offered new possibilities for improving analytical methods of a complex sample matrix compared to conventional high-performance liquid chromatography (HPLC). The mass analyzer quadrupole-time-of-flight mass spectrometry (qTOF/MS) combines the high performance of TOF analysis in both MS and tandem MS (MS2) modes, providing high sensitivity and high mass accuracy for both precursor and product ions (Motilva et al. Citation2013).
In this study, the advanced analytical platform UPLC-qTOF/PDA/MS was used to achieve a better separation and characterization of the phenolic compounds of HSARE. Moreover, the hepatoprotective, anti-inflammatory and antioxidant effects of HSARE were compared to those of the conventional hepatoprotective drug ‘silymarin’ in rats with TAA-induced hepatotoxicity.
Materials and methods
Chemicals and reagents
HPLC grade acetonitrile, trifluoroacetic acid (TFA) and formic acid (J. T. Baker; Deventer, Netherlands) were used, and Milli-Q water was used for the for UPLC analysis (Millipore, Merck, Darmstadt, Germany). Diaion HP-20 AG was used for the column chromatography (75–150 μm, Mitsubishi Chemical Industries Co., Ltd., Tokyo, Japan). Delphinidin, cyanidin, chlorogenic acid and quercetin were obtained from Indofine (Somerville, NJ). TAA and trichloroacetic acid (TCA) were obtained from Sigma-Aldrich Chemical Co. (St. Louis, MO) Thiobarbituric acid (TBA) was obtained from BDH Chemicals Ltd. (Poole, Dorset, United Kingdom). Silymarin ‘Legalon®’ was obtained from Chemical Industries Development (CID, Giza, Egypt). Alanine aminotransferase (ALT) and aspartate aminotransferase (AST) kits were obtained from Spectrum, MDSS (Hannover, Germany). TNF-α, IL-6 and interferon gamma (INF-γ), enzyme-linked immunosorbent assay (ELISA) complete test were obtained from Komabiotech (Seoul, South Korea), and superoxide dismutase (SOD) and glutathione (GSH) reduced kits were obtained from Biodiagnostic (Giza, Egypt).
Plant material
Calyces of H. sabdariffa were obtained from Aswan in April 2013 and authenticated by Dr. Reem Samir Hamdy, Lecturer of Plant Taxonomy, Botany Department, Faculty of Science, Cairo University, Giza, Egypt. A voucher specimen (HS-2013-65) was submitted to the herbarium of the Department of Pharmacognosy, Faculty of Pharmacy, Cairo University.
Preparation of HSARE
HSARE was prepared according to Hong and Wrolstad (Citation1990). H. sabdariffa calyces (1 kg) were pulverized and extracted with 10 l of 0.1% TFA aqueous solution for 12 h at 20 °C, and the extract was filtered and applied to a Diaion HP column. The resin was washed with 3 l of water and then eluted with 50% ethanol solution containing 0.1% TFA. The eluate was dried under vacuum at 20 °C and then freeze-dried (LyoQuest-55 freeze dryer; Telstar Life Science Company, Spain).
Sample preparation for UPLC-PDA-MS analysis
HSARE (5 mg) was homogenized with 6 ml 100% methanol (MeOH) containing 5 μg/ml umbelliferone (internal standard) using a Turrax mixer (11,000 rpm) for five 20-s periods with 1 min intervals separating each period to prevent heating. The extract was then vortexed vigorously and centrifuged at 3000 rpm for 30 min to remove debris. An aliquot of 500 μl was placed on a (500 mg) C18 cartridge preconditioned with MeOH and water. The sample was eluted using 3 ml 100% MeOH, the eluent was evaporated under a nitrogen stream, and the obtained dry residue was resuspended in 300 μl MeOH. Three microlitres of the supernatant was used for UPLC-MS analysis.
UPLC-ESI-low resolution full MS and MSn analysis
The UPLC coupled to elecrospray ionization mass spectrometry (ESI) and ESI-MSn mass spectra were obtained from an LCQ Deca XP MAX ion trap system (Thermo Scientific, San Jose) equipped with an ESI source (electrospray voltage 4.0 kV, sheath gas: nitrogen; capillary temperature: 275 °C) in both positive and negative ionization modes. The Ion Trap MS system is coupled with an ACQUITY UPLC system (Waters) equipped with an HSS T3 column (100 × 1.0 mm, particle size 1.8 μm; Waters), applying the following binary gradient at a flow rate of 150 μl min−1: 0–1 min, isocratic 95% A (water/acetic acid, 99.8/0.2 [v/v]), 5% B (acetonitrile/acetic acid, 99.8/0.2 [v/v]); 1–16 min, linear from 5 to 95% B; 16–18 min, isocratic 95% B; 18–20 min, isocratic 5% B. The injection volume was 1.5 μl (partial loop with needle overfill injection). Eluted compounds were detected from m/z 100 to 1000. The MSn spectra were recorded using the following conditions: MS/MSn analysis with starting normalized collision energy of 45% and isolation width of ±2 D in data-dependent negative and positive ionization modes.
High-resolution UPLC-MS analysis
A micrOTOF-Q hybrid qTOF-MS (Bruker Daltonics) was used for analyzing the metabolites after UPLC separation, using the Waters UHPLC setup described for the full-scan MS analysis with the same elution gradient and equipped with an Apollo II electrospray ion source in positive and negative ion modes. The instrument settings were as follows: nebulizer gas, nitrogen, 1.6 bar; dry gas, nitrogen, 6 l min−1, 190 °C; capillary, –5500 V (+4000 V); end plate offset, –500 V; funnel 1 RF, 200 Vpp; funnel 2 RF, 200 Vpp; in-source CID energy, 0 V; hexapole RF, 100 Vpp; quadrupole ion energy, 5 eV; collision gas, argon; collision energy, 10 eV; collision RF 200/400 Vpp (timing 50/50); transfer time, 70 μs; prepulse storage, 5 μs; pulser frequency, 10 kHz; spectra rate, 3 Hz. The internal mass calibration of each analysis was performed by an infusion of 20 μl of 10 mm lithium formate in isopropanol/water, 1/1 (v/v), at a gradient time of 18 min using a diverter valve. UPLC-MS files were converted to netCDF file format using the file converter tool in Xcalibur software and further processed using AMDIS software to assist in adjacent peak deconvolution and background subtraction (Halket et al. Citation1999).
Biological study
Animals
Male Sprague–Dawley rats were provided by the Schistosome Biological Supply Center, Theodor Bilharz Research Institute (TBRI), Giza, Egypt. The rats weighed 120–160 g at the beginning of the experiment and were maintained on a standard commercial pelleted diet (El-Kahira company for oils and soap, Egypt) in an air-conditioned animal house at 20–22 °C under 12 h light and dark cycles. All experiments followed international guidelines for animal ethics and were approved by the Institutional Review Board of TBRI.
Induction of hepatic toxicity
A pilot study was conducted using 24 rats to evaluate the toxicity of TAA. Rats were randomly divided into three groups (n = 8), and each was injected with TAA intraperitoneally (IP) in doses of 100, 200 or 300 mg/kg once/week for 1 month to observe the mortality rate. At the end of the experiment, the animals were sacrificed, and the livers were extracted and maintained in 10% formalin for consequent histopathological examination to select the proper dose for the induction of hepatotoxicity.
Animal groups
A total of 32 rats were divided equally into four groups of eight rats each. Group I (normal control) received the drug vehicle Cremophore-El. Groups II–IV were subjected to the induction of hepatotoxicity using an IP injection of TAA at a dose of 100 mg/kg once/week for four successive weeks. Group II was left without treatment as TAA-intoxicated rats, while groups III and IV concurrently received either silymarin or HSARE in a daily oral dose of 50 or 100 mg/kg for 5 d/week for four successive weeks, respectively. Twenty-four hours after the last dose, the animals were sacrificed, blood samples were collected and the livers were extracted and divided into two parts for histopathological examination and oxidative stress marker determination.
Biochemical assays
Sera were used to examine biochemical markers expressing hepatic damage. AST, ALT (Reitman & Frankel Citation1957) and the proinflammatory cytokines TNF-α, IL-6 and INF-γ were assayed using commercially available ELISA kits.
Oxidative stress marker determination
One gram of the liver was homogenized in five volumes (w/v) of ice-cold 0.1 M potassium phosphate buffer (pH =7.4). The homogenate was centrifuged at 1000 rpm for 10 min to remove cell debris, the supernatant was centrifuged at 20,000 rpm and the pellet was discarded. The supernatant was collected and stored at −70 °C for the estimation of the liver GSH content, SOD activity and lipid peroxidation, expressed as malondialdehyde (MDA) formation.
Liver homogenates were deproteinized in 5% (w/v) TCA and centrifuged at 3000 rpm for 20 min, and the GSH content and SOD activity were estimated (Ellman Citation1959; Winterbourn et al. Citation1975). The MDA was assayed according to Ohkawa et al. (Citation1979), and the absorbance was read, after cooling, at 530 nm against a blank containing all the reagents except the liver homogenate. The content of thiobarbituric acid reactive substances in the samples was calculated using the extinction coefficient of MDA (1.56 × 10⁵ M−1 cm−1), and the results were expressed as MDA equivalents in nmol/g liver.
Histopathological and immunohistochemical examinations
The livers were fixed in 10% formalin, embedded in paraffin wax, sliced into 5 μm thick sections on positively charged glass slides and stained with haematoxylin-eosin for examination under a Zeiss microscope with 200× magnification power. For the immunohistochemical examination, three paraffin sections were deparaffinized and rehydrated. Endogenous peroxidase was inactivated by incubation in 0.3% hydrogen peroxide in absolute MeOH for 30 min. The sections were incubated in 5% skim milk for 30 min at room temperature. Antigen retrieval was performed by microwave (700 W) treatment in 10 mm citrate buffer (pH =7.4) for 15 min. The sections were then incubated overnight at 4 °C with anti-rat caspase 3, CYP2E1 and nuclear factor kappa-B (NF-кB) primary antibodies (Abcam, Cambridge) at dilutions of 1:100 1:150 and 1:150, respectively. After washing with phosphate buffer saline (PBS), the sections were incubated at room temperature for 30 min in secondary antibodies (Abcam). A brown colour developed after the addition of 3-diaminobenzidine (DAB) for 2–4 min, followed by washing in distilled water and counterstaining with Mayer’s haematoxylin for 1 min at room temperature. The per cent of positively stained brown nuclei (NF-кB) or brown cytoplasm (caspase-3 and CYP2E1) in 10 successive fields at a magnification of 200× were calculated.
Statistical analysis
The data are expressed as the mean ± SEM. Statistical analysis of the data was performed using the one-way ANOVA test followed by Tukey’s post hoc test to determine the differences among the mean values of different groups. The data were analyzed using the SPSS software package, version 16.0 (Chicago, IL). p Values <0.05 were considered statistically significant.
Results
Identification and quantification of metabolites via UPLC-MS
Metabolites were characterized by their UV-VIS spectra (220–600 nm), retention times relative to external standards, mass spectra and comparison to a phytochemical dictionary of natural products database (Wiley, CRC) and other reference literature. The analytical method applied enabled the characterization of 25 compounds. The compounds identified using UPLC-MS analysis is listed in and and .
Figure 1. A representative UPLC-negative ionization MS trace of methanol extract of H. subdariffa flowers, peak numbers follow those listed in for metabolite identification using UPLC-PDA-MS. IS, internal standard (umbelliferone); Rt, retention time.
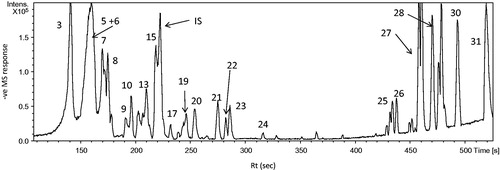
Figure 2. Structures of some identified compounds detected via UPLC-qTOF-PDA-MS analysis of H. subdarifa anthocyanin-rich extract (HSARE).
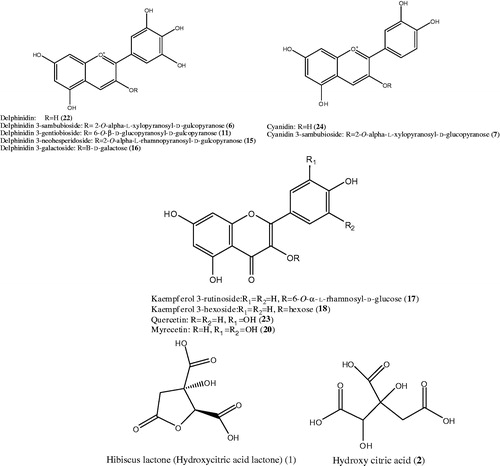
Table 1. Peak assignments of metabolites in HSARE using UPLC-PDA-MS in negative ionization mode.
Induction of hepatic toxicity
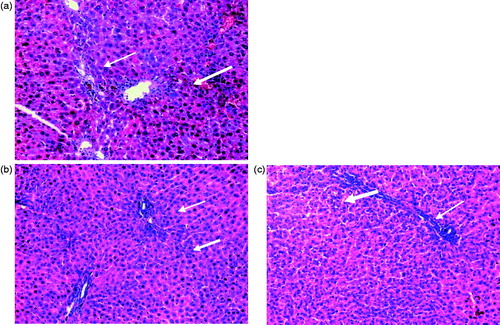
No mortality was observed with all tested doses of TAA; nevertheless, the dose of 100 mg/kg once per week for 1 month caused maximal severe focal hepatic necrosis and infiltration of chronic inflammatory cells when compared to the doses of 200 and 300 mg/kg ().
Figure 3. (a) Rats liver section injected with a single intraperitoneal dose (100 mg/kg) of TAA once per week for 1 month showing portal tract infiltration with chronic inflammatory cells (thin arrow), focal spotty necrosis (inflammatory cells in between hepatocytes, thick arrow, (b and c) rats injected with a single intraperitoneal dose (200 mg/kg or 300 mg/kg, respectively) of TAA once per week for 1 month showed portal tracts area infiltrated by moderate number of chronic inflammatory cells (thin arrow), focal spotty necrosis (thick arrow), inflammatory cells in between hepatocytes (H&E × 200).
Hepatoprotective activity study
The treatment of the TAA-intoxicated rats with HSARE at a dose of 100 mg/kg produced a significant hepatoprotective effect (). This was expressed as a significant reduction in the activities of ALT and AST (37.96 and 42.74%, respectively) compared to the TAA group. This effect was comparable to that of silymarin at a dose of 50 mg/kg.
Table 2. Effect of HSARE on hepatic marker enzymes, anti-inflammatory markers, oxidative stress and lipid peroxidation after 4 weeks of thioacetamide (TAA) intoxication in rats.
Anti-inflammatory activity study
The level of TNF-α was significantly decreased in the groups treated with either HSARE or silymarin () compared to the TAA-intoxicated rats. The level of IL-6 tended to be normal, while INF-γ was normalized in the HSARE-treated group. It is worthy to note that the effect of HSARE on TNF-α and INF-γ was more pronounced than that of silymarin.
Oxidative stress and lipid peroxidation studies
The administration of silymarin (50 mg/kg) and HSARE (100 mg/kg) produced a marked increase in GSH content (130.36 and 89.28%, respectively), improved the activity of SOD (99.41 and 150.08%, respectively) and reduced the MDA level (32.07 and 45.31%, respectively) relative to the TAA-intoxicated group (). Moreover, HSARE was more effective in improving the MDA level and SOD activity when compared with silymarin ().
Histopathological and immunohistochemical examinations
When compared to the normal rats (), TAA-intoxicated rats () showed severe disturbances of the normal architecture of the hepatic tissue and portal tract inflammation with severe lymphocyte infiltration and focal spotty necrosis. On the other hand, the HSARE and silymarin-treated rats ( and , respectively) showed almost normal hepatic architectural patterns with only minor chronic inflammatory cell infiltration. The immunohistochemical examination of caspase-3 showed no significant difference in the TAA-intoxicated group compared to normal, while in the silymarin and HSARE-treated groups, the number of positive cells increased by 4.4- and 6.4-fold, respectively, when compared to the normal control group. In TAA-intoxicated rats, the percentages of positive cells of NF-кB and CYP2E1 were significantly elevated. Meanwhile, treatment with either silymarin or HSARE resulted in significant reductions in both NF-кB and CYP2E1 (4.3- and 3.9- and 3.4- and 4.5-fold, respectively) compared to the TAA-intoxicated group ( and ).
Figure 4. Histopathological examination of liver sections from normal untreated rats (a) showing normal hepatic architectecture, TAA-intoxicated (100 mg/kg) rats (b) showing severely disturbed hepatic architecture and portal tract inflammation with severe lymphocyte infiltration (thick arrow) and focal spotty necrosis (thin arrow), silymarin-treated (50 mg/kg) rats (c) showing almost normal hepatic architectural pattern with mild ballooning of hepatocytes, mild dilation of sinusoids and lymphocyte infiltration and HSARE-treated (100 mg/kg) rats (d) showing normal hepatic architecture with mild ballooning of hepatocytes and mild number of chronic inflammatory cells infiltration (H&E × 200).
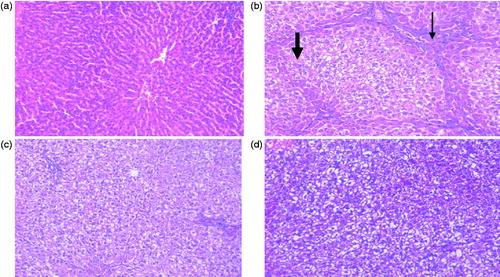
Figure 5. Bar graphs represent liver (n = 6) per cent of hepatocytes with positively stained brown cytoplasm (caspase-3 and CYP2E1) or brown nuclei (NF-κB), in 10 successive fields. aSignificantly different from normal control at p < 0.05. bSignificantly different from TAA at p < 0.05.
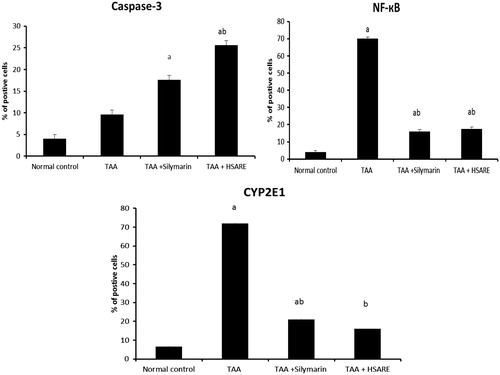
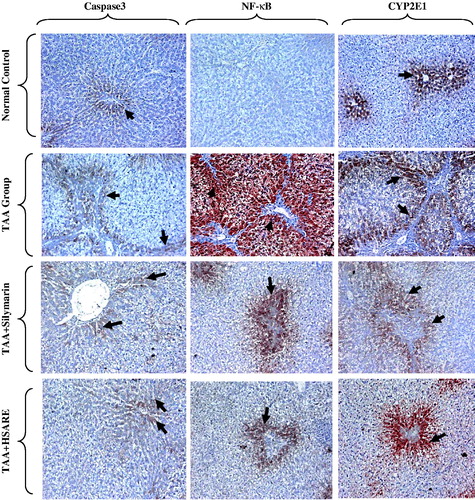
Figure 6. Immunohistochemical staining of rat liver sections for caspase-3, NF-κB and CYP2E1, showing normal control rats with few number of positive hepatocytes for caspase-3, NF-КB and CYP2E1 appearing as brownish stain (black arrows), TAA-intoxicated (100 mg/kg) rats showing few positive hepatocytes (centrilobular and periportal areas) with mild density for caspase-3, and many positive hepatocytes (centrilobular and periportal areas) with severe density for NF-κB and CYP2E1 (black arrows), and silymarin and HSARE-treated rats (50 and 100 mg/kg, respectively) showing moderate number of positive hepatocytes (periportal areas) with moderate density (periportal areas) for caspase-3 NF-κB and CYP2E1 (black arrows), (IHC, DAB, × 200).
Discussion
To our knowledge, this current study is the first report of the metabolic profiling of HSARE using UPLC-qTOF-PDA-MS. The analytical method applied enabled the characterization of 25 compounds. For determining the structures of these compounds, the UV-VIS spectra and HPLC retention characteristics were first considered. The compounds associated with peaks 4, 6, 11, 15 and 22 showed λ maxes at 277, 330 and 500 nm, which suggests that they might be delphinidin derivatives (Giusti et al. Citation1999). Peak 6 showed a molecular ion at m/z 595.1311 that produced a unique MS2 fragment at m/z 301 (delphinidin). The direct loss of 294 amu [− (162 + 132)] indicates the separation of a disaccharide (hexose + pentose) residue (Giusti et al. Citation1999). This suggestion is also supported by the existence of a shoulder approximately 440 nm in the UV-VIS spectrum of this peak, characterized by 3-glycosylated anthocyanidins (Santos-Buelga et al. Citation2003). The sugar moiety was identified as sambubiose (2-O-β-d-xylosyl-d-glucose), which is most frequently found as an anthocyanin substituent (Mazza & Miniati Citation1993). Peak 6, identified as delphinidin-3-sambubioside (hibiscin) (C26H27O16), was previously identified in the calyx of H. sabdariffa (Williamson et al. Citation2013). Mass data of Peak 4 showed a molecular ion peak at m/z 681.1285 and MS2 at m/z 595 (M-86) and 301 [(M-86)-294]. These were indicative of a delphinidin with a malonic acid moiety (86 amu) and hexose and pentose moieties (294 amu). The UV-VIS spectrum of this peak was characteristic of 3-substituted anthocyanidin. The loss of the malonic acid followed by the two sugars together may indicate that the acyl and sugar residues are attached to the same position. This compound was tentatively identified as delphinidin hexosyl pentosyl malonate (C29H29O19).
Peak 11 showed a molecular ion at m/z 625.1394 and a MS2 at m/z 301 with a loss of 324 amu (162 + 162), corresponding to two hexose molecules; this compound was regarded as delphinidin-3-gentiobioside (C27H29O17). Delphinidin-3-neohesperidoside was assigned to peak 15 based on the MS, showing a molecular ion at m/z 609.1465 for the molecular formula C27H29O16 and MS2 at m/z 301 [M-(162 of glucose +146 of rhamnose)]. These data were in agreement with the fragmentation pattern of the compound. Peak 16 with m/z 463.0884 was characterized as delphinidin-3-galactoside (C21H19O12), as it showed a base peak at m/z 301 [M-162], which corresponds to the loss of a hexose molecule. Peak 19 was identified as dimethyl-delphinidin-glucosyl acetate (C25H25O13), with a base peak m/z 595.1311 corresponding to [M-H]− and MS2 at m/z 371 (M-162) and 329 [(M-162)-CH3CO], assigned to the sequential loss of glucose then an acetyl group. Peak 22, with a base peak [M-H]− at m/z 301.0357, corresponds to the molecular formula C15H9O7 and was identified as delphinidin (aglycone); MS2 at [(M-H)-122] and [(M-H- 122)-28] were assigned for retro Diels–Alder fission and the loss of CO, respectively. Delphinidin was previously identified in the flowers of H. sabdariffa (Mahadevan et al. Citation2009). In addition, an unknown delphinidin derivative at peak 5 with a molecular ion at m/z 613.1416 corresponds to the formula C26H29O17. Another group of anthocyanins were cyanidin and its derivatives, which were detected as peak 7, exhibited a fragmentation pattern, absorption spectrum and sugar identification similar to those of peak 6. This compound showed a molecular ion at m/z 579.1354 that produced an MS2 fragmentation pattern, permitted a fragment ion to be distinguished at 285, corresponding to cyanidin due to the loss of 294 amu, which corresponded to glucose–xylose loss. Thus, this compound was characterized as cyanidin-3-sambubioside. This compound was previously reported in the calyx of H. sabdariffa (Herranz-Lopez et al. Citation2012). Peak 24 shows a molecular ion at m/z 285.0763 [M-H]−, corresponding to the molecular formula C15H9O6 and assigned to cyanidin (aglycone).
Flavonoids were also detected and were represented by seven compounds. Peaks 9 and 10 exhibited the same molecular ion at m/z 611.1255 in MS spectra, characterized as myricetin-3-arabinogalactose (C26H27O17). The examination of their respective MS2 fragmentation patterns allowed one main fragment ion to be distinguished at 317, which corresponds to the aglycone myricetin and the loss of an arabino-galactose moiety. Thus, these compounds were characterized as two isomers and were previously reported in H. sabdariffa (Herranz-Lopez et al. Citation2012). Peak 12 was identified as gossypetin-3-glucoside (gossytrin) (C21H19O13) with a molecular ion peat at m/z 479.0837 based on its MS2 fragmentation pattern and the published data. Gossypetin-3-glucoside (gossytrin) was previously identified in the calyx of H. sabdariffa (Williamson et al. Citation2013). Peak 13 showed [M-H]− at m/z 595.1411 with a formula C26H27O16 characterized as quercetin 3-sambubioside. The MS2 of this ion revealed fragments at m/z 463, indicating the loss of xylose (132 amu) and 301, indicating the loss of glucose (162 amu), which was also confirmed by its UV spectral data. Quercetin had already been identified in H. sabdariffa (Herranz-Lopez et al. Citation2012). Peak 17 was identified as kaempferol-3-O-rutinoside (C27H29O15), with a molecular ion peak at m/z 593.1613. Its MS2 pattern gave rise to a fragment ion at m/z 285 assigned to the sequential loss of rhamnose and glucose. Peak 18 showed a molecular ion of m/z 447 (C21H19O11), which yielded a daughter fragment of m/z 285, assigned to kaempferol aglycone with a loss of 162 amu (a hexose moiety), and was tentatively identified as kaempferol-hexoside. Finally, the non-polar peaks 20 and 23 showed molecular ions at m/z 317.0358 and 301.0405, referred to myricetin and quercetin, respectively.
The phenolic acids mainly included caffeic acid derivatives and were detected as two peaks 3 and 8 characterized by an ion at m/z 353.0939 with a formula C16H17O9 and identified as O-caffeoylquinic acid (Borrás-Linares et al. Citation2015). The MS2 of the two compounds were 191.0594, corresponding to the loss of a caffeoyl moiety (162 amu) and the presence of a quinic acid moiety (191 amu). This is in accordance with the fragmentation pattern of O-caffeoyl quinic acid. Peak 14 corresponds to O-caffeoyl shikimic acid, identified by an ion at m/z 335.0835 with a formula C16H15O8. The MS2 of the compound was at 161 amu, corresponding to the loss of shikimic acid (174 amu), and it was previously reported in H. sabdariffa (Herranz-Lopez et al. Citation2012). Organic acids, such as citric acid derivatives, were represented by peak 1, corresponding to hibiscus lactone (hydroxy citric acid lactone) with an ion peak at m/z 189.0057 and a formula (C6H5O7). Peak 2 with an ion at m/z 207.015 with a formula C6H7O8 corresponds to the [M-H]− characterized for hibiscus acid (hydroxy citric acid). The MS2 of the compound revealed two peaks at 189 and 129. These two acids were previously reported in the calyces of H. sabdariffa (Herranz-Lopez et al. Citation2012; Borrás-Linares et al. Citation2015).
A tyramine derivative was also detected and represented as peak 21 with [M-H]− at m/z 312.1293, corresponding to the formula (C18H18NO4) characterized for N-feruloyltyramine. The MS2 of the compound exhibited an ion peak at 179 and was previously isolated from the stem of H. tiliaceus (Chen et al. Citation2006a). Peaks 32 and 33, corresponding to fatty acids, were identified as linoleic and palmitic acids, with ions at m/z 279.2378 and 255.2369, respectively.
In this study, the hepatoprotective activity of HSARE was examined in rats with TAA-induced hepatotoxicity. The TAA hepatotoxicity was more evident for the dose of 100 mg/kg once/week for 4 weeks than with higher doses of 200 or 300 mg/kg. The lesser hepatotoxicity with the higher doses may be related to the possible competition between TAA in high doses and its intermediate metabolite, thioacetamide S,S-dioxide (TASO), hindering its progression to the second reactive metabolite, TASO2, which is capable of reacting with proteins, leading to the impairment of liver function (Hajovsky et al. Citation2012).
The dose of HSARE (100 mg/kg) selected was based on the earlier studies of Wang et al. (Citation2000) and Adetutu and Owoade (Citation2013), who demonstrated its effective antioxidant and hepatoprotective activities. In this work, HSARE demonstrated a significant hepatoprotective effect that was expressed as reductions in ALT and AST. Its effect was comparable to that of silymarin at a dose of 50 mg/kg. Significant reductions in the levels of these enzymes were recorded upon treatment with HSARE in mice with CCl4-induced hepatotoxicity (Usoh et al. Citation2012).
Regarding the antioxidant activities or free radical scavenging, leading to the prevention and treatment of acute and chronic liver diseases (Bruck et al. Citation2004), silymarin (50 mg/kg) and HSARE (100 mg/kg) were found to significantly reduce lipid peroxidation and increase endogenous antioxidant activity, with a marked increase in hepatic GSH, improvement in SOD and reduction in the MDA level recorded. These enzymes (GSH and SOD) were significantly reduced with an increased level of MDA in TAA-intoxicated rats. Silymarin was reported to significantly reduce lipid peroxidation and increase endogenous antioxidants of SOD, CAT and GSH (Kiruthiga et al. Citation2007). Although the antioxidant effects of silymarin and HSARE were comparable with respect to GSH and MDA, HSARE showed significant improvement with respect to SOD when compared to silymarin.
With respect to inflammatory cytokines, the results revealed normalized levels of almost all examined cytokines (TNF-α and IL-6) in silymarin and HSARE-treated rats, apart from INF-γ, which was not normalized in silymarin-treated rats. Both HSARE (Okoko & Ere Citation2012) and silymarin (Gazák et al. Citation2007; Saller et al. Citation2008) were reported to significantly reduce the levels of inflammatory cytokines. The significant improvement in all examined inflammatory cytokines as a result of HSARE could be related to an immunoprotective effect, in addition to its known anti-inflammatory activity reported by Okoko and Ere (Citation2012), who recorded reductions in nitric oxide and catalase activities that are essential for the activation of macrophages. The normalization of inflammatory cytokines was supported by histopathological and immunohistochemical examinations, where both silymarin and HSARE resulted in positive histopathological changes as a result of TAA intoxication, which was revealed as fewer chronic inflammatory cells and diminished hepatic necrosis. The NF-кB and CYP2E1 levels were also significantly less, indicating almost the same mechanism of action for HSARE and silymarin to suppress hepatic injuries caused by TAA. Luster et al. (Citation2000) demonstrated that silymarin has a cytoprotective effect, leading to the inhibition of the transcription of NF-кB, responsible for the regulation of various genes involved in the inflammatory process.
Concerning apoptosis, both HSARE and silymarin increased caspase-3 activity, which may cause the upregulation of apoptosis or the renewal of liver tissue to remove the necrotic tissue as a result of TAA intoxication. TAA-induced toxicity was reported to cause the upregulation of the Bax protein and the downregulation of the antiapoptotic protein Bcl-2 and its translocation into the mitochondria, causing apoptosis (Chen et al. Citation2006b), while other studies suggested that the release of ROS as a result of TAA biotransformation may cause centrilobular necrosis (Sarkar & Sil Citation2007). Some plant extracts, such as Curcuma longa extract (Salama et al. Citation2013a), and some antioxidants, such as α-lipoic acid (Moungjaroen et al. Citation2006), curcumin, curcuminoids (Wang et al. Citation2012), Boesenbergia rotunda and silymarin (Salama et al. Citation2013b), were shown to induce apoptosis.
The effects of HSARE and silymarin were comparable with respect to their hepatoprotective, antioxidant and anti-inflammatory activities, with only minute differences in SOD and INF-γ, which were not significantly improved in silymarin-treated rats. The hepatoprotective effect of HSARE could be attributed to its delphinidin and cyanidin derivatives, reported to possess antioxidative effects (Wawer Citation2001). In this study, UPLC-qTOF/PDA/MS as a method of separation permitted better separation and characterization, which allows room for an increase in the dose with expected higher hepatoprotective effects.
Conclusion
The findings in this study revealed a higher sensitivity and mass accuracy upon the use of UPLC-qTOF-PDA-MS, where 25 compounds were critically identified. Concerning the hepatoprotective and anti-inflammatory potential, both silymarin and HSARE showed comparable effects, although HSARE showed significantly higher improvements in both SOD and INF-γ. HSARE also possessed the added value of being more water-soluble and of natural origin with fewer expected side effects, contrary to silymarin, which is a semi-synthetic preparation and known to possess side effects, e.g., diarrhoea, bloating, dyspepsia, nausea and irregular stool, due to increased bile secretion and bile flow. Future work will involve testing higher doses of HSARE.
Acknowledgements
The authors are deeply grateful to Dr Mohamed Farag, Associate Professor at the Faculty of Pharmacy, Cairo University for performing the UPLC-MS analysis.
Disclosure statement
The authors declare that they have no financial conflicts of interest.
Funding
This work was supported by internal research project 101/A for basic and applied research, a grant from the Theodor Bilharz Research Institute.
References
- Adetutu A, Owoade AO. 2013. Hepatoprotective and antioxidant effect of Hibiscus polyphenol rich extract (HPE) against carbon tetrachloride (CCl4)-induced damage in rats. Br J Med Med Res. 3:1574–1586.
- Agarwal SS. 2001. Development of hepatoprotective formulations from plant sources. In: Gupta SK, editor. Pharmacology and therapeutics in the new millennium. New Delhi: Narosa Publishing House; p. 357–358.
- Alarcon-Aguilar FJ, Zamilpa A, Perez-Garcia MD, Almanza-Perez JC, Romero-Nuñez E, Campos-Sepulveda EA, Vazquez-Carrillo LI, Roman-Ramos R. 2007. Effect of Hibiscus sabdariffa on obesity in MSG mice. J Ethnopharmacol. 114:66–71.
- Borrás-Linares I, Fernández-Arroyoa S, Arráez-Romana D, Palmeros-Suárez PA, Del Val-Díaz R, Andrade-Gonzáles I, Fernández-Gutiérrez A, Gómez-Leyva JF, Segura-Carretero A. 2015. Characterization of phenolic compounds, anthocyanidin, antioxidant and antimicrobial activity of 25 varieties of Mexican Roselle (Hibiscus sabdariffa). Ind Crop Prod. 69:385–394.
- Bruck RR, Aeed H, Avni Y, Shirin H, Matas Z, Shahmurov M. 2004. Melatonin inhibits nuclear factor kappa B activation and oxidative stress and protects against thioacetamide induced liver damage in rats. J Hepatol. 40:86–93.
- Castañeda-Ovando A, Pacheco-Hernández ML, Páez-Hernández ME, Rodríguez JA, Galán-Vidal CA. 2009. Chemical studies of anthocyanins: a review. Food Chem. 113:859–871.
- Chen JJ, Huang SY, Duh CY, Chen IS, Wang TC, Fang HY. 2006a. A new cytotoxic amide from the stem wood of Hibiscus tiliaceus. Planta Med. 72:935–938.
- Chen LH, Hsu CY, Weng CF. 2006b. Involvement of P53 and Bax/Bad triggering apoptosis in thioacetamide-induced hepatic epithelial cells. World J Gastroenterol. 12:5175–5181.
- Ellman GL. 1959. Tissue sulfhydryl groups. Arch Biochem Biophys. 82:70–77.
- Farag MA, Gad HA, Heiss AG, Wessjohann LA. 2014. Metabolomics driven analysis of six Nigella species seeds via UPLC-qTOF-MS and GC-MS coupled to chemometrics. Food Chem. 151:333–342.
- Gazák R, Walterová D, Kren V. 2007. Silybin and silymarin – new and emerging applications in medicine. Curr Med Chem. 14:315–338.
- Giusti MM, Rodriguez-Saona LE, Griffin D, Wrolstad RE. 1999. Electrospray and tandem mass spectroscopy as tools for anthocyanin characterization. J Agric Food Chem. 47:4657–4664.
- Hajovsky H, Hu G, Koen Y, Sarma D, Cui W, Moore DS, Staudinger JL, Hanzlik RP. 2012. Metabolism and toxicity of thioacetamide and thioacetamide S-oxide in rat hepatocytes. Chem Res Toxicol. 25:1955–1963.
- Halket JM, Przyborowska A, Stein SE, Mallard WG, Down S, Chalmers RA. 1999. Deconvolution gas chromatography/mass spectrometry of urinary organic acids – potential for pattern recognition and automated identification of metabolic disorders. Rapid Commun Mass Spectrom. 13:279–284.
- Herranz-López M, Fernández-Arroyo S, Pérez-Sanchez A, Barrajón-Catalan E, Beltrán-Debon R, Menéndez JA, Alonso-Villaverde C, Segura-Carretero A, Joven J, Micol V. 2012. Synergism of plant-derived polyphenols in adipogenesis: perspectives and implications. Phytomedicine 19:253–261.
- Hong V, Wrolstad RE. 1990. Use of HPLC separation/photodiode detection for characterization of anthocyanins. J Agric Food Chem. 38:708–715.
- Jacobs PB, Dennehy C, Ramirez G, Sapp J, Lawrence VA. 2002. Milk thistle for the treatment of liver disease: a systematic review and meta-analysis. Am J Med. 113:506–515.
- Kiruthiga PV, Shafreen RB, Pandian SK, Devi KP. 2007. Silymarin protection against major reactive oxygen species released by environmental toxins: exogenous H2O2 exposure in erythrocytes. Basic Clin Pharmacol Toxicol. 100:414–419.
- Liu CL, Wang JM, Chu CY, Cheng MT, Tseng TH. 2002. In vivo protective effect of protocatechuic acid on tert-butyl hydroperoxide induced rat hepatotoxicity. Food Chem Toxicol. 40:635–641.
- Luster MI, Simeonova PP, Gallucci RM, Matheson JM, Yucesoy B. 2000. Immunotoxicology: role of inflammation in chemical-induced hepatotoxicity. Int J Immunopharmacol. 22:1143–1147.
- Mahadevan N, Shivali A, Kamboj P. 2009. H. sabdariffa Linn – an overview. Nat Prod Rad. 8:77–83.
- Mazza G, Miniati E. 1993. Anthocyanins in fruits, vegetables and grains. Boca Raton, FL: CRC Press.
- Motilva MJ, Serra A, Macià A. 2013. Analysis of food polyphenols by ultra high-performance liquid chromatography coupled to mass spectrometry: an overview. J Chromatogr A. 1292:66–82.
- Moungjaroen J, Nimmannit U, Callery PS, Wang L, Azad N, Lipipun V, Chanvorachote P, Rojanasakul Y. 2006. Reactive oxygen species mediate caspase activation and apoptosis induced by lipoic acid in human lung epithelial cancer cells through Bcl-2 down-regulation. J Pharmacol Exp Ther. 319:1062–1069.
- Ohkawa H, Ohishi N, Yagi K. 1979. Assay for lipid peroxides in animal tissues by thiobarbituric acid reaction. Anal Biochem. 95:351–358.
- Okoko T, Ere D. 2012. Hibiscus sabdariffa extractivities on cadmium-mediated alterations of human U937 cell viability and activation. Asian Pac J Trop Med. 5:33–36.
- Ozkol HU, Koyuncu I, Tuluce Y, Dilsiz N, Soral S, Ozkol H. 2015. Anthocyanin-rich extract from Hibiscus sabdariffa calyx counteracts UVC-caused impairments in rats. Pharm Biol. 53:1435–1441.
- Pradhan SC, Girish C. 2006. Hepatoprotective herbal drug, silymarin from experimental pharmacology to clinical medicine. Indian J Med Res. 124:491–504.
- Ramirez-Rodrigues MM, Plaza ML, Azeredo A, Balaban MO, Marshall MR. 2011. Physicochemical and phytochemical properties of cold and hot water extraction from Hibiscus sabdariffa. J Food Sci. 76:428–435.
- Reitman S, Frankel S. 1957. A colorimetric method for the determination of serum glutamic oxalacetic and glutamic pyruvic transaminases. Am J Clin Pathol. 28:56–63.
- Salama SM, Abdulla MA, AlRashdi AS, Hadi AA. 2013a. Mechanism of hepatoprotective effect of Boesenbergia rotunda in thioacetamide-induced liver damage in rats. Evid Based Complement Alternat Med. 2013:1–13.
- Salama SM, Abdulla MA, AlRashdi AS, Ismail S, Alkiyumi SS, Golbabapour S. 2013b. Hepatoprotective effect of ethanolic extract of Curcuma longa on thioacetamide induced liver cirrhosis in rats. BMC Complement Altern Med. 13:56–73.
- Saller R, Brignoli R, Melzer J, Meier R. 2008. An updated systematic review with meta-analysis for the clinical evidence of silymarin. Forsch Komplementmed. 15:9–20.
- Santos-Buelga C, García-Viguera C, Tomás-Barberán FA. 2003. On-line identification of flavonoids by HPLC coupled to diode array detection. In: Santos-Buelga C, Williamson G, editors. Methods in polyphenol analysis. The Royal Society of Chemistry: Cambridge; p. 92–127.
- Sarkar MK, Sil PC. 2007. Hepatocytes are protected by herb Phyllanthus niruri protein isolate against thioacetamide toxicity. Pathophysiology 14:113–120.
- Tatsuzawa F, Saito N, Yokoi M. 1994. An acylated cyanidin glycoside in the red-purple flowers of x Laeliocattleya cv mini purple. Phytochemistry 37:1179–1183.
- Usoh IF, Ekaidem IS, Etim OE, Akpan HD, Akpan EJ, Fakoya A. 2012. Antioxidant and hepatoprotective effects of dried flower extracts of H. sabdariffa L. on rats treated with carbon tetrachloride. J Appl Pharm Sci. 2:156–159.
- Wang CJ, Wang JM, Lin WL, Chu CY, Chou FP, Tseng TH. 2000. Protective effect of Hibiscus anthocyanins against tert-butyl hydroperoxide-induced hepatic toxicity in rats. Food Chem Toxicol. 38:411–416.
- Wang ME, Chen YC, Chen IS, Hsieh SC, Chen SS, Chiu CH. 2012. Curcumin protects against thioacetamide induced hepatic fibrosis by attenuating the inflammatory response and inducing apoptosis of damaged hepatocytes. J Nutr Biochem. 23:1352–1366.
- Wawer I. 2001. Anthocyanidins, structure and antioxidant properties. Farm Pol. 15:728–731.
- Williamson EM, Driver SB, Baxter K. 2013. Stockley’s herbal medicines interactions: a guide to the interactions of herbal medicines, dietary supplements and nutraceuticals with conventional medicines. London: Pharmaceutical Press.
- Winterbourn CC, Hawkins RE, Brian M, Carrell RW. 1975. The estimation of red cell superoxide dismutase activity. J Lab Clin Med. 85:337–341.
- Yang VS, Ahn TH, Lee JC, Moon CJ, Kim SHO, Jun W. 2008. Protective effects of pycnogenol on carbon tetrachloride-induced hepatotoxicity in Sprague-Dawley rats. Food Chem Toxicol. 46:380–387.
- Zhang LJ, Yu JP, Li D, Huang YH, Chen ZX, Wang XZ. 2004. Effects of cytokines on carbon tetrachloride-induced hepatic fibrogenesis in rats. World J Gastroenterol. 10:77–81.