
Abstract
Context: Sempervivum davisii Muirhead (Crassulaceae) is a traditional medicinal herb from Eastern Anatolia. To date the composition of phytochemicals and physiological properties of this herb were not subjected to any research.
Objective: This study identifies compounds in S. davisii hydrophilic extracts and evaluates their potential biological properties.
Materials and methods: Ethanol-based lyophilized extracts were obtained from aerial parts of plant (10 g of ground dry plant material in 200 mL of acidified aqueous ethanol, shaken for 2 h at 22 °C with supernatant collected and freeze-dried under vacuum). Phytochemical composition was investigated by liquid chromatography mass spectrometry (LC-MS/MS, phenolics) and gas chromatography mass spectrometry (GC-MS, volatiles). Phenolic compounds were quantified by high-performance liquid chromatography (HPLC) and the Folin–Ciocalteu assay. Subsequently, antioxidant capacity [ferric reducing antioxidant power (FRAP), oxygen radical absorbance capacity (ORAC) assays] and enzyme inhibitory properties (isolated porcine pancreatic lipase) of the extracts were determined.
Results: Polyphenolic compounds were the main constituents of lyophilized extracts, among which kaempferol glycosides and quercetin hexoside dominated. The extracts exhibited potent antioxidant (FRAP values of 1925.2–5973.3 μM Fe2+/g DW; ORAC values of 1858.5–4208.7 μM Trolox Eq./g DW) and moderate lipase inhibitory (IC50: 11.6–2.96 mg/mL) activities. Volatile compounds (nonanal, dehydroxylinalool oxide isomers, 2-decenal, 2-undecenal, 2,6-di-tetr-butylphenol) were also found.
Conclusions: Phenolic compounds with the dominating kaempferol and quercetin derivatives are the sources of potent antioxidant properties of S. davisii hydrophilic extracts. The extracts exhibit moderate inhibitory properties towards isolated pancreatic lipase.
Introduction
The genus Sempervivum (Crassulaceae) comprises approximately 50 species of wild-growing succulent perennial plants, spread in arid areas of Mediterranean countries from Spain to Minor Asia. Numerous Sempervivum species are utilized in traditional medicine to cure common ailments. In Turkey fresh juice from squeezed leaves of various Sempervivum plants is extensively used to treat earache and dermatophyte infections (Yeşilada et al. Citation1999). Among botanicals, S. tectorum L. is frequently used in Europe to relieve pain and sore ailments, particularly earache and ear inflammation, warts, ulcers, skin rash, insect bites and headache (Bremness & Norman Citation1995; Alberti et al. Citation2012). Extract of the same plant exhibited antioxidant properties in vitro (Kerry et al. Citation1992) and in vivo (Muselin et al. Citation2014), significant antinociceptive (Alberti et al. Citation2012) and lipid-lowering activities in rats (Blazovics et al. Citation1993, Citation1994). Another Sempervivum species, S. armenum Boiss. Et Huet. was reported to be used by traditional healers in Turkey to treat cancer (Novaretti & Lemordant Citation1990).
Sempervivum davisii Muirhead from the north-eastern Anatolia region of Turkey is a perennial herb. Flowers are ovate to lanceolata, with yellowish petals. The leaves are thick, growing in a rosette. Young rosette leaves have scattered glandular hairs (Davis Citation1972). This species closely resemble S. armenum with the exception that S. armenum rosette leaves are glabrous when mature. Distinguishing these two Sempervivum species in the wild is difficult and therefore both species are equally utilized by the local population of Eastern Anatolia as a traditional herbal medicine.
To date the phytochemical composition of S. davisii extracts and their physiological activities were not reported. Therefore, the present study investigates the composition and potential biological properties of lyophilized hydrophilic extracts obtained from S. davisii stems, leaves and flowers.
Materials and methods
Plant materials
Sempervivum davisii plants (approximately 2 kg fresh weight) were harvested in Görecek Village, Şevkii Huseyin Place, Muradiye, Van City, in the Eastern Anatolia Region of Turkey, (GPS coordinates 39° 05' 03.94" N; 43°41' 33.36" E) in August, 2014. Their identity was confirmed by Muzaffer Mukemre at the Biological Sciences Department, Science Faculty, Yuzuncu Yil University, Turkey, according to the Flora of Turkey, volume 4 (Davis Citation1972) and a voucher specimen was deposited at the university’s herbarium (Herbarium code: VANF-164637; Collector code: MM336). The stems, leaves and flowers of fresh plants were divided, cleaned and dried at room temperature in the dark until dry. Subsequently, the samples were ground and stored at −20 °C until analyzed.
Reagents
Unless otherwise stated, all chemicals were purchased from Sigma-Aldrich Inc. (St. Louis, MO) and were of analytical or HPLC grade. Porcine pancreatic lipase (type II) and orlistat were purchased from Sigma-Aldrich, Inc. (Sydney, Australia). Folin–Ciocalteu reagent was purchased from Merck (Darmstadt, Germany).
Preparation of lyophilized extracts
The lyophilized extracts were prepared as described previously (Dalar & Konczak Citation2013). Briefly, the ground plant material was mixed with a 20-fold volume of acidified ethanol (80% ethanol, 19.9% H2O and 0.1% trifluoroacetic acid, v/v/v), shaken for 2 h at room temperature (22 °C) and centrifuged for 20 min (15,320 g) at 4 °C (Sorvall RC-5B; DuPont, Wilmington, DE; rotor Beckman JA14 (137 mm) serial No. 02U8152; Thermo Fisher Scientific, Waltham, MA) with the supernatant collected. The supernatants from the consecutive extractions were combined. Solvent was evaporated under reduced pressure at 40 °C. The derived fraction was dissolved in purified water and freeze-dried under a vacuum at −51 °C to obtain a fine lyophilized powder used for analysis.
Phytochemical studies
Total phenolic content
Total phenolic content was determined using the Folin − Ciocalteu assay (Singleton & Rossi Citation1965; Ainsworth & Gillespie Citation2007), with minor modifications as described previously (Konczak et al. Citation2010). Briefly, 25 μL of plant extracts (1 mg/mL) were mixed with 125 μL Folin–Ciocalteu reagent earlier diluted with MilliQ water (1:10, v/v) in 96-well microplates and shaken for 3 min. In order to avoid the additive effects of ascorbic acid which can readily reacts with Folin–Ciocalteu reagent (Ainsworth & Gillespie Citation2007), the absorbance was measured at 600 nm for ascorbic acid correction. Subsequently, 125 μL of 6% Na2CO3 were added and the microplate was shaken for 12 min. The absorbance was then measured again at 600 nm. The results (F-C values) were expressed as mg gallic acid equivalents per gram of dry weight of the lyophilized extract (mg GAE/g DW), based on gallic acid standard curve and against a blank control. The analyses were conducted in triplicate.
Identification of phenolic compounds by liquid chromatography–diode array–mass spectrometry (LC-DAD-MS/MS)
LC-DAD-MS/MS analysis was conducted as described previously (Dalar & Konczak Citation2013) on a Quantum triple stage quadrupole (TSQ) mass spectrometer (Thermo Fisher Scientific, Waltham, MA) equipped with a quaternary solvent-delivery system, a column oven, a photo-diode array detector and an auto sampler. An aliquot (3 μL) of each ethanolic extract was chromatographed on a 150 × 2.1 mm i.d., 5 μm Luna Synergy Hydro column (Phenomenex, Torrance, CA) which was heated to 30 °C. Analytes were separated using 0.5% of formic acid in purified water (solvent A) and 0.5% of formic acid in acetonitrile (solvent B) under a flow rate of 200 μL/min. The gradient employed was 0% B for 2 min, and then increased to 100% B over 18 min, held for 1 min. The photodiode array detector was used to acquire data from 190–520 nm. Ions for mass spectrometry were generated using an electrospray source in either positive or negative mode (depending on analyte) under conditions set following optimization using chlorogenic acid (negative mode) or quercetin-3-glucoside (positive mode). MS experiments in the full scan (parent and product-specific) and the selected reaction monitoring (SRM) mode were conducted. Ellagic acid, gallic acid, chlorogenic acid, quercetin-3-glucoside, kaempferol, luteolin, quercetin, rutin and cyanidin 3-glucoside were used as standard phenolic compounds. The composition of phenolic compounds was characterized based on their UV spectrum, retention time, co-chromatography with commercial standards, when available, and MS fragmentation patterns.
Quantification of phenolic compounds by high-performance liquid chromatography–diode array detector (HPLC–DAD)
Quantification of phenolic compounds by the HPLC was conducted as described previously (Dalar & Konczak Citation2013) on HPLC system, which consisted of two LC-10ADVP pumps, SPD-M10ADVP diode array detector, CTO-1-ADVP column oven, DGU-12A degasser, SIL-10ADVP auto injector and SCL-10A system controller (Shimadzu Corporation, Kyoto, Japan) equipped with an Atlantis column (dC18, 4.6 mm i.d × 100 mm length, 5 μm particle size, Waters Associates, Chippendale, New South Wales, Australia). Analytical HPLC was run at 30 °C and monitored at 280 nm, 320 nm, 370 and 520 nm. Injection volume was 10 μL. The following solvents in purified water with a flow rate of 1.0 mL/min were used: A, 0.5% trifluoroacetic acid (TFA) and B, 0.5% TFA +95% acetonitrile. The elution profile was a linear gradient elution for B of 0% to 60% over 20 min followed by 100% B for 10 min. The identity of compounds was confirmed by co-chromatography and comparison of their spectral characteristics with those of authentic standards (Sigma-Aldrich, Castle-Hill, New South Wales, Australia). The levels of phenolic compounds detected at 280 nm were quantified as mg gallic acid equivalents per gram dry weight of lyophilized extract (mg GA Eq./g DW) based on gallic acid calibration curve (concentration range: 0.0125–0.5 mg/mL; r2 = 1). Phenolic compounds detected at 320 nm were calculated as mg of chlorogenic acid equivalents per gram dry weight (mg CHA Eq./g DW) based on chlorogenic acid calibration curve (concentration range: 0.0125–0.5 mg/mL; r2 = 1). Compounds detected at 370 nm were quantified as mg rutin equivalent per gram dry weight (mg Rutin Eq./g DW) based on the rutin calibration curve (concentration range: 0.0125–0.5 mg/mL; r2 = 0.999).
Hydrolysis of polymeric fraction
To assist the spectrophotometric analysis of polymeric fraction, plant extract was hydrolyzed according to Pinto et al. (Citation2008). Briefly, lyophilized plant extracts (10 mg) were added to 2 mL of 2N trifluoroacetic acid (TFA) in pyrex glass tubes. The tubes were placed into a heating instrument (Reacti-Therm Heating/stirring module, Selby Biolab, Pierce, Rockford, IL) and maintained at 120 °C for 2 h. Subsequently, the solutions were transferred into 5 mL volumetric flasks and 80% methanol was added to adjust the volumes. The extracts were directly analyzed by HPLC-MS/MS as described earlier.
Volatile compounds
Head space solid phase micro extraction (HS-SPME) procedure
Lyophilized plant extracts (2 g) were weighed into 40 mL vials and treated by divinyl benzene/carboxen/polydimethylsiloxane fibre with 50/30 mm film thickness. The fibre was preconditioned in the injection port of the gas chromatography (GC) as indicated by the producer before the analysis. The samples were placed in mininert push-button valves (Sigma-Aldrich) and kept at 35 °C with continuous internal stirring and equilibrated for 30 min. Subsequently, the solid phase micro extraction (SPME) fibre was exposed for 40 min to the headspace at 35 °C. SPME fibre was introduced into the GC injector after sampling and was left for 3 min to allow the analysis of thermal desorption. The headspace volume, heating temperature and time of the extraction were optimized according to Verzera et al. (Citation2004).
Gas chromatography–mass spectrometry (GC–MS) analysis
Volatile compounds present in S. davisii were analyzed by gas chromatography–mass spectrometry (GC/MS) using a head space solid phase micro extraction and identified by the fragment ions and relative retention indices of their peaks with those of the MS library standards. Volatile compounds prepared by HS-SPME procedure were analyzed on Varian 3800 gas chromatograph directly interfaced with a Varian 2000 ion trap mass spectrometer (Varian Spa, Milan, Italy) equipped with a flame ionization detector (FID), at the injector temperature of 260 °C in injection mode, splitless. The lyophilized extracts were chromatographed on a 60 × 0.25 mm i.d., 0.2 μm HP 88 column (Agilent Technologies, Santa Clara, CA). Oven temperature was programmed as follows: 80 °C at the start, followed by an increase to 190 °C at a rate of 5 °C/min, held at 190 °C for 3 min, followed by an increase at a rate of 5 °C/min to 260 °C and held for 3 min. The subsequent temperature increase was at a rate of 2 °C/min to 275 °C and held for 12.5 min. The carrier gas was helium, used at a constant pressure of 10 psi; the transfer line temperature was 250 °C; the ionization 8 mode, electron impact (EI); acquisition ion range, 40–200 m/z; scan rate, 1 us-1. The compounds were identified using the National Institute of Standards and Technology (NIST) library (NIST/WILEY/EPA/NIH), mass spectral library and verified by the retention indices, calculated as described by Van den Dool & Kratz (Citation1963). Results were expressed as FID response area in relative percentages.
Sugar content
Total sugars and reducing sugars were assayed as described by Cardozo et al. (Citation2011). The phenol–sulphuric acid method was used to determine total neutral sugars. Aliquots (0.8 mL) of different extract dilutions were mixed with 0.04 mL of 80% phenol and 2 mL of H2SO4 and incubated for 20 min at 100 °C. Absorbance was measured at 490 nm (Shimadzu 1601 spectrophotometer; Tokyo, Japan). The results were expressed as mg of glucose per gram dry weight (mg Glucose Eq./g DW) of lyophilized extract. Reducing sugars were measured using the Somogyi–Nelson method. Aliquots (0.1 mL) of different extract dilutions were mixed with 0.5 mL of copper tartrate reagent. The solution was heated (100 °C for 15 min) and 0.5 mL of arsenomolybolic acid reagent was added. Following mixing, absorbance was measured at 520 nm. The results were expressed as mg of glucose per gram lyophilized extract.
Antioxidant capacity
Ferric reducing antioxidant power (FRAP) assay
Total reducing capacity was determined using the FRAP assay (Benzie & Strain Citation1996) with minor modifications as described previously (Konczak et al. Citation2010). Briefly, the FRAP reagent consisted of 10 mL of 300 mM acetate buffer, 10 mL of 20 mM FeCl3 and 1 mL of 10 mM TPTZ solution. The acetate buffer (pH 3.6) consisted of 3.1 g of sodium acetate and 16 mL acetic acid (glacial) per litre of water. The TPTZ solution consisted of 31.2 mg of TPTZ in 10 mL of 40 mM hydrochloric acid. Briefly, 10 μL of extracts were placed in 96-well microplate (Sarstedt Australia Pty Ltd., Technology Park, South Australia, Australia) and 200 μL of FRAP reagent were added, followed by 15 s shaking. After incubation for 8 min, the absorbance was measured at 595 nm using a spectrophotometer (Wallac, Labsystems Multiskan MS; Thermo Fisher Scientific, Waltham, MA). The reducing capacity of the extracts were expressed as micromoles of iron (Fe2+) per gram of dry weight of lyophilized extract (μM Fe + 2/g DW) based on an iron sulphate standard (Fe2SO4) curve against a blank control.
Oxygen radical absorbance capacity (ORAC) assay
Oxygen radical scavenging capacity was determined using the ORAC assay according to Prior et al. (Citation2005) with some modifications (Konczak et al. Citation2010). Preparations of fluorescein (120 nM) and AAPH (360 mM) were dissolved in phosphate-buffered saline (PBS; 75 mM, pH 7.0). Blank solution and diluted samples were placed in 96-well microplate, inserted into a fluorescence spectrophotometer (POLARstar Omega, BMG Labtech, Germany) and allowed to equilibrate at 37 °C. Subsequently, AAPH was added to each well and fluorescence measurements initiated immediately. Fluorescence (excitation wavelength 495 nm and emission wavelength 515 nm) was recorded every minute until the fluorescence reached zero and a kinetic curve generated. The area under the curve (AUC) was integrated and standardized against a blank control. The measurements were carried out in triplicate. The antioxidant capacity of the samples was expressed as μM of Trolox equivalent per gram of dry weight of lyophilized extract (μM T Eq./g DW) based on a trolox standard curve.
Pancreatic lipase inhibitory activity
Lipase inhibitory activity of the lyophilized plant extracts were assessed according to Sakulnarmrat and Konczak (Citation2012), using 4-methylumbelliferyl oleate (0.1 mM) as a substrate, with the exception of porcine pancreatic lipase (Sigma type II), which was prepared using a concentration of 0.085 g/mL. Relative lipase inhibition activity was calculated using the following formula: % Inhibition = [1 – (FS – FSB)/(FC – FCB)] × 100, where FS and FC were the values of samples and negative control measured fluorometrically at an emission wavelength of 460 nm and excitation of 320 nm with slit widths of 5 nm (POLARstar Omega, BMG Labtech, Germany), and where FSB and FCB were, respectively the fluorescence readings of sample blank and control blank.
Statistical analysis
The mean values were calculated based on at least three determinations (n = 3). One-way ANOVA followed by the Bonferroni post hoc test were performed to assess differences between the samples at the level of p < 0.05. Statistical correlation analyses were performed using Graphpad Prism 5 (Graphpad Software, CA). Results from correlation analysis were considered statistically significant when p < 0.05. All half maximal inhibitory concentration (IC50) values were calculated from the corresponding dose inhibition curves according to their best-fıt shapes based on at least four reaction points using Graphpad Prism.
Results and discussion
Phytochemical composition
Phenolic compounds and sugars
The yield of lyophilized extracts obtained from dry aerial parts of S. davisii plant (stems, leaves and flowers) is shown in . Leaf and flower tissues yielded the largest amount of lyophilized extracts, which represented over 15% of the dry weight.
Table 1. The yield of lyophilized extracts obtained from S. davisii Muirhead aerial plant parts, their phenolics and sugar contents.
The HPLC analysis revealed a presence of phenolic compounds, detected predominantly at 280, 326, and 370 nm. No compounds were detected at 520 nm, which indicates that the mixture did not contain anthocyanins. Flower extract contained the highest level of phenolics, approximately threefold that of leaf and fourfold that of stem extracts (). In agreement, the Folin–Ciocalteu (F-C) assay confirmed that flower was the richest source of phenolic compounds, followed by leaf and stem. The total phenolic contents of the evaluated extracts (105.1–291.3 mg GA Eq./g extract) were comparable to several common industrial medicinal herbs such as Cosmo sulphureus Cav. (Asteraceae) (102.5 ± 10.2 mg GA Eq./g extract), Tagetes erecta L. (Asteraceae) (212.9 ± 6.0 mg GA Eq./g extract), Cistus ladaniferus L. (Cistaceae) (103.2 ± 0.4 mg GA Eq./g extract), Eucalyptus globulus Labill. (Myrtaceae) (113.7 ± 0.3 mg GA Eq./g extract), Rosa damascena Mill. (Rosaceae) (124.9 ± 1.5 mg GA Eq./g extract), Coffea arabica L. (Rubiaceae) (173.5 ± 1.9 mg GA Eq./g extract) and Ilex paraguariensis A. St. Hill. (Aquifoliaceae) (202.6 ± 5.1 mg GA Eq./g extract) (Dudonnné et al. Citation2009; Kaisoon et al. Citation2012). All extracts were rich in sugars, which contributed over 30% of the extracts dry weight with 322.9 ± 15.5 mg Glucose Eq./g DW in leaf extract and 448.1 ± 8.3 mg Glucose Eq./g DW in stem extract.
represents a typical HPLC chromatogram of hydrophilic extract obtained from aerial parts of S. davisii plant. Oligomeric and/or polymeric compounds, potentially proanthocyanidins, represented by a characteristic hump on the HPLC chromatogram dominated (). The LC/MS analysis revealed the presence of a rich mixture of phenolic compounds (). The major phenolic compound of S. davisii was tentatively identified as kaempferol hexoside (, peak 4) by the presence of negatively charged molecular ions ([M + 1]+)/([M − 1]−) at m/z 449/447 and MS/MS fragments 287/285 m/z (). The loss of 162 amu indicated a hexoside unit. This compound constituted 17.5% of total phenolics in leaf extract, 21.0% in flower extract phenolics and 27.7% in stem extract ().
Figure 1. High-performance liquid chromatography profile of ethanol-based lyophilized extract obtained from S. davisii Muirhead aerial parts at (A) 280 nm and (B) 370 nm; (1) quercetin/hesperidin hexoside, (2) kaempferol rutinoside, (3) kaempferol hexoside + glucuronide, (4) kaempferol hexoside.
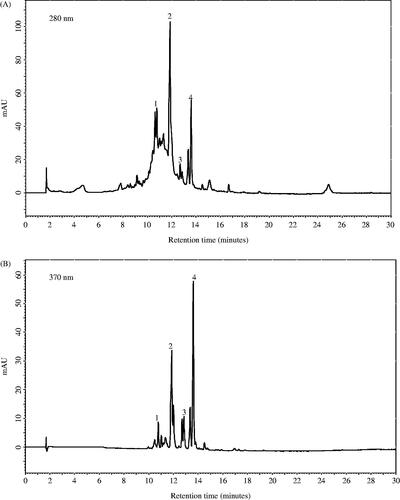
Table 2. Mass spectrometric details (LC-MS/MS) and concentration (HPLC-DAD) of phenolic compounds in ethanol-based lyophilized extracts obtained from S. davisii Muirhead aerial plant parts.
The second major phenolic compound of S. davisii (, peak 2) gave a negatively charged molecular ion ([M − 1]−) at m/z 593 and displayed a MS/MS fragment of 285 m/z. It also exhibited a loss of rutinose moiety (308 amu) (). On the basis of molecular weight, fragmentation pattern and absorbance spectrum, this compound was tentatively identified as kaempferol rutinoside. Kaempferol rutinoside contributed a high 17.3% of total phenolics in flower extract, 15.1% in leaf and 10.1% in stem extract (; ).
The third major phenolic compound represented by peak 3 () showed a negatively charged molecular ion ([M–1]−) at m/z 623 and produced a MS/MS fragment of 285 m/z. A hexoside moiety (162 amu) and a glucuronide moiety (176 amu) of neutral losses were also detected (). On the basis of molecular weight, fragmentation pattern and absorbance spectrum, this compound was tentatively identified as kaempferol hexoside + glucuronide. This compound was present in all plant parts. In stem, leaf and flower extract it contributed, respectively, 9.0%, 6.7% and 3.7% of total phenolics ().
Phenolic compound represented by peak 1 () had a positively charged molecular ion ([M + 1]+) at m/z 465 and a 303/m/z MS/MS fragment, indicating a neutral loss of hexoside moiety (162 amu). Based on molecular weight, fragmentation pattern and absorbance spectrum, this compound was tentatively identified as quercetin (or hesperitin) hexoside (). It was present at the highest level in flower extract (4.0%), followed by leaf (2.3%) and stem extract (3.1%).
Other phenolic compounds detected in S. davisii stem and leaf extracts were apigenin, isorhamnetin, chlorogenic acid, hesperitin pentoside, apigenin glucuronide, kaempferol glucuronide, quercetin rutinoside (). Flower extract contained p-coumaric acid, caffeic acid, apigenin, gallocatechin, isorhamnetin, hydroxybenzoic-O-hexoside, chlorogenic acid, hesperitin pentoside, apigenin glucuronide, kaempferol glucuronide and quercetin rutinoside ().
The composition of polymeric fraction of the extract was evaluated following acid hydrolysis as described by Pinto et al. (Citation2008). The major aglycone yielded was kaempferol. In agreement, kaempferol was the unique aglycone of the hydrolyzed oligomeric polyphenolic fraction of S. tectorum leaf extract (Abram & Donko Citation1999). Similarly, Stevens et al. (Citation1996) identified kaempferol as the principal flavonol obtained after acid hydrolysis of extracts of 34 Sempervivum species, including S. armenum, S. marmoreum Griseb. and S. tectorum. Alberti et al. (Citation2012) analyzed phenolic composition of S. tectorum. According to their study, kaempferol glycosides were the major bioactive compounds of S. tectorum extracts. Šentjurc et al. (Citation2003) reported kaempferol and its glycosides as the major phenolic compounds of S. tectorum. Our findings are in agreement with these earlier results and support the opinion that kaempferol and its glycosides are the characteristic key phenolic compounds of Sempervivum species.
Volatile composition
Mass spectrometric analysis revealed the presence of 11 volatile compounds in the lyophilized S. davisii extracts evaluated in this study. shows representative total ion chromatogram of volatile compounds detected in the aerial parts. Stem and leaf extracts exhibited a similar composition of volatile compounds, which was different to that of flower (). The major volatile compounds of stem and leaf extracts were dehydroxylinalool oxide isomers with major contribution of cymene and nonanal. Flower extract contained a mixture of nonanal, 2-decenal, 2-undecenal, 2,6-di-tert-butylphenol, palmitic acid ethylester, 2.4-decadienal and octanal.
Figure 2. Total ion chromatogram of volatile compounds profile of ethanol-based lyophilized extract obtained from S. davisii Muirhead aerial parts: (1) Dehydroxylinalool oxide isomers, (2) Octanal, (3) Cymene, (4) Nonanal, (5) 2-Decenal, (6) 2,4-Decadienal, (7) 2-Undecenal, (8) 2,6-Di-tert-butylphenol, (9) Palmitic acid ethylester.
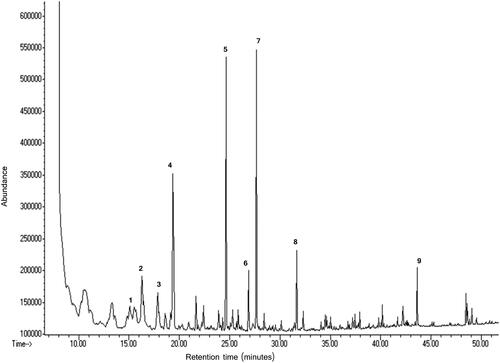
Table 3. Volatile compounds in lyophilized hydrophilic extracts prepared from S. davisii Muirhead aerial plant parts.
Compound 1 produced m/z 55, 67, 82, 96, 110, 123 and 137 mass spectra (, ). On the basis of molecular weight, fragment ions and MS library standards, this compound was tentatively identified as dehydroxylinalool oxide isomers. The isomers contributed a high 32.9% and 45.4% toward the volatile compounds mixture of, respectively, stem and leaf; only their traces (<2%) were found in the flower extract ().
The major volatile compound (compound 4; 22.0% of the mixture) of flower extract produced fragment ions of 57, 70, 82, 98, 114 and 124 m/z (, ) and was tentatively identified as nonanal.
The second major volatile compound of flower extract had fragment ions of 55, 70, 83, 97, 121 and 166 m/z and was identified as 2-undecenal (). The compound 7 contributed 16.4% of the volatile mixture of flower extract and produced mass spectra m/z of 55, 70, 83, 98, 110 and 136. According to molecular weight, fragment ions and MS library standards this compound was tentatively identified as 2-decenal (). Minor volatile compounds present at trace level (< 2%) were octanal, cyclohexene, cylodecane, 2-decenal, 2,4-decadienal, 2-undecenal and palmitic acid ethylester ().
Antioxidant capacity
The antioxidant capacity of hydrophilic extracts obtained from stem, leaf and flower of S. davisii is shown in . Flower extract exhibited the highest capacity demonstrated by both, the highest oxygen radical absorbance capacity (ORAC) and the ferric reducing antioxidant power (FRAP) values.
Table 4. Antioxidant and lipase inhibitory activities of lyophilized hydrophilic extracts prepared from S. davisii Muirhead aerial plant parts.
The ORAC values of S. davisii varied from 1858.5 ± 105.7 (stem) to 4208.7 ± 240.8 (flower) μmol T Eq./g DW in the following order: stem ≤ leaf < flower (). The ORAC value of S. davisii flower extract was superior to that of pomegranate polyphenol-rich extract (3210 μmol TE/g DW) used as a traditional medicine and a food supplement (Madrigal-Carballo et al. Citation2009). Leaf and stem extracts exhibited similar ORAC values to that of Hibiscus sabdariffa L. (2307 ± 10 μmol TE/g DW), a tropical plant commonly used for the preparation of soft drink (Fernández-Arroyo et al. Citation2011).
The total reducing capacity (FRAP values) of S. davisii extracts ranged from 1925.2 ± 44.4 (stem) to 5973 ± 96.8 (flower) μM Fe + 2/g DW and were in the same order as the ORAC values (stem ≤ leaf < flower). The FRAP value of flower extract was approximately 2.5- to 3-fold that of leaf and stem extracts (). The FRAP value of S. davisii flower was sixfold that of allspice (1015 μM Fe2+/g DW), cinnamon (984 μM Fe2+/g DW) and approximately ninefold that of rosemary (669 μM Fe2+/g DW) and thyme (637 μM Fe2+/g DW), important commercial spices promoted for their health benefits (Dragland et al. Citation2003). The total reducing capacity of leaf was approximately fivefold that of saffron (478 μM Fe2+/g DW), oregano (450 μM Fe2+/g DW) and tarragon (433 μM Fe2+/g DW) (Dragland et al. Citation2003). The FRAP value of S. davisii stem was fourfold that of a Chinese herbal medicinal plant, Sargentodoxa cuneata Rehd. Et Wils (Sargentodoxaceae) (453.53 ± 10.3 μM Fe2+/g DW), which displayed the highest FRAP value among 45 Chinese herbal medicinal plants (Li et al. Citation2008).
Lipase inhibitory activity
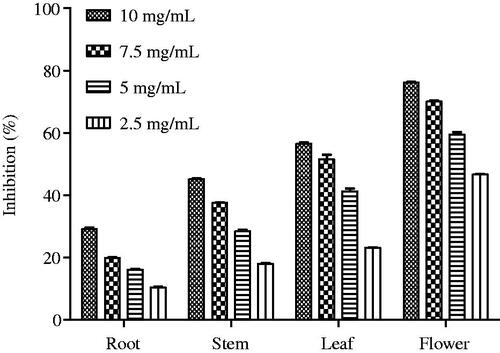
In the present study, S. davisii plant extracts exhibited a dose-dependent lipase inhibitory activity (). Among them, flower extract exhibited the highest activity (IC50: 2.96 mg/mL), and was followed by leaf and stem extracts. The lipase inhibitory activity of flower extract was higher than that of edible flowers from Thailand (IC50 values of 4.60–7.87 mg/mL) (Kaisoon et al. Citation2012).
Figure 3. Dose-dependent antilipase activity of S. davisii Muirhead extracts.
Correlation analysis
Phenolic compounds and antioxidant capacity
A strong positive relationship has been identified between total phenolic levels (F-C values) and antioxidant capacities of S. davisii extracts as evaluated using FRAP assay (r2 = 0.9983) and ORAC assay (r2 = 0.9936). The values of correlation coefficients between total phenolic content analyzed spectrophotometrically at 280 nm and antioxidant capacities (r2 ≥ 0.9918) are similar to those between total phenolics (Folin–Ciocalteu values) and antioxidant capacities (). This suggests that phenolic compounds present in the extracts might be one of the main agents contributing to antioxidant capacities.
Table 5. Correlation analysis between phenolic compounds and antioxidant and lipase inhibitory activities of plant extracts obtained from S. davisii Muirhead aerial plant parts.
The correlation analysis for the relationship between individual phenolic compounds and antioxidant capacity showed that quercetin hexoside (r2 ≥ 0.99) and kaempferol rutinoside (r2 ≥ 0.8130) correlated very well with antioxidant activities with quercetin showing superior correlation. A moderate positive correlation was found for kaempferol hexoside (r2 ≥ 0.4) (). Kaempferol and its glycosides are well-known for their potential antioxidant activities due to their ability to scavenge free radicals and active oxygen species. Tatsimo et al. (Citation2012) reported a pronounced DPPH radical scavenging activity of kaempferol glycosides, while Rice-Evans et al. (Citation1997) reported its superior in vitro antioxidant capacity to that of vitamin C and vitamin E. Therefore, quercetin hexoside and kaempferol glycosides could be one of the main contributors to antioxidant properties of S. davisii extracts. In agreement, kaempferol and kaempferol-3-glucoside were suggested as the major sources of antioxidant capacity of S. tectorum juice extract (Šentjurc et al. Citation2003).
Volatile compounds present in the extracts may be a secondary source of antioxidant activities. Weak antioxidant activities of volatile compounds including nonanal, decenal, undecenal and linalool oxide and cymene were reported by others (Ruberto & Baratta Citation2000).
Phenolic compounds and lipase inhibitory activity
Sempervivum davisii extracts evaluated in this study exhibited moderate lipase inhibitory activities. Strong positive correlations were identified between lipase inhibitory activities and total phenolics, antioxidant capacities, quercetin hexoside and kaempferol rutinoside (r2 ≥ 0.8720). Relatively lower correlations were found for kaempferol hexoside (r2 = 0.5000) and kaempferol hexoside + glucuronide (r2 = 0.0240) (). Artz et al. (Citation1987) reported that proanthocyanidins or condensed tannins are prone to complexation with proteins, and dimers and monomers are less effective. Therefore, it can be speculated that polymeric compounds of S. davisii may play a role in the in vitro suppression of pancreatic lipase activity.
Conclusions
Kaempferol glycosides (hexoside and rutinoside) were identified as the dominating phenolic compounds of lyophilized hydrophilic extracts prepared from stems, leaves and flowers of S. davisii and were accompanied by quercetin hexoside. The extracts contained a rich mixture of volatile compounds comprising nonanal, dehydroxylinalool oxide isomers, 2-decenal, 2-undecenal and 2,6-di-tert-butylphenol, octanal, cymene, 2,4-decadienal and palmitic acid ethylester. The antioxidant activity of the evaluated extracts was equivalent or superior to that of commercially used industrial medicinal herbs. The extracts also exhibited moderate lipase-inhibitory activities.
Acknowledgements
The authors thank Mr Muzaffer Mükemre of the Biology Department in Yuzunci Yil University for help in plant identification and Dr A. S. Bengu in GC/MS analysis.
Disclosure statement
The authors report no conflict of interest. The authors alone are responsible for the content of the paper.
Related Research Data
References
- Abram V, Donko M. 1999. Tentative identification of polyphenols in Sempervivum tectorum and assessment of the antimicrobial activity of Sempervivum L. J Agric Food Chem.47:485–489.
- Ainsworth EA, Gillespie KM. 2007. Estimation of total phenolic content and other oxidation substrates in plant tissues using Folin-Ciocalteu reagent. Nat Protoc. 2:875–877.
- Alberti Á, Béni S, Lackó E, Riba P, Al-Khrasani M, Kery A. 2012. Characterization of phenolic compounds and antinociceptive activity of Sempervivum tectorum L. leaf juice. J Pharm Biomed Anal. 70:143–150.
- Artz WE, Bishop PD, Dunker AK, Schanus EG, Swanson BG. 1987. Interaction of synthetic proanthocyanidin dimer and trimer with bovine serum albumin and purified bean globulin fraction G-1. J Agr Food Chem. 35:417–421.
- Benzie IFF, Strain JJ. 1996. The ferric reducing ability of plasma (FRAP) as a measure of “antioxidant power”: the FRAP assay. Anal Biochem. 239:70–76.
- Blazovics A, Feher J, Feher E, Kery A, Petri G. 1993. Liver protecting and lipid lowering effects of Sempervivum tectorum extract in the rat. Phytother Res. 7:98–100.
- Blazovics A, Gonzales-Cabello R, Barta I, Gergely P, Feher J, Kery A, Petri G. 1994. Effect of liver-protecting Sempervivum tectorum extract on the immune reactivity of spleen cells in hyperlipidaemic rats. Phytother Res. 8:33–37.
- Bremness L, Norman J. 1995. The complete book of herbs & spices. NY: Viking Penguin.
- Cardozo ML, Ordonez RM, Alberto MR, Zampini IC, Isla MI. 2011. Antioxidant and antiinflammatory activity characterization and genotoxicity evaluation of Ziziphus mistol ripe berries, exotic Argentinian fruit. Food Res Int. 44:2063–2071.
- Dalar A, Konczak I. 2013. Phenolic contents, antioxidant capacities and inhibitory activities against key metabolic syndrome relevant enzymes of herbal teas from Eastern Anatolia. Ind Crop Prod. 44:383–390.
- Davis PH. 1972. Flora of Turkey and The East Aegean lslands. Volume 4. Edinburgh (UK): Edinburgh University Press.
- Dragland S, Senoo H, Wake K, Holte K, Blomhoff R. 2003. Several culinary and medicinal herbs are important sources of dietary antioxidants. J Nutr. 133:1286–1290.
- Dudonnné S, Vitrac X, Coutière P, Merillon JM. 2009. Comparative study of antioxidant properties and total phenolic content of 30 plant extracts of industrial interest using DPPH, ABTS, FRAP, SOD, and ORAC assays. J Agr Food Chem. 57:1768–1774.
- Fernández-Arroyo S, Rodríguez-Medina IC, Beltrán-Debón R, Pasini R, Joven J, Micol V, Segura-Carretero A, Fernandez-Gutierrez A. 2011. Quantification of the polyphenolic fraction and in vitro antioxidant and in vivo anti-hyperlipemic activities of Hibiscus sabdariffa aqueous extract. Food Res Int. 44:1490–1495.
- Muselin F, Trif A, Stana LG, Cristina TR, Gravila C, Macinic I, Dumitrescu E. 2014. Protective effects of aqueous extract of Sempervivum tectorum L (Crassulaceae) on aluminium-induced oxidative stress in rat blood. Trop J Pharm Res. 13:179–184.
- Kaisoon O, Konczak I, Siriamornpun S. 2012. Potential health enhancing properties of edible flowers from Thailand. Food Res Int. 46:563–571.
- Kerry A, Blazovics A, Rozlosnik N, Feher J, Petri G. 1992. Antioxidative properties of extracts from S. tectorum. Planta Med. 58:661–662.
- Konczak I, Zabaras D, Dunstan M, Aguas P. 2010. Antioxidant capacity and phenolic compounds in commercially grown native Australian fruits. Food Chem. 123:1048–1054.
- Li HB, Wong CC, Cheng KW, Chen F. 2008. Antioxidant properties in vitro and total phenolic contents in methanol extracts from medicinal plants. LWT-Food Sci Technol. 41:385–390.
- Madrigal-Carballo S, Rodriguez G, Krueger CG, Dreher M, Reed JD. 2009. Pomegranate (Punica granatum) supplements: authenticity, antioxidant and polyphenol composition. J Funct Foods. 1:324–329.
- Novaretti R, Lemordant D. 1990. Plants in the traditional medicine of the Ubaye valley. J Ethnopharmacol. 30:1–34.
- Pinto MS, Lajolo FM, Genoves MIG. 2008. Bioactive compounds and quantification of total ellagic acid in strawberries (Fragaria x ananassa Duch.). Food Chem. 107:1629–1635.
- Prior RL, Wu X, Schaich K. 2005. Standardized methods for the determination of antioxidant capacity and phenolics in foods and dietary supplements. J Agric Food Chem.53:4290–4202.
- Rice-Evans CA, Miller NJ, Paganga G. 1997. Antioxidant properties of phenolic compounds. Trends Plant Sci. 2:152–159.
- Ruberto J, Baratta MT. 2000. Antioxidant activity of selected essential oil components in two lipid model systems. Food Chem. 69:167–174.
- Sakulnarmrat K, Konczak I. 2012. Composition of native Australian herbs polyphenolic-rich fractions and in vitro inhibitory activities against key enzymes relevant to metabolic syndrome. Food Chem. 134:1011–1019.
- Šentjurc M, Nemec M, Connor HD, Abram V. 2003. Antioxidant activity of Sempervivum tectorum and its components. J Agr Food Chem. 51:2766–2771.
- Singleton VL, Rossi JA. 1965. Colorimetry of total phenolics with phosphormolybdic-phosphotungstic acid reagents. Am J Enol Viticult. 16:144–158.
- Stevens JF, Hart H, Elema ET, Bolck A. 1996. Flavonoid variation in eurasian Sedum and Sempervivum. Phytochemistry. 41:503–512.
- Tatsimo NSJ, Tamokou JD, Havyarimana L, Csupor D, Forgo P, Hohmann J, Kuiate JR, Tane P. 2012. Antimicrobial and antioxidant activity of kaempferol rhamnoside derivatives from Bryophyllum pinnatum. BMC Res Notes. 5:158.
- Van Den Dool H, Kratz PD. 1963. A generalization of the retention index system including linear temperature programmed gas–liquid partition chromatography. J Chromatogr. 11:463–471.
- Verzera A, Ziino M, Condurso C, Romeo V, Zappalà M. 2004 . Solid-phase microextraction and gas chromatography-mass spectrometry for rapid characterisation of semi-hard cheeses. Anal Bioanal Chem. 380:930–3936.
- Yeşilada E, Sezik E, Honda G, Takaishi Y, Takeda Y, Tanaka T. 1999 . Traditional medicine in Turkey IX: folk medicine in north-west Anatolia. J Ethnopharmacol. 64:195–210.