
 ?Mathematical formulae have been encoded as MathML and are displayed in this HTML version using MathJax in order to improve their display. Uncheck the box to turn MathJax off. This feature requires Javascript. Click on a formula to zoom.
Abstract
Context: Combining sorafenib with triptolide could inhibit tumour growth with greater efficacy than single-agent treatment. However, their herb–drug interaction remains unknown.
Objective: This study investigates the herb–drug interaction between triptolide and sorafenib.
Materials and methods: The effects of triptolide (10 mg/kg) on the pharmacokinetics of different doses of sorafenib (20, 50 and 100 mg/kg) in rats, and blood samples were collected within 48 h and evaluated using LC-MS/MS. The effects of triptolide on the absorption and metabolism of sorafenib were also investigated using Caco-2 cell monolayer model and rat liver microsome incubation systems.
Results: The results showed that the Cmax (low dose: 72.38 ± 8.76 versus 49.15 ± 5.46 ng/mL; medium dose: 178.65 ± 21.05 versus 109.31 ± 14.17 ng/mL; high dose: 332.81 ± 29.38 versus 230.86 ± 9.68 ng/mL) of sorafenib at different doses increased significantly with the pretreatment of triptolide, and while the oral clearance rate of sorafenib decreased. The t1/2 of sorafenib increased significant (p < 0.05) from 9.02 ± 1.16 to 12.17 ± 2.95 h at low dose with the pretreatment of triptolide. Triptolide has little effect on the absorption of sorafenib in Caco-2 cell transwell model. However, triptolide could significantly decrease the intrinsic clearance rate of sorafenib from 51.7 ± 6.37 to 32.4 ± 4.43 μL/min/mg protein in rat liver microsomes.
Discussion and conclusions: These results indicated that triptolide could change the pharmacokinetic profiles of sorafenib in rats; these effects might be exerted via decreasing the intrinsic clearance rate of sorafenib in rat liver.
Keywords:
Introduction
Sorafenib is an orally active tyrosine kinase inhibitor, which has been approved for the treatment of renal and hepatocellular carcinoma (Abdel-Rahman Citation2013; Abdulghani et al. Citation2013; Ahmadi et al. Citation2014). Research indicates that sorafenib could inhibit tumour cell proliferation by targeting Raf/mitogen-activated protein kinase or extracellular signal-regulated kinase, and exert antiangiogenic effects by targeting vascular endothelial growth factor receptor-1/-2/-3 and platelet-derived growth factor receptor-b tyrosine kinases (Bhatt and Ganti Citation2014; Booth et al. Citation2014; Brown et al. Citation2014; Chen et al. Citation2014).
In humans, sorafenib is administrated in a tablet form, and the majority (77%) of the sorafenib dose is either not absorbed or is eliminated through the hepatobiliary route (50% unchanged), whereas 19% of the dose (mostly glucuronides) is excreted in urine (Lathia et al. Citation2006; Kim et al. Citation2015; Schmithals et al. Citation2015; Shimada et al. Citation2015). Some studies have investigated its intestine absorption and hepatobiliary disposition to enhance its absorption and clinical efficacy (Wang et al. Citation2011; Hornecker et al. Citation2012; Tlemsani et al. Citation2015; Wang et al. Citation2015). Recently, some research articles have indicated that the combination of sorafenib and triptolide is superior to single-drug treatment in increasing cell death and apoptosis, and combining sorafenib with triptolide could also inhibit tumour growth with greater efficacy than single-agent treatments (Alsaied et al. Citation2014). As we know, the absorption of sorafenib in small-intestinal mucosa was mainly mediated by P-glycoprotein (P-gp), and sorafenib was mainly metabolized by cytochrome P450 3A4 (CYP3A4) and uridine diphosphate glucuronosyl transferase 1A9 (UGT1A9) (Doi et al. Citation2011; Zimmerman et al. Citation2012; Gillani et al. Citation2014). Therefore, the drug–drug interaction of sorafenib mediated by CYP3A4 and P-gp might happen. To the best of our knowledge, there is little data available for the effects of triptolide on the pharmacokinetics of sorafenib.
In this study, the herb–drug interaction potential of between sorafenib and triptolide was investigated. In vivo, the pharmacokinetics of sorafenib with and without pretreatment of triptolide was determined using a sensitive and reliable LC-MS/MS method. The in vitro effects of triptolide on the absorption of sorafenib were investigated in the Caco-2 cell transwell model, and the effects of triptolide on the metabolic stability of sorafenib were also determined using rat liver microsomes.
Materials and methods
Chemicals and reagents
Sorafenib (purity >98%), β-nicotinamide adenine dinucleotide phosphate (NADP) and Lucifer yellow was purchased from Sigma (St. Louis, MO). Berberine (purity >98%) and triptolide (purity >98%) were purchased from the National Institute for the Control of Pharmaceutical and Biological Products (Beijing, China). Rat liver microsomes were purchased from BD GentestTM (Becton Dickinson, Franklin Lakes, NJ). The Alkaline Phosphatase Assay Kit was provided by Nanjing Jiancheng Bioengineering Institute (Nanjing, China). Acetonitrile and methanol were purchased from Fisher Scientific (Fair Lawn, NJ). Formic acid was purchased from Anaqua Chemicals Supply Inc. Limited (Houston, TX). Ultrapure water was prepared with a Milli-Q water purification system (Millipore, Billerica, MA). All other chemicals were of analytical grade or better.
Dulbecco’s modified Eagle’s medium (DMEM) and non-essential amino acid (NEAA) solution were purchased from Thermo Scientific Corp. (Logan, UT). Foetal bovine serum (FBS) was obtained from GIBCO BRL (Grand Island, NY). Penicillin G (10,000 U/mL) and Streptomycin (10 mg/mL) were purchased from Amresco (Solon, OH). Hanks' balanced salt solution (HBSS) was purchased from GIBCO (Grand Island, NY).
Animal experiments
Sprague–Dawley (SD) rats (including equal numbers of males or females) weighing 230–250 g were provided by the Experimental Animal Center of the Shandong University (Jinan, China). Rats were bred in a breeding room at 25 °C, 60 ± 5% humidity, and a 12 h dark–light cycle. Tap water and normal chow were given ad libitum. All the experimental animals were housed under the above conditions for a 3-d acclimation and were fasted overnight before the experiments. The animal facilities and protocols were approved by the Institutional Animal Care and Use Committee. All procedures were in accordance with the National Institute of Health guidelines regarding the principles of animal care.
In vivo pharmacokinetic study
To evaluate the effects of triptolide on the pharmacokinetics of sorafenib, the rats were divided into six groups of six animals each. Sorafenib was dissolved in 0.9% saline (the final concentration of sorafenib was 2, 5 and 10 mg/mL, respectively) and orally administered to rats at different dose (20, 50 and 100 mg/kg, respectively). The pretreated groups received oral triptolide (10 mg/kg) 30 min prior to sorafenib. Triptolide was dissolved in normal saline containing PEG400 (1:20) at a concentration of 20 mg/mL. Blood samples (0.25 mL) were collected into a heparinized tube via the oculi chorioideae vein at 0.25, 0.5, 1, 2, 4, 6, 8, 12, 24, 36 h and 48 h. The blood samples were centrifuged at 3500 rpm for 10 min, and the plasma samples obtained were stored at −40 °C until analysis.
LC-MS/MS method for the determination of sorafenib in rat plasma
The LC-MS/MS method was performed according to our previously reported (Wang et al. Citation2015). The analysis was performed on an Agilent 1290 series liquid chromatography system (Agilent Technologies, Palo Alto, CA), including a binary pump, an on-line vacuum degasser, a surveyor autosampling system, a column temperature controller, and an Agilent 6460 triple-quadruple mass spectrometer (Agilent Technologies, Palo Alto, CA) with Turbo Ion spray, which is connected to the liquid chromatography system. Agilent MassHunter B 4.0 software (Agilent Technologies, Palo Alto, CA) was used for the control of equipment and data acquisition. The chromatographic analysis of sorafenib was performed on Waters X-Bridge C18 column (3.0 × 100 mm, i.d.; 3.5 μm, Waters Co., Milford, MA) at room temperature. The mobile phase was water (containing 0.1% formic acid) and acetonitrile (62:38, v:v) at a flow rate of 0.4 mL/min.
The mass scan mode was positive MRM mode. The precursor ion and the product ion are m/z 465.1 → 252.2 for sorafenib and m/z 336.2 → 320.2 for IS, respectively. The collision energy for sorafenib and IS was 30 eV and 25 eV, respectively. The MS/MS conditions were optimized as follows: fragmentor, 130 V; capillary voltage, 4 kV; nozzle voltage, 500 V; nebulizer gas pressure (N2), 40 psig; drying gas flow (N2), 10 L/min; gas temperature, 350 °C; sheath gas temperature, 400 °C; sheath gas flow, 12 L/min.
Data analysis
The pharmacokinetic parameters, including the area under the plasma concentration–time curve (AUC), the maximal plasma concentration (Cmax), the time for maximal plasma concentration (Tmax), and the mean residence time (MRT) were calculated using the DAS 3.0 pharmacokinetic software (Chinese Pharmacological Association, Anhui, China).
The differences between the mean values were analyzed for significance using one-way analysis of variance (ANOVA). p Values less than 0.05 were considered as statistically significant.
Cell culture
The Caco-2 cell line was obtained from the American Type Culture Collection (Manassas, VA). The Caco-2 cells were cultured in DMEM high-glucose medium containing 15% FBS, 1% NEAA and 100 U/mL penicillin and streptomycin. The cells were cultured at 37 °C with 5% CO2. For transport studies, the cells at passage 40 were seeded on transwell polycarbonate insert filters (1.12 cm2 surface, 0.4 μm pore size, 12 mm diameter; Corning Costar Corporation, Cambridge, MA) in 12-well plates at a density of 1 × 10⁵ cells/cm2. Cells were allowed to grow for 21 d. For the first 7 d, the medium was replaced every 2 d, and then daily. The transepithelial electrical resistance (TEER) of the monolayer cells was measured using Millicell ERS-2 (Millipore Corporation, Billerica, MA), and TEER exceeding 400 Ω cm2 was used for the flux experiment. The integrity of the Caco-2 monolayers was confirmed by the paracellular flux of Lucifer yellow, which was less than 1% per hour. The passive diffusion was validated using a transcellular transport marker propranolol (10 μM), and the efflux activity of P-gp was validated using a typical P-gp substrate digoxin (25 μM). The qualified monolayers were used for transport studies.
Effects of triptolide on the transport of sorafenib in the Caco-2 cell transwell model
Before the transport experiments, the cell monolayers were rinsed twice using warm (37 °C) Hanks’ balanced salt solution (HBSS), and then the cells were incubated at 37 °C for 20 min. After preincubation, the cell monolayers were incubated with sorafenib in fresh incubation medium from either the apical or basolateral side for the indicated times at 37 °C. The volume of incubation medium on the apical and basolateral sides was 0.5 mL and 1.5 mL, respectively, and a 100 μL aliquot of the incubation solution was withdrawn at the indicated time points from the receiver compartment and replaced with the same volume of fresh pre-warmed HBSS buffer. The effects of triptolide on the transport of sorafenib were investigated by adding 20 μM triptolide to both sides of the cell monolayers and preincubating the sample for 30 min at 37 °C. The permeability of sorafenib (2 μM) in all of the above conditions for both directions, i.e., from the apical (AP) side to the basolateral (BL) side or from the BL side to the AP side, was measured after incubation for 2 h at 37 °C.
The apparent permeability coefficient (Papp) was calculated by using the equation of Artursson and Karlsson:
where Papp is the apparent permeability coefficient (cm/s), ΔQ/Δt (μmol/s) is the rate at which the compound appears in the receiver chamber, C0 (μmol/L) is the initial concentration of the compound in the donor chamber and A (cm2) represents the surface area of the cell monolayer. Data were collected from three separate experiments, and each was performed in triplicate.
Effects of triptolide on the metabolic stability of sorafenib in rat liver microsomes
Rat liver microsomes were used to determine the phase I metabolic stability of sorafenib. The assay conditions and reaction mixtures were similar as reported previously with minor modification (Qi et al. Citation2013; Li et al. Citation2016). In brief, except for NADPH-generating system (10 mM G-6-P, 1 mM NADP+, 4 mM magnesium chloride, 1 unit/mL of G-6-PDH), 10 μL rat liver microsome (20 mg/mL), 4 μL sorafenib solution (100 μM) and 366 μL PBS buffer (0.1 M, pH 7.4) were added to the centrifuge tubes on ice. The reaction mixture was incubated at 37 °C for 5 min and then NADPH-generating system (15 μL) was added. The effects of triptolide on the metabolic stability of sorafenib was investigated by adding 100 μM triptolide to rat liver microsomes and preincubating for 30 min at 37 °C, and then NADPH-generating system (15 μL) was added. Aliquots of 30 μL were collected from reaction volumes at 0, 1, 3, 5, 15, 30 and 60 min and 60 μL ice-cold acetonitrile containing IS was added to terminate the reaction, and then the sample preparation method was the same as the plasma sample preparation method and determined by LC-MS/MS.
The in vitro half-life (t1/2) was obtained using the equation: t1/2 = 0.693/k; V (μL/mg) = volume of incubation (μL)/protein in the incubation (mg); intrinsic clearance (Clint) (μL/min/mg protein) = V× 0.693/t1/2.
Results and discussion
Effects of triptolide on the pharmacokinetics of sorafenib
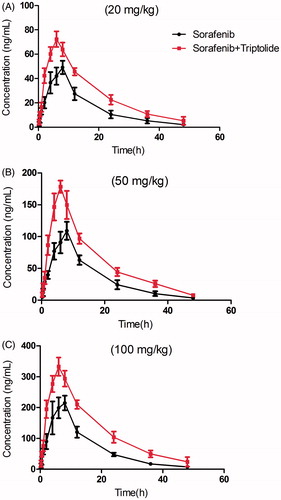
The mean plasma concentration–time curves of sorafenib after oral administration of sorafenib or both sorafenib and triptolide are presented in .
Figure 1. The pharmacokinetic profiles of sorafenib in rats after oral administration of different dose of sorafenib (20, 50 and 100 mg/kg) with or without treatment of triptolide (10 mg/kg). (A) Dose of sorafenib at 20 mg/kg; (B) dose of sorafenib at 50 mg/kg; (C) dose of sorafenib at 100 mg/kg.
The pharmacokinetic parameters of sorafenib were calculated using the non-compartmental method with DAS 3.0 pharmacokinetic software (Chinese Pharmacological Association, Anhui, China). The pharmacokinetic parameters are shown in .
Table 1. The pharmacokinetic parameters of sorafenib in rats after oral administration of different dose of sorafenib (20, 50 and 100 mg/kg; n = 6, mean ± S.D.) with or without treatment of triptolide.
The results showed that the Cmax and AUC(0–t) of sorafenib at different doses increased significantly, and while the oral clearance rate of sorafenib decreased with the pretreatment of triptolide. The t1/2 of sorafenib increased from 9.02 ± 1.16 to 12.17 ± 2.95 h at low dose with the pretreatment of triptolide, and the difference was significant (p < 0.05). The t1/2 of sorafenib also increased at medium and high dose, but the difference was not significant.
These results indicated that when the rats were pretreated with triptolide, the plasma concentration of sorafenib was significantly increased. We think that after pretreatment with triptolide, P-gp might be inhibited by triptolide and that the absorption of sorafenib was thus increased, as sorafenib was a substrate of P-gp. Additionally, sorafenib has been reported to be metabolized by CYP3A4 in liver, and therefore, we propose that triptolide might also cause the higher Cmax and lower oral clearance rate of sorafenib by inhibiting CYP3A-mediated metabolism. Therefore, to validate this proposition, Caco-2 cell transwell experiment and rat liver microsome incubation experiment were conducted.
Effects of triptolide on the bidirectional transport of sorafenib across Caco-2 cells
To investigate the effects of triptolide on the transport of sorafenib, the Caco-2 cell in vitro model was utilized. First, the transport of 2 μM of sorafenib across Caco-2 cell monolayers was investigated. The PappAB and PappBA were 6.97 ± 1.08 × 10⁻⁶ and 1.82 ± 0.52 × 10⁻⁵ cm/s, respectively. The PappBA was much higher than PappAB, and the efflux ratio was 2.61, which indicated that efflux transporters might be involved in the transport of sorafenib. Then the transport studies were performed in the presence of 20 μM triptolide to determine the effects of triptolide on the transport of sorafenib. In the presence of 20 μM of triptolide, the Papp values from the AP side to the BL side increased from 6.97 ± 1.08 × 10⁻⁶ to 7.13 ± 1.22 × 10⁻⁶ cm/s, whereas those from the BL side to the AP side decreased from 1.82 ± 0.52 × 10⁻⁵ to 1.71 ± 0.34 × 10⁻⁶ cm/s. The efflux ratio decreased from 2.61 to 2.39, and the difference was not significant. These results indicated that triptolide had little influence on the transport of sorafenib.
Effects of triptolide on the metabolic stability of sorafenib in rat liver microsomes
The effects of triptolide on the metabolic stability of sorafenib were investigated using rat liver microsomes. The metabolic half-life of sorafenib was 26.8 ± 3.65 min, and the intrinsic clearance rate was 51.7 ± 6.37 μL/min/mg protein. While the metabolic half-life was prolonged (42.8 ± 5.82 min) in the presence of triptolide, and the intrinsic clearance rate (32.4 ± 4.43 μL/min/mg protein) was increased. These results indicated that triptolide could slow down the metabolism of sorafenib in rat liver microsomes, which might work through inhibiting the activity of CYP3A4 to affect the metabolism of sorafenib.
Conclusions
In this study, the herb–drug interaction between sorafenib and triptolide were investigated using LC-MS/MS, and the results indicated that triptolide could change the pharmacokinetics profiles of sorafenib. These effects might be exerted via decreasing the intrinsic clearance rate of sorafenib in rat liver via inhibiting the activity of CYP3A4. Consequently, the herb–drug interaction between triptolide and sorafenib might occur when triptolide and sorafenib were co-administered.
Disclosure statement
The authors have declared no conflict of interest.
Reference
- Abdel-Rahman O. 2013. Systemic therapy for hepatocellular carcinoma (HCC): from bench to bedside. J Egypt Natl Canc Inst. 25:165–171.
- Abdulghani J, Allen JE, Dicker DT, Liu YY, Goldenberg D, Smith CD, Humphreys R, El-Deiry WS. 2013. Sorafenib sensitizes solid tumors to Apo2L/TRAIL and Apo2L/TRAIL receptor agonist antibodies by the Jak2-Stat3-Mcl1 axis. PLoS One. 8:e75414.
- Ahmadi M, Ahmadihosseini Z, Allison SJ, Begum S, Rockley K, Sadiq M, Chintamaneni S, Lokwani R, Hughes N, Phillips RM. 2014. Hypoxia modulates the activity of a series of clinically approved tyrosine kinase inhibitors. Br J Pharmacol. 171:224–236.
- Alsaied OA, Sangwan V, Banerjee S, Krosch TC, Chugh R, Saluja A, Vickers SM, Jensen EH. 2014. Sorafenib and triptolide as combination therapy for hepatocellular carcinoma. Surgery. 156:270–279.
- Bhatt VR, Ganti AK. 2014. Sorafenib in squamous cell carcinoma of the head and neck: molecular basis and potential role. Future Oncol. 10:17–20.
- Booth LA, Tavallai S, Hamed HA, Cruickshanks N, Dent P. 2014. The role of cell signalling in the crosstalk between autophagy and apoptosis. Cell Signal. 26:549–555.
- Brown WS, Khalili JS, Rodriguez-Cruz TG, Lizee G, McIntyre BW. 2014. B-Raf regulation of integrin alpha-4-beta-1-mediated resistance to shear stress through changes in cell spreading and cytoskeletal association in T cells. J Biol Chem. 289:23141–23153.
- Chen Y, Huang Y, Reiberger T, Duyverman AM, Huang P, Samuel R, Hiddingh L, Roberge S, Koppel C, Lauwers GY, et al. 2014. Differential effects of sorafenib on liver versus tumor fibrosis mediated by stromal-derived factor 1 alpha/C-X-C receptor type 4 axis and myeloid differentiation antigen-positive myeloid cell infiltration in mice. Hepatology. 59:1435–1447.
- Doi N, Tomita M, Hayashi M. 2011. Absorption enhancement effect of acylcarnitines through changes in tight junction protein in Caco-2 cell monolayers. Drug Metab Pharmacokinet. 26:162–170.
- Gillani TB, Rawling T, Murray M. 2014. Cytochrome P450-mediated biotransformation of sorafenib and its n-oxide metabolite: implications for cell viability and human toxicity. Chem Res Toxicol. 28:92–102.
- Hornecker M, Blanchet B, Billemont B, Sassi H, Ropert S, Taieb F, Mir O, Abbas H, Harcouet L, Coriat R, et al. 2012. Saturable absorption of sorafenib in patients with solid tumors: a population model. Invest New Drugs. 30:1991–2000.
- Kim A, Widemann BC, Krailo M, Jayaprakash N, Fox E, Weigel B, Blaney SM. 2015. Phase 2 trial of sorafenib in children and young adults with refractory solid tumors: a report from the Children's Oncology Group. Pediatr Blood Cancer. 62:1562–1566.
- Lathia C, Lettieri J, Cihon F, Gallentine M, Radtke M, Sundaresan P. 2006. Lack of effect of ketoconazole-mediated CYP3A inhibition on sorafenib clinical pharmacokinetics. Cancer Chemother Pharmacol. 57:685–692.
- Li H, Liu L, Xie L, Gan D, Jiang X. 2016. Effects of berberine on the pharmacokinetics of losartan and its metabolite EXP3174 in rats and its mechanism. Pharm Biol. 54:2886–2894.
- Qi XY, Liang SC, Ge GB, Liu Y, Dong PP, Zhang JW, Wang AX, Hou J, Zhu LL, Yang L, et al. 2013. Inhibitory effects of sanguinarine on human liver cytochrome P450 enzymes. Food Chem Toxicol. 56:392–397.
- Schmithals C, Koberle V, Korkusuz H, Pleli T, Kakoschky B, Augusto EA, Ibrahim AA, Arencibia JM, Vafaizadeh V, Groner B, et al. 2015. Improving drug penetrability with iRGD leverages the therapeutic response to sorafenib and doxorubicin in hepatocellular carcinoma. Cancer Res. 75:3147–3154.
- Shimada M, Okawa H, Kondo Y, Maejima T, Kataoka Y, Hisamichi K, Maekawa M, Matsuura M, Jin Y, Mori M, et al. 2015. Monitoring serum levels of sorafenib and its n-oxide is essential for long-term sorafenib treatment of patients with hepatocellular carcinoma. Tohoku J Exp Med. 237:173–182.
- Tlemsani C, Huillard O, Arrondeau J, Boudou-Rouquette P, Cessot A, Blanchet B, Thomas-Schoemann A, Coriat R, Durand JP, Giroux J, et al. 2015. Effect of glucuronidation on transport and tissue accumulation of tyrosine kinase inhibitors: consequences for the clinical management of sorafenib and regorafenib. Expert Opin Drug Metab Toxicol. 11:785–794.
- Wang X, Zhang X, Huang X, Li Y, Wu M, Liu J. 2015. The drug–drug interaction of sorafenib mediated by P-glycoprotein and CYP3A4. Xenobiotica. 18:1–8.
- Wang XQ, Fan JM, Liu YO, Zhao B, Jia ZR, Zhang Q. 2011. Bioavailability and pharmacokinetics of sorafenib suspension, nanoparticles and nanomatrix for oral administration to rat. Int J Pharm. 419:339–346.
- Zimmerman EI, Roberts JL, Li L, Finkelstein D, Gibson A, Chaudhry AS, Schuetz EG, Rubnitz JE, Inaba H, Baker SD. 2012. Ontogeny and sorafenib metabolism. Clin Cancer Res. 18:5788–5795.