
 ?Mathematical formulae have been encoded as MathML and are displayed in this HTML version using MathJax in order to improve their display. Uncheck the box to turn MathJax off. This feature requires Javascript. Click on a formula to zoom.
Abstract
Context: Salvianolic acid A (Sal A) is a hydrophilic bioactive compound isolated from Salvia miltiorrhiza Bunge (Lamiaceae). It exerts beneficial effects after oral administration on diabetic complications.
Objective: To systematically study the absorption, distribution and excretion of Sal A after single-dose oral administration.
Materials and methods: Animal experiments were conducted in Sprague-Dawley rats. Plasma was sampled at designated times after oral doses of 5, 10 and 20 mg/kg, and an intravenous dose of 50 μg/kg. Tissues were harvested at 10, 60 and 120 min postdosing. Bile, urine and feces were collected at specified intervals before and after dosing. Absorption and distribution characteristics were analyzed by LC–MS, and excretion characteristics were analyzed by UPLC–MS/MS. The Caco-2 cell model was applied to investigate potential mechanisms.
Results: The Cmax (5 mg/kg: 31.53 μg/L; 10 mg/kg: 57.39 μg/L; 20 mg/kg: 111.91 μg/L) of Sal A increased linearly with doses (r> 0.99). The calculated absolute bioavailability was 0.39–0.52%. Transport experiment showed poor permeability and the ratio of PB–A to PA–B was 3.13–3.97. The highest concentration of Sal A was achieved in stomach followed by small intestine and liver, and it could also be detected in brain homogenate. Approximately 0.775% of its administered dose was excreted via feces, followed by bile (0.00373%) and urine (0.00252%).
Discussion and conclusions: These results support the future development of Sal A as an oral drug for the treatment of diabetic complications. Future research should be conducted to investigate the reason for its poor bioavailability and improve this situation.
Introduction
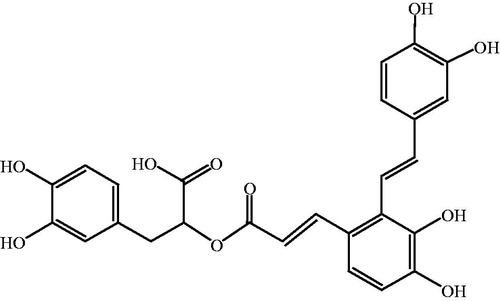
Traditional Chinese medicines (TCMs) are natural therapeutic agents used according to the guiding theory of traditional Chinese medical science. Danshen, the dry root or rhizome of Salvia miltiorrhiza Bunge (Lamiaceae), has been used for thousands of years for the treatment of cardiocerebral vascular diseases (Huang et al. Citation2016), chronic renal failure (Cai et al. Citation2018), retinopathy (Zhang et al. Citation2013) and liver dysfunction (Xu et al. Citation2013). Salvianolic acid A (Sal A) is the main hydrophilic bioactive compound of Danshen. The chemical structure of Sal A is shown in . Pharmacological studies found that Sal A exerted various therapeutic activities after intravenous administration, such as cardiac protection against ischemia reperfusion injury (Chen et al. Citation2016), inhibition of platelet aggregation (Yuan et al. Citation2017), reduction of oxygen radicals’ release (Gu et al. Citation2017), and inhibition of tumor growth (Zheng et al. Citation2015).
Figure 1. Chemical structure of Sal A.
Some recent research showed that the administration route of Sal A was not limited to intravenous administration. It could also play a therapeutic effect after oral administration, such as the protective function on diabetic complications including beneficial effects on plantar microcirculation and peripheral neurological dysfunction (Yang et al. Citation2011b; Yu et al. Citation2012; Hou et al. Citation2017), and protective effect against diabetic vascular endothelial dysfunction (Yang et al. Citation2011a).
In order to promote the development of Sal A as a potential oral drug for the treatment of diabetic complications, it is necessary to systematically study the metabolic characteristics of Sal A monomer, including absorption, distribution and excretion. The intravenous pharmacokinetics of Sal A has been reported in many articles, using either Sal A alone or as a part of an herbal mixture (Zhao et al. Citation2011; Wang et al. Citation2013; Feng et al. Citation2017; Wang et al. Citation2017). In contrast, oral pharmacokinetic studies of this compound were rare.
Currently, there are only two reports regarding the pharmacokinetics of Sal A after oral administration in pure form; one in Sprague-Dawley rats (Pei et al. Citation2008) and the other in Beagle dogs (Sun et al. Citation2013). Absolute bioavailability of the compound was only reported in the latter one, which was calculated to be 1.25% in dogs. Another report concerning the bioavailability of Sal A studied the pharmacokinetics of salvianolic acid extract at a high oral dose of 800 mg/kg in rats (Lai et al. Citation2011). The mixture mainly consisted of salvianolic acid B (50.6%), rosmarinic acid (3.92%) and Sal A (5.71%). The absolute bioavailability of Sal A was calculated to be 2.5%, twice the value in dogs. Drug interactions tend to exist when drugs are used in combination, and pharmacokinetic interactions were observed among the components of Salvia miltiorrhiza extract (Chang et al. Citation2010). Based on the above studies, some questions were raised. Is the numerical difference caused by species differences or drug interactions? In addition, can Sal A reach an effective concentration after oral administration under such low bioavailability? To figure out the answers, it is necessary to study the metabolic dynamics of Sal A after oral administration in rats in pure form.
Besides the absorption studies, the distribution and excretion characteristics of Sal A have not been reported so far. Systematically studying the oral pharmacokinetic behavior of Sal A in rats, including absorption and the related mechanisms, distribution and excretion, is of great value in promoting its subsequent development.
Materials and methods
Chemicals and reagents
Sal A was isolated from the roots of Salvia miltiorrhiza by our laboratory. Raw material was collected in October 2009; the plant identification was conducted by associate professor Lin Ma of the Institute of Materia Medica, Chinese Academy of Medical Sciences, Beijing, China. A voucher specimen (No. NCPS008) was deposited in the laboratory for further reference. Taking the dried roots of Salvia miltiorrhiza as raw material, Sal A was isolated after crushing, solvent extraction, macroporous resin column separation, concentration, and drying processes, with a purity of over 94% by HPLC analysis (Du et al. Citation2012).
Butyl paraben (internal standard, IS) was obtained from the National Institutes for Food and Drug Control (Beijing, China). Caco-2 cells were bought from American Type Culture Collection (VA, USA). Acetonitrile (CH3CN, LC–MS-grade) and methanol (MeOH, LC–MS-grade) were purchased from J.T. Baker (Seattle, WA). Formic acid (HCOOH, HPLC-grade) was obtained from TEDIA (Fairfield). All the other reagents were of analytical grade. Hydrochloric acid (HCl) and ethyl acetate (EtOAc) were purchased from Beijing Chemical Reagent Co. (Beijing, China). Ascorbic acid (Vitamin C, VC) was from Sigma-Aldrich (St. Louis, MO). Minimal essential medium nonessential amino acid (MEM NEAA), sodium pyruvate, penicillin–streptomycin and HEPES were obtained from GIBCO (Langley, OK). Transwell plates were obtained from CORNING (Corning, NY). Anticoagulation tubes with heparin were from Jiangsu Kangjian Healthcare Co. Ltd (Taizhou, Jiangsu, China). Watsons distilled water (Hongkong, China) was used throughout the study.
Instrumentations and conditions
An Agilent 1200 liquid chromatography-6110 mass spectrometer (California) was used to determine Sal A’s concentration in plasma, Hank’s Balanced Salt Solution (HBSS) and tissue samples by our reported LC–MS method (Sun et al. Citation2013) in negative ion mode.
Typical parameters for mass spectrum were set as follows: the spray chamber parameters, including capillary voltage, nebulizer pressure, drying gas flow rate and drying gas temperature were –3,000 V, 35 psig, 10 L/min and 350 °C, respectively; the compound parameters, including frag mentor, gain and dwell time were –75 V, 1.5 and 144 ms for both Sal A and IS, respectively. Target ions were monitored at m/z 493 for Sal A and 193 for IS.
LC separations were performed on a 3.5 μm Agilent Zorbax SB-C18 (100 × 2.1 mm, i.d.) at 30 °C with an Agilent Zorbax SB-C18 guard column used before the analytical column. The mobile phase, which was mixed with solvent A (H2O, containing 0.05% HCOOH) and solvent B (CH3CN, containing 0.05% HCOOH), was gradient elution at a flow rate of 0.3 mL/min. Initial condition of the gradient program was solvent A–B (85:15, v/v) and changed to A–B (25:75, v/v) in 5 min, then returned to initial state at 5.01 min. Total running time was 10 min. The injection volume was 20 μL.
Due to the complex components and interference in the excretion samples, an UPLC–MS/MS method with a better separation and a higher resolution was applied to quantify the content of Sal A in urine, bile and feces samples. The UPLC–MS/MS system consisted of a Waters Acquity UPLC (MA) coupled to an AB ACIEX API 4000 triple-quadrupole mass spectrometer (Boston) equipped with a turbo ion spray ion source.
Typical parameters used in this method were set as follows: the source parameters, including curtain gas, gas 1, gas 2, collision gas (CAD), capillary temperature (TEM) and ion spray voltage, were set at 20, 40, 40, 6 psi, 500 °C and –4,000 V, respectively; the compound parameters, including declustering potential (DP), collision energy (CE), entrance potential (EP) and collision cell exit potential (CXP), were –70, –22, –10 and –10 V for both Sal A and IS, respectively. The MS detector was operated by multiple-reaction monitoring (MRM) method in the negative ion mode. The precursor-to-product ion transition for Sal A was m/z 493 → 295, and for IS was m/z 193 → 137.
LC separations were performed on a 1.7 μm ACQUITY UPLC BEH C18 column (50 × 2.1 mm, i.d.) at room temperature. The mobile phase, which was mixed with solvent A (H2O, containing 0.1% HCOOH) and solvent B (CH3CN, containing 0.1% HCOOH), was gradient elution at a flow rate of 0.5 mL/min. Initial condition of the gradient program was solvent A–B (90:10, v/v), kept for 0.5 min, changed to A–B (76:24, v/v) in 9.5 min, changed to A–B (10:90, v/v) at 10.2 min, and kept for 1 min, then returned to initial state at 11.5 min. Total running time was 12 min. The injection volume was 5 μL.
Pharmacokinetic study in vivo
Animals
Ninety-six healthy, intact Sprague–Dawley rats (male/female, 1/1, 185–215 g, Certificate No. SCXK 2006-0009) were purchased from Vital River Laboratories (Beijing, China). The rats were maintained in air-conditioned animal quarters with alternating 12 h light/dark cycles at a room temperature of 22 ± 2 °C and a relative humidity of 50 ± 10%. The rodents were given a commercial rat chow and water ad libitum. The experiment started after acclimation to the facilities for 7 days. All animal studies were conducted in accordance with “Principles of laboratory animal care” (NIH publication No. 85-23, revised 1985) and under protocols approved by the Ethic Committee of Laboratory Animals of the Affiliated Hospital of Qingdao University (QYFYKYLL 2013-2-4-01).
Experimental design
Rats were fasted overnight (∼12 h) and had free access to water throughout the experimental period. In our study, rats were treated as follows: 24 rats (male/female, 1/1) were given a single dose of Sal A at 50 μg/kg by intravenous injection; the remaining 72 rats were divided into three groups randomly (24 rats/group, male/female, 1/1) and were given a single oral dose of 5, 10 and 20 mg/kg, respectively. The doses applied in this study were determined according to, on the one hand, the doses applied in pharmacodynamic experiments in rats (Yang et al. Citation2011a; Yang et al. Citation2011b; Yu et al. Citation2012; Hou et al. Citation2017), and on the other hand, the results of our preliminary absorption experiments. The blood samples were taken crossly from the orbital sinus into tubes pretreated with heparin before dosing and subsequently at 0.083, 0.167, 0.25, 0.333, 0.5, 0.75, 1, 2, 4, 8, 12 and 24 h postdosing. After blood sampling, the samples were centrifuged at 4,500 rpm for 15 min at 4 °C to obtain 200 μL of plasma samples. These samples were immediately frozen and maintained at –80 °C until analysis.
Sample preparation
Plasma samples were thawed at room temperature before processing. To a 200 μL aliquot of plasma sample, 10 μL of VC (10 mg/mL) and 10 μL of the IS spiking solution (butyl paraben, 1 μg/mL) were added. Then, the mixture was acidified with 100 μL of 1 mol/L HCl and vortex-mixed with 800 μL of EtOAc for 3 min. After centrifugation at 13,400 rpm for 10 min, the upper organic layer was transferred to a clean Eppendorf tube. EtOAc (800 μL) was added again to the lower aqueous phase and the extraction process was repeated. The two upper organic layers were combined and evaporated to dryness under nitrogen at 30 °C. The residue was reconstituted in 100 μL of MeOH–H2O (50:50, v/v, containing VC 100 μg/mL). After centrifugation at 13,400 rpm for 5 min, 20 μL of the supernatant was injected to the LC–MS system.
Pharmacokinetics analysis
DAS pharmacokinetic software Data Analysis System Version 3.0 (Bontz Inc., Beijing, China) was used for pharmacokinetic analysis of Sal A concentrations. The noncompartmental model was applied for analysis of the data following intravenous and oral administration of Sal A. The peak plasma concentration (Cmax), the corresponding time (Tmax), the mean residence time (MRT) and the area under the concentration–time curve (AUC) could all be obtained.
Permeability study in Caco-2 monolayers
Cell culture
Caco-2 cells (passage number 34–36, American Type Culture Collection, Manassas, VA) were cultured at 37 °C in an atmosphere of 5% CO2 and 90% relative humidity in Dulbecco’s modified Eagle’s medium supplemented with 10% fetal bovine serum, 1% penicillin–streptomycin, 1% HEPES, 1% sodium pyruvate and 1% minimal essential medium nonessential amino acids. After harvesting at 90% confluence, the cells were seeded on to 0.4 μm polycarbonate membrane transwell inserts (12 mm diameter) at a density of 1.5 × 10⁵ cells/cm2. The culture media was changed every other day during the first 7 days after seeding and once a day thereafter. Cell monolayers were ready for experiments from 20 to 24 days postseeding.
Transport experiments in the Caco-2 cell culture model
Experiments in triplicate were performed in HBSS (pH =7.4).To ensure the stability of Sal A in HBSS, VC was applied in this study as stabilizer. The monolayers were washed three times with prewarmed HBSS (37 °C) before use. The integrity of the Caco-2 monolayers was monitored by measuring the transepithelial electrical resistance, and only monolayers with values ≥400 Ω/cm2 were used. The monolayers were incubated with HBSS at 37 °C for 30 min, and then the incubation medium was aspirated. Afterwards, bidirectional transport experiments were conducted. Sal A solution of appropriate concentrations in HBSS (containing VC 1 0−4 mol/L) were loaded to the donor compartments and the blank HBSS (containing VC 1 0−4 mol/L) was added to the receiver compartments. Seven sequential samples (50 μL) were collected at different times (0, 30, 60, 90, 120, 150, 180 min) from the receiver side. The same volume of receiver medium was replaced after each sampling. The collected samples were added into tubes with 40 μL MeOH–H2O (50:50, v/v, containing VC 100 μg/mL). Then, 10 μL of the IS spiking solution (butyl paraben, 1 μg/mL) was added. After centrifugation at 13,400 rpm for 5 min, 20 μL of the supernatant was injected to the LC–MS system.
Influence of the stabilizer on the transport of Sal A has also been tested under the condition of different concentrations of VC. The samples were collected, treated and analyzed according to the same procedure.
Data analysis
The apparent permeability coefficient (Papp) was calculated according to the following equation:
where ΔQ/Δt is the linear appearance rate of the tested compound in the receiver compartments, A is the surface area of the cell monolayer and C0 is the initial concentration of the tested compound in the donor side.
Tissue distribution of Sal A in rats
Animals
Twenty-four healthy, intact Sprague–Dawley rats (male/female, 1/1, 185–215 g, Certificate No. SCXK 2006-0009) were purchased from Vital River Laboratories (Beijing, China). The rats were maintained in air-conditioned animal quarters with alternating 12 h light/dark cycles at a room temperature of 22 ± 2 °C and a relative humidity of 50 ± 10%. The rodents were given a commercial rat chow and water ad libitum. The experiment started after acclimation to the facilities for 7 days. The animal protocols used in this study followed guidelines set forth by the Ethic Committee of Laboratory Animals of the Affiliated Hospital of Qingdao University (QYFYKYLL 2013-2-4-01).
Experimental design
Rats were fasted overnight (∼12 h) and had free access to water throughout the experimental period. In our study, rats were treated as followed: 18 rats were divided into 3 groups randomly (6 rats/group, male/female =1/1) and were all given a single oral dose of 5 mg/kg. The animals were sacrificed 10 min, 1 and 2 h postdosing and stomach, small intestine, heart, liver, spleen, lung, kidney and brain were harvested for drug analysis. The remaining six rats were given normal saline as control. Tissue samples were frozen and maintained at –80 °C immediately until analysis.
Sample preparation
Tissues were homogenized in normal saline (2 mL/g, except 6 mL/g for stomach) using a FLUKO F6/10 for 1–2 min over an ice bath. The aliquots of 200 μL homogenized tissues were used for the LC–MS analysis. The remaining steps were the same as sample preparation in “Pharmacokinetic study in vivo”.
Excretion of Sal A from rats
Animals
Twelve healthy, intact Sprague–Dawley rats (male/female, 1/1, 185–215 g, Certificate No. SCXK 2006-0009) were purchased from Vital River Laboratories (Beijing, China). The rats were maintained in air-conditioned animal quarters with alternating 12 h light/dark cycles at a room temperature of 22 ± 2 °C and a relative humidity of 50 ± 10%. The rodents were given a commercial rat chow and water ad libitum. The experiment started after acclimation to the facilities for 7 days. The studies were conducted under protocols approved by the Ethics Committee of Laboratory Animals of the Affiliated Hospital of Qingdao University (QYFYKYLL 2013-2-4-01).
Experimental design
In the urine and feces excretion studies, rats were treated as follows. After acclimation to the facilities for 7 days in metabolism cages and being fasted overnight (∼12 h) with free access to water, six rats (male/female, 1/1) were given a single dose of Sal A at 20 mg/kg orally. Blank feces and urine were got prior to administration. Feces samples were collected from 0 to 12, 12 to 24, 24 to 48, 48 to 72 and 72 to 96 h. Urine samples were collected from 0 to 6, 6 to 12, 12 to 24, 24 to 48, 48 to 72 and 72 to 96 h. These samples were immediately frozen and maintained at –80 °C until analysis.
In the bile excretion study, rats were treated as follows. After acclimation to the facilities for 7 days and being fasted overnight (∼12 h) with free access to water, six rats (male/female, 1/1) received a bile duct intubation surgery. An oral dose of 20 mg/kg were given to the postoperative awake rats, and bile samples were collected prior and after the administration (from 0 to 2, 2 to 4, 4 to 6, 6 to 8, 8 to 12 and 12 to 24 h). The samples were immediately frozen and maintained at –80 °C immediately until analysis.
Sample preparation
After drying, feces were soaked in purified water containing VC 100 μg/mL (5 mL/g) overnight and treated with ultrasonic for 10 min. Homogenate was centrifuged at 13,400 rpm for 10 min. 200 μL of the supernatant was got for the UPLC–MS/MS analysis, along with 200 μL of urine and bile samples. Sample preparation was the same as sample preparation in “Pharmacokinetic study in vivo”.
Statistical analysis
The data in this paper were presented as mean ± SEM, if no specified otherwise. Significant differences were assessed using unpaired Student’s t test. A p value of <0.05 was considered as statistically significant.
Results
Pharmacokinetic studies
After intravenous and oral administration of Sal A to rats, plasma concentration was determined by LC–MS. The data obtained from each group was averaged. and showed the mean plasma concentration–time curves of Sal A in rats receiving oral doses of 5, 10 and 20 mg/kg and an intravenous dose of 50 µg/kg, respectively. The pharmacokinetic parameters derived from plasma concentration–time profiles were summarized in . The oral bioavailability (F) was calculated by using AUCoral/dose divided by AUCiv/dose.
Figure 2. The mean plasma concentration–time curves of Sal A following single oral doses of 5, 10 and 20 mg/kg to rats (n= 12).
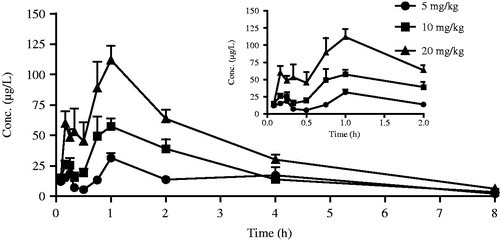
Figure 3. The mean plasma concentration–time curve of Sal A following a single intravenous dose of 50 µg/kg to rats (n= 12).
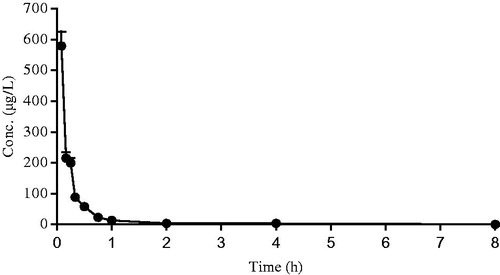
Table 1. Pharmacokinetics parameters of Sal A in rats (n= 12).
After oral administration, Sal A reached its peak concentration in plasma within 1 h, indicating that this phenolic acid was readily absorbed. Plasma levels of Sal A decreased rapidly after dosing, and the calculated half-life period (t1/2) was 1.72–1.96 h, which was shorter than that observed after intravenous administration (6.16 h). The Cmax values were estimated to be 31.53, 57.39 and 111.91 µg/L, respectively. The AUC increased with increasing doses, and the AUC(0–t) values were 105.93, 167.18 and 317.11 (µg/L h), respectively. The good linearity of the kinetics of Sal A after oral administration was observed in the regression analysis of the AUC–dose plot (r> 0.99) and the Cmax–dose plot (r> 0.99). The calculated oral bioavailability was quite low, ranging from 0.39 to 0.52%.
Transport of Sal A across Caco-2 cell monolayer
The Caco-2 transport model, which was recognized by FDA, has been widely used to classify the absorption characteristics of a compound (Lu et al. Citation2008; Yang et al. Citation2010). summarized the Papp values for different concentrations of Sal A (1 0−4/27, 1 0−4/9 and 1 0−4/3 mol/L) from the apical to basolateral and basolateral to apical sides of the Caco-2 cell model. Influence of VC to the bidirectional transport was investigated and the results were shown in .
Table 2. Apparent permeability for different concentrations of Sal A in Caco-2 cell monolayer (n= 3).
Table 3. Apparent permeability for Sal A (10–4/9 mol/L) under the conditions of different VC concentrations in Caco-2 cell monolayer (n= 3).
A compound might be absorbed poorly, moderately or well with a Papp value of <1 × 1 0−6, 1 × 1 0−6–10 × 1 0−6, or >10 × 1 0−6 cm/s, respectively. Accordingly, the measured Papp value of Sal A was 1 × 1 0−7–7 × 1 0−7 cm/s (<1 × 1 0−6 cm/s), suggesting a poor membrane permeability. The ratio of the Papp values of basolateral to apical and apical to basolateral were about three in our experiment, indicating that the transport of Sal A across the Caco-2 monolayer involved an active transport mechanism.
Due to the instability of Sal A in the partial neutral environment of Hanks, we have applied VC as a stabilizer, and the impact of VC to the results were shown in . Statistical analysis showed that there was no significant difference in the amount of Sal A transported across the Caco-2 monolayer at different VC concentrations (p> 0.05), which meant that VC did not affect the transportation of Sal A.
Tissue distribution of Sal A in rats
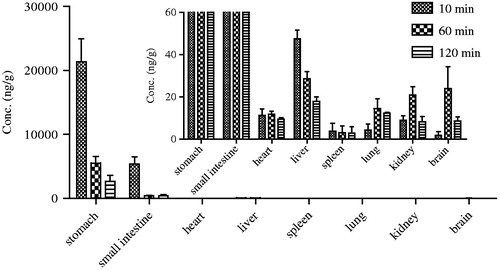
The tissue distribution of Sal A after a single oral dose of 5 mg/kg in rats at 10 min, 1 and 2 h was presented in . Results showed that Sal A could distribute widely in various organs in vivo, including the stomach, small intestine, heart, liver, spleen, lung, kidney and brain. Furthermore, Sal A was found to distribute into tissues within 10 min after oral administration which meant that it had a rapid and wide distribution. The highest tissue concentration was found in stomach and was much higher than in all the other organs, which was relative to the route of administration and the acidic nature of Sal A. Besides the gastrointestinal tract, Sal A had a relative high distribution in liver, followed by heart, lung and kidney, which implied that the distribution of Sal A depended on the blood flow or perfusion rate of the organ. In addition, Sal A could also be detected in brain homogenate, suggesting that it could efficiently cross the blood–brain barrier which provided a basis for the curative effect against peripheral neurological dysfunction in diabetic rats (Yu et al. Citation2012).
Figure 4. Tissue distribution of Sal A at 10, 60 and 120 min following a single-dose oral administration of 5 mg/kg to rats (n= 6).
Excretion of Sal A from rats
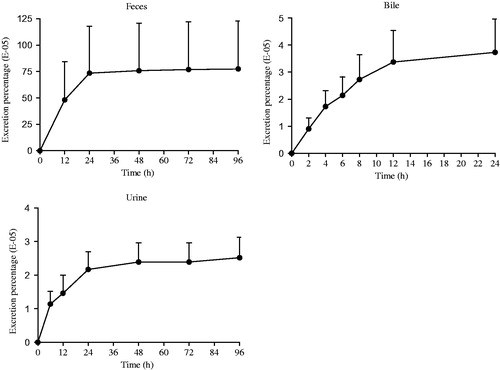
After a single oral administration of Sal A (20 mg/kg) to intact rats, the major route of elimination of the compound was via feces (a mean of 0.775% of the dose). Bile elimination was minor (a mean of 0.00373%) followed by urinary excretion (a mean of 0.00252%). Results were shown in . The elimination of prototype drug was rapid in both sexes, but the recovery was less than 1% of the administered dose which indicated that a large proportion of Sal A must be metabolized or transformed in vivo.
Figure 5. Excretion–time curves of Sal A following a single-dose oral administration of 20 mg/kg to rats (n= 6).
Discussion and conclusions
In the current study, the absorption, distribution and elimination of Sal A after a single oral administration at doses ranging from 5 to 20 mg/kg have been fully characterized in rats.
After taken orally, Sal A was absorbed rapidly in rats (Tmax=1 h), which was consist with the former report (Pei et al. Citation2008). The total exposure increased linearly over the dose range of 5–20 mg/kg, and the peak exposure was directly related to the dose. A short t1/2 (1.72–1.96 h) indicated that Sal A was rapidly eliminated from the body at experimental doses and the similar absorption trend was also found in our previous Beagle dog study (Sun et al. Citation2013). The plasma half-life was much longer in the intravenous experiment (6.16 h) and the pharmacokinetic study after oral administration at the dose of 100 mg/kg (3.29 h) (Pei et al. Citation2008). The explanation was that the elimination rate of Sal A in organism was limited and the metabolic enzyme activity was saturated.
The mean plasma concentration–time curve of Sal A after oral administration showed significant double peaks which was mainly caused by the enterohepatic circulation. Besides, the results of tissue distribution showed that Sal A had an extensive and high distribution. Re-release from tissues might also lead to the increase of plasma concentration and result in the multimodal phenomenon.
The absolute bioavailability of Sal A administered by the oral route in pure form was calculated to be 0.39–0.52%, which was less than the value reported by Lai et al. (Citation2011) (2.5%). Based on these results, we speculated that salvianolic acid B and rosmarinic acid might promote the absorption of Sal A. The MRT and t1/2 in both experiments were consistent, indicating that the two compounds might not affect the clearance of Sal A. Compared with our former study in Beagle dogs (Sun et al. Citation2013), no species difference was observed. The instability of Sal A in the intestinal alkaline environment (Liu et al. Citation2011) and the first-pass metabolism might contribute to its low absorption. Based on our results in rats and Beagle dogs, we speculate that the bioavailability of Sal A in humans should be relatively low. However, it is known that the metabolizing enzymes of the test system (rat and dog) and human are quite different and distinct. Therefore, experiments performed in monkeys that are closest to human should be conducted later to obtain more credible results. In addition, the metabolic differences between rats and humans will be evaluated through an in vitro liver microsomal incubation system in our subsequent studies.
Results of permeability study in Caco-2 monolayer showed that Papp value of Sal A was less than 1 × 1 0−6 cm/s, which meant that Sal A had a poor permeability. The preceding Caco-2 data suggested that the gastrointestinal absorption of Sal A was characterized by passive diffusion (Lu et al. Citation2008). However, the ratio of the Papp values of basolateral to apical and apical to basolateral were about 3 in our experiment, indicating that the transport of Sal A across the Caco-2 monolayer involved an active transport mechanism. This was probably caused by the extremely low transport and the low concentrations measured. Besides, the instability of Sal A in the partial neutral environment of Hanks and the lack of stabilizer could also influence the result. Caco-2 cells had high expression levels of the multidrug transporters P-gp and MRP2. The active transport mechanism involved in the transportation of Sal A remains to be done in the future.
The accumulated excretion percentage of Sal A through feces, bile and urine was less than 1% of dosage. Five metabolites of Sal A were identified as Sal A-monoglucuronide, monomethyl-Sal A-monoglucuronide, mono-methyl-Sal A, dimethyl-Sal A and dimethyl-Sal A-monoglucuronide by Shen et al. (Citation2009) in plasma, which indicated two metabolic pathways (methylation and glucuronidation) of Sal A in vivo. Han et al. (Citation2012) further figured out two major isoforms of UGTs, UGT1A1 and UGT1A9, that catalyzed the glucuronidation of Sal A. Besides phase II drug metabolism, Sal A was found instable in distilled water even at room temperature (Xu et al. Citation2008). Xu et al. (Citation2011) isolated and identified six different degradation products by NMR and LC–MS analysis, including four mono-oxygenation products and two dehydrogenation products. According to our result and the former reports, the majority of the administered drug was degraded into its oxidation forms or metabolized to be its glucuronidation and methylation products in vivo.
Previous pharmacological studies in our laboratory found that Sal A exerted beneficial effects after oral administration on plantar microcirculation and peripheral neurological dysfunction, and could protect against vascular endothelial dysfunction in diabetic rats (Yang et al. Citation2011a; Yang et al. Citation2011b; Yu et al. Citation2012; Hou et al. Citation2017). Pharmacological experiments showed that Sal A exerted curative effect in glucose consumption experiment and insulin collaborative experiment in vitro at the concentration of 1 0−10–1 0−6 mol/L. Results of our experiment showed that Sal A could be detected in brain homogenate, which provided a basis for the curative effect against peripheral neurological dysfunction in diabetic rats. Furthermore, after oral administration of Sal A at the similar dosage as applied in pharmacodynamic experiments in vivo, concentration of Sal A could reach the effective level as in vitro, which provided evidence for its therapeutic effects on diabetic complications after oral administration.
In conclusion, this study was the first to systematically characterize the pharmacokinetic properties of Sal A after oral administration in rats and the results could support its future development as an oral drug for the treatment of diabetic complications. Further study of its interaction with other substances is of significance for improving its bioavailability. In addition, the role of drug transporters and first-pass metabolism in the low bioavailability of Sal A and the metabolic differences between rats and humans remain to be studied in the future.
Disclosure statement
The authors declare no conflict of interest.
Additional information
Funding
References
- Cai H, Su S, Li Y, Zeng H, Zhu Z, Guo J, Zhu Y, Guo S, Yu L, Qian D, et al. 2018. Protective effects of Salvia miltiorrhiza on adenine-induced chronic renal failure by regulating the metabolic profiling and modulating the NADPH oxidase/ROS/ERK and TGF-β/Smad signaling pathways. J Ethnopharmacol. 212:153–165.
- Chang BB, Zhang L, Cao WW, Cao Y, Yang WL, Wang Y, Chen YC, Liu XQ. 2010. Pharmacokinetic interactions induced by content variation of major water-soluble components of Danshen preparation in rats. Acta Pharmacol Sin. 31:638–646.
- Chen Q, Xu T, Li D, Pan D, Wu P, Luo Y, Ma Y, Liu Y. 2016. JNK/PI3K/Akt signaling pathway is involved in myocardial ischemia/reperfusion injury in diabetic rats: effects of salvianolic acid A intervention. Am J Transl Res. 8:2534–2548.
- Du GH, Zhang WK, Zhang L, Zhao Y, Wang SB, Yang HG, Tian S, Inventors. INST MATERIA MEDICA CAMS, Assignee. 2012. Method for preparing salvianolic acid A bulk drug. China patent CN102731308A.
- Feng SQ, Aa N, Geng JL, Huang JQ, Sun RB, Ge C, Yang ZJ, Wang LS, Aa JY, Wang GJ. 2017. Pharmacokinetic and metabolomic analyses of the neuroprotective effects of salvianolic acid A in a rat ischemic stroke model. Acta Pharmacol Sin. 38:1435–1444.
- Gu X, Zheng C, Zheng Q, Chen S, Li W, Shang Z, Zhang H. 2017. Salvianolic acid A attenuates early brain injury after subarachnoid hemorrhage in rats by regulating ERK/P38/Nrf2 signaling. Am J Transl Res. 9:5643–5652.
- Han DE, Zheng Y, Chen X, He J, Zhao D, Yang S, Zhang C, Yang Z. 2012. Identification and characterization of human UDP–glucuronosyltransferases responsible for the in vitro glucuronidation of salvianolic acid A. Drug Metab Pharmacokinetics. 27:579–585.
- Hou B, Qiang G, Zhao Y, Yang X, Chen X, Yan Y, Wang X, Liu C, Zhang L, Du G. 2017. Salvianolic acid A protects against diabetic nephropathy through ameliorating glomerular endothelial dysfunction via inhibiting AGE–RAGE signaling. Cell Physiol Biochem. 44:2378–2394.
- Huang W, Yang Y, Zeng Z, Su M, Gao Q, Zhu B. 2016. Effect of Salvia miltiorrhiza and ligustrazine injection on myocardial ischemia/reperfusion and hypoxia/reoxygenation injury. Mol Med Rep. 14:4537–4544.
- Lai XJ, Zhang L, Li JS, Liu HQ, Liu XH, Di LQ, Cai BC, Chen LH. 2011. Comparative pharmacokinetic and bioavailability studies of three salvianolic acids after the administration of Salviae miltiorrhizae alone or with synthetical borneol in rats. Fitoterapia 82:883–888.
- Liu DF, Wen HL, Li ZY, Cheng F, Yang XL. 2011. Stability study of salvianolic acid A in aqueous solution. Jiangxi J Trad Chin Med. 42:58–59.
- Lu T, Yang J, Gao X, Chen P, Du F, Sun Y, Wang F, Xu F, Shang H, Huang Y, et al. 2008. Plasma and urinary tanshinol from Salvia miltiorrhiza (Danshen) can be used as pharmacokinetic markers for cardiotonic pills, a cardiovascular herbal medicine. Drug Metab Dispos. 36:1578–1586.
- Pei L, Bao Y, Wang H, Yang F, Xu B, Wang S, Yang X, Du G. 2008. A sensitive method for determination of salvianolic acid A in rat plasma using liquid chromatography/tandem mass spectrometry. Biomed Chromatogr. 22:786–794.
- Shen Y, Wang X, Xu L, Liu X, Chao R. 2009. Characterization of metabolites in rat plasma after intravenous administration of salvianolic acid A by liquid chromatography/time-of-flight mass spectrometry and liquid chromatography/ion trap mass spectrometry. Rapid Commun Mass Spectrom. 23:1810–1816.
- Sun J, Zhang L, Song J, Tian S, Huang C, Feng Z, Lv Y, Du G. 2013. Pharmacokinetic study of salvianolic acid A in beagle dog after oral administration by a liquid chromatography–mass spectrometry method: a study on bioavailability and dose proportionality. J Ethnopharmacol. 148:617–623.
- Wang H, Li X, Zhang W, Liu Y, Wang S, Liu X, He H. 2017. Mechanism-based pharmacokinetic-pharmacodynamic modeling of salvianolic acid A effects on plasma xanthine oxidase activity and uric acid levels in acute myocardial infarction rats. Xenobiotica 47:208–216.
- Wang SP, Liu L, Wang LL, Jiang P, Xiang L, Zhang WD, Liu RH. 2013. Simultaneous determination of six hydrophilic components in rat plasma after oral administration of Jitai tablet by liquid chromatography-electrospray ionization–tandem mass spectrometry: application to a pharmacokinetic study. J Chromatogr B Anal Technol Biomed Life Sci. 912:75–84.
- Xu J, Zeng S, Chen X, Qu H. 2011. Isolation and identification of degradation products of salvianolic acid A by NMR and LC–MS. Fitoterapia 82:260–266.
- Xu JZ, Shen J, Cheng YY, Qu HB. 2008. Simultaneous detection of seven phenolic acids in Danshen injection using HPLC with ultraviolet detector. J Zhejiang Univ Sci B. 9:728–733.
- Xu X, Hu Y, Zhai X, Lin M, Chen Z, Tian X, Zhang F, Gao D, Ma X, Lv L, et al. 2013. Salvianolic acid A preconditioning confers protection against concanavalin A-induced liver injury through SIRT1-mediated repression of p66shc in mice. Toxicol Appl Pharmacol. 273:68–76.
- Yang XY, Qiang GF, Zhang L, Zhu XM, Wang SB, Sun L, Yang HG, Du GH. 2011a. Salvianolic acid A protects against vascular endothelial dysfunction in high-fat diet fed and streptozotocin-induced diabetic rats. J Asian Nat Prod Res. 13:884–894.
- Yang XY, Sun L, Xu P, Gong LL, Qiang GF, Zhang L, Du GH. 2011b. Effects of salvianolic acid A on plantar microcirculation and peripheral nerve function in diabetic rats. Eur J Pharmacol. 665:40–46.
- Yang Z, Gao S, Yin T, Kulkarni KH, Teng Y, You M, Hu M. 2010. Biopharmaceutical and pharmacokinetic characterization of matrine as determined by a sensitive and robust UPLC–MS/MS method. J Pharm Biomed Anal. 51:1120–1127.
- Yu X, Zhang L, Yang X, Huang H, Huang Z, Shi L, Zhang H, Du G. 2012. Salvianolic acid A protects the peripheral nerve function in diabetic rats through regulation of the AMPK-PGC1α-Sirt3 axis. Molecules (Basel, Switzerland) 17:11216–11228.
- Yuan X, Xiang Y, Zhu N, Zhao X, Ye S, Zhong P, Zeng C. 2017. Salvianolic acid A protects against myocardial ischemia/reperfusion injury by reducing platelet activation and inflammation. Exp Ther Med. 14:961–966.
- Zhang L, Dai SZ, Nie XD, Zhu L, Xing F, Wang LY. 2013. Effect of Salvia miltiorrhiza on retinopathy. Asian Pac J Trop Med. 6:145–149.
- Zhao D, Han DE, Li N, Lu Y, Li TT, Yang SY, He JK, Chen XJ. 2011. Simultaneous determination of six phenolic constituents of Danshen injection in rat plasma by LC–ESI–MS and its application to a pharmacokinetic study. Eur J Mass Spectrom. 17:395–403.
- Zheng X, Chen S, Yang Q, Cai J, Zhang W, You H, Xing J, Dong Y. 2015. Salvianolic acid A reverses the paclitaxel resistance and inhibits the migration and invasion abilities of human breast cancer cells by inactivating transgelin 2. Cancer Biol Ther. 16:1407–1414.