
Abstract
Context
Cichorium intybus L. (Asteraceae) formula (CF) has been applied as a folk medicine to treat hyperuricemic nephropathy (HN). However, the exact mechanism remains unclear.
Objective
To explore the therapeutic effect and mechanism of CF on HN.
Materials and methods
Through network pharmacological methods, the targets of the active component of CF against HN were obtained. Subsequently, Male Wistar rats were divided into control, HN, allopurinol (50 mg/kg), CF high-dose (8.64 g/kg) and CF low-dose (2.16 g/kg) groups. The HN model was induced via intragastric administration of adenine (100 mg/kg) and ethambutol hydrochloride (250 mg/kg) for 3 weeks. After CF treatment, biochemical indicators including UA, UREA and CREA were measured. Then, HE staining, qRT-PCR and gut microbiota analysis were conducted to further explore the mechanism.
Results
The network pharmacology identified 83 key targets, 6 core genes and 200 signalling pathways involved in the treatment of HN. Compared to the HN group, CF (8.64 g/kg) significantly reduced the levels of UA, UREA and CREA (from 2.4 to 1.57 μMol/L, from 15.87 to 11.05 mMol/L and from 64.83 to 54.83 μMol/L, respectively), and mitigated renal damage. Furthermore, CF inhibited the expression of IL-6, TP53, TNF and JUN. It also altered the composition of gut microbiota, and ameliorated HN by increasing the relative abundance of some probiotics.
Conclusions
This work elucidated the therapeutic effect and underlying mechanism by which CF protects against HN from the view of the biodiversity of the intestinal flora, thus providing a scientific basis for the usage of CF.
Introduction
The prevalence of hyperuricaemia (HUA) is increasing dramatically in the United States and worldwide due to an ageing population, comorbidities and other lifestyle factors (Roman Citation2019). Hyperuricemic nephropathy (HN) is considered to be the most frequent complication of HUA other than gout (Johnson et al. Citation2013). Recently, several longitudinal and cross-sectional studies have proposed a strong correlation between serum uric acid (UA) levels and the occurrence and progression of chronic kidney disease (CKD) (Li et al. Citation2017; Liu et al. Citation2018). Some investigations even suggest elevated UA levels are a risk factor for kidney disease (Chou et al. Citation2015). Of note, UA is correlated with other risk factors for the progression of renal diseases, such as metabolic syndrome, microalbuminuria and hypertension (Fathallah-Shaykh and Cramer Citation2014; Yan et al. Citation2015). The pathogenesis of HN is highly sophisticated and has multiple pathways, including intrarenal inflammation, oxidative stress, induction of renal tubular damage, and endothelial dysfunction (Sharaf El Din et al. Citation2017). Nonetheless, the pathophysiological mechanisms of HN have not been entirely elucidated due to the complexity of its pathogenesis.
In Traditional Chinese Medicine (TCM) theory, the term ‘HUA’ did not exist. According to the symptoms and characteristics of complicated gout, HUA disease belongs to the category of ‘blockage syndrome’, ‘Lijie’ and gout in TCM, and the kidney diseases induced by HUA are referred to as ‘edoema’, ‘low back pain’, ‘asthenia’, etc. With the continuous advancement in the understanding of HUA in Chinese medicine, it has been acknowledged that phlegm dampness is the fundamental pathogenesis of HUA. Phlegm is generally divided into two types: one is tangible phlegm, which refers to the visible and accessible phlegm; The other is invisible phlegm, which mostly refers to the phlegm flowing in various viscera, meridians, skin, and other parts. Dampness is hydration, diffuse, without obvious form and quality. Phlegm and dampness are synonymous and similar, both due to abnormalities in water metabolism. Generally, it is considered that dampness condenses into phlegm, which is often referred to as phlegm dampness. Therefore, the treatment should emphasize tonification and purgation in combination, and adhere to the essential treatment of resolving phlegm and dehumidification. To attack the evil, we must give the devil a way out, the approach to dispel phlegm and dampness is to expel it through sweat, urine and stool. To tonifying deficiency, it is vital to regulate and tonify the lung, spleen, and kidney, enhance the energy of transportation and gasification, and block the source of phlegm and dampness, thus reducing the endogenous pathological products.
Uyghur medicine with a centuries-old history and an independent and complete theoretical system is an inseparable part of the treasure-house of TCM. The formula of Cichorium intybus L. (Asteraceae) originated from the Valuable Prescriptions for Emergency written by Sun Simiao. Cichorium intybus (CF) consisted of five herbs including Cichorii radix (the root of Cichorium intybus, Juju), Gardeniae fructus (the ripe fruit of Gardenia jasminoides J.Ellis [Rubiaceae], Zhizi), Lilii bulbus (the fleshly scale leaf of Lilium brownii F.E.Br. ex Miellez [Liliaceae], Baihe), Mori folium (the folium of Morus alba L. [Moraceae], Sangye) and Puerariae lobatae radix (the root of Pueraria lobata (Willd.) Ohwi [Fabacea], Gegen). Among them, Cichorii radix is the traditional medicinal material of Uygur people, which was considered a diuretic and cholagogue and is frequently used in the treatment of jaundice, edoema and oliguria (Rolnik and Olas Citation2021). Previous articles have demonstrated that chicory or chicory extract can decrease serum UA levels and ameliorate the progression of renal injury in HUA (Bian et al. Citation2018; Jin et al. Citation2018). Likewise, studies have assessed the uricosuric and nephroprotective effects of Fructus Gardenia extract (Hu et al. Citation2013). It has been indicated that the new water-soluble carbon dots of Pueraria lobata radix can lower the blood UA concentration and improve the degree of swelling and pathological damage in gouty arthritis by inhibiting the activity of xanthine oxidase (XO) in model rats (Wang X et al. Citation2019). And (Wan et al. Citation2018) have demonstrated the antioxidant activity and XO inhibitory effect of mulberry leaf ethanolic extract, indicating the potential future of mulberry leaves as a natural anti-hyperuricaemia drug. Although CF is typically prescribed for the treatment of gout, little is known about its effect on HN, or its potential mechanism of action.
Due to the multi-component, multi-target and multi-pathway synergistic effects of TCM, there is a lack of effective research methods to elucidate their molecular mechanisms. In recent years, network pharmacology has been used increasingly in the study of herbal prescriptions. Network pharmacology is an emerging interdisciplinary and frontier discipline that analyzes the association patterns between drugs and therapeutic diseases from a holistic perspective of systems and biological networks (Yuan et al. Citation2017; Luo et al. Citation2020). To investigate the mechanism of action of TCM at the molecular level, network pharmacology has upgraded the research protocol from the current ‘one-target-one-drug’ model to a novel ‘network target, multi-component’ model (Li and Zhang Citation2013).
The body excretes UA predominantly through the kidneys and intestines, with about 70% of UA excreted through the kidneys and most of the rest excreted in the faeces or further broken down and metabolized by the intestinal flora (de Oliveira and Burini Citation2012). The intestine is not only one of the excretory channels for UA but also a place where intestinal bacteria live and where intestinal flora and metabolites of HUA are interrelated. This means that an increase in soluble serum UA may alter the optimal physiological environment of the intestinal flora. And the composition of the gut microbiota in patients with gout has been clinically certificated to be distinct from that of healthy individuals (Guo et al. Citation2016). Intestinal bacteria and humans have co-evolved in symbiosis and play an essential role in maintaining normal physiological functions of the human body by influencing the nutrition, metabolism and immunity of the host. Intestinal bacteria constantly communicate with the host’s vital organ systems (e.g., brain, bone marrow, vascular constriction, kidney organs, immune system and autonomic nervous system) to regulate human health (Bravo et al. Citation2011; Jandhyala et al. Citation2015). There is now increasing evidence that the gut microbiota of patients with CKD is associated with the pathophysiological state and microenvironment of the host. Metabolites in the gut flora have also been linked to HUA. The ‘intestinal-renal axis’ theory well illustrates the bidirectional communication between intestinal flora and CKD (Evenepoel et al. Citation2017).
Therefore, in this study, to study the therapeutic effect of CF on HN and its mechanism of action, first of all, the active components of CF in the aqueous extracts were determined by ultra-performance liquid chromatography coupled with quadrupole time of flight mass spectrometry (UPLC/Q-TOF MS) analysis. Network pharmacology was then employed to capture the bioactive constituents and potential targets of CF for the treatment of HUA, which was further experimentally validated with adenine and ethambutol hydrochloride to construct the HN model. Ultimately, the impact of CF on intestinal microbiota was detected by high-throughput 16S rRNA sequencing.
Materials and methods
Preparations of CF, reagents, and instrument
All CF herbs () were purchased from Xinjiang Madison Pharmaceutical Co., Ltd. (Xinjiang, China) and appraised by Dr Jiachuan Li, a professor at the College of Pharmacy, Southwest Minzu University (Chengdu, China). Voucher specimens are stored in the herbarium of the College of Pharmacy, Southwest Minzu University (No. 20208110201 J). All accurately weighed herbs were extracted twice at 100 °C with deionised water reflux for 2 h each time. The aqueous solution obtained twice was mixed, filtered and concentrated in a rotary evaporator into a decoction. The decoction of the CF was stored at 4 °C for follow-up dosing experiments, and lyophilized in a freeze-dryer. Allopurinol tablets required in this study are purchased from Hefei Jiulian Pharmaceutical Co., Ltd. (Anhui, China). The adenine used in this study was bought from Shanghai Aladdin Biochemical Technology Co., Ltd. (Shanghai, China). Ethambutol hydrochloride tablets were obtained from Chengdu Jinhua Pharmaceutical Co., Ltd. (Chengdu, China). UPLC/Q-TOF MS analysis was performed on the quadrupole Orbitrap mass spectrometer (Q-Exactive, Thermo Scientific, USA).
Table 1. Composition of the Cichorium intybus formula (CF) and the properties of each crude drug.
UPLC/Q-TOF MS analysis
The chromatographic separation was carried out on a Hypersil GOLD C18 reversed-phase column (100 mm × 2.1 mm, 3 μm). The mobile phase was acetonitrile (A) and 0.1% (V/V) aqueous formic acid (B). Gradient elution with a flow rate of 0.3 mL/min was implemented as follows: 2%–5% A at 0–2 min; 5%–10% A at 2–5 min; 10%–16% A at 5–12 min. The column temperature was set at 30 °C, the detection wavelength was 254 nm, and the injection volume was 10 μL each time. Heated Electron Spray Ionization (HESI) source was used for mass spectrometry analysis in both positive and negative ion modes, and nitrogen is used as the carrier gas. The sheath gas pressure and the auxiliary gas pressure were set to 3.5 MPa and 1.0 MPa in positive and negative ion modes, respectively. The spray voltage in positive ion mode is 3.80 kV, while in negative ion mode is 3.00 kV. The capillary temperature was 350 °C and the auxiliary heating temperature was 200 °C. The scan range was set to m/z 100-1500. Full Mass resolution was 70000 and the dd-MS2 resolution was 17500. The collision energy is 20, 30 and 40 eV, respectively.
Animals and preparation of HN animal model
Thirty SPF male Wistar rats aged from 7 ∼ 8 weeks, weighing 200 ∼ 220 g were purchased from Chengdu Dashuo Experimental Animal Co., Ltd. (Chengdu, China). The rats were raised in SPF animal laboratory, College of Pharmacy, Southwest Minzu University, which was housed 5 per cage under 12 h light/dark cycle and provided with ad libitum access to deionized water and feed, and maintained at a temperate of 20–24 °C with 45–65% humidity, and rats were acclimatized for one week. All animal procedures were approved by the Ethics Committee of Southwest Minzu University (Approval No. 2019-12).
Thirty male rats were randomly split into five groups (n = 6), as follows: control group (CG), hyperuricemic nephropathy group (HNG), allopurinol group (AG), high-dose formula group (FHG) and low-dose formula group (FLG). Adenine and ethambutol hydrochloride were dissolved in deionized water to form a suspension of 1% adenine and 2.5% ethambutol hydrochloride for the induction of HN in rats (Kang et al. Citation2020). Gavage suspension (10 mL/kg) was given to all groups except the rats in the CG, once per day for 3 weeks consecutively. At the beginning of the second week of modelling, rats in the FHG and FLG were i.g 8.64 and 2.16 g/kg CF decoction, respectively. Rats in the AG were administered with 50 mg/kg 0.5% allopurinol solution by gavage. Rats in the CG and HNG were given an equal volume of normal saline. All drugs were administered once daily for 2 weeks (). During the experiment, the changes in body mass and mental status of the rats were observed and recorded. After 3 weeks of administration, all rats were fasted without water for 12 h and then collected faeces under sterile conditions. Rats were euthanized by intraperitoneal injection of sodium pentobarbital to minimize suffering. Blood and kidney samples were collected and serum, kidney and faeces were stored at −80 °C for further analysis.
Network pharmacology profiling
The main chemical components of CF were retrieved using the TCMSP (http://lsp.nwu.edu.cn/tcmsp.php), a database of systematic pharmacological analysis platforms for TCM (Ru et al. Citation2014). In consideration of the sophistication of the chemical composition of TCM formula, the oral bioavailability (OB) ≥ 30% and drug similarity (DL) ≥ 0.18 were employed as references for screening active ingredients, and the targets name of each active ingredient were collated. UniProt (http://www.uniprot.org/) is an internationally renowned protein database, which consists of UniRef, UniProtKB and UniParc (The UniProt Citation2017). In this study, the UniProtKB knowledge base was applied to convert the candidate compound target name to the corresponding human gene name. The HUA-related targets were searched in DisGeNET (https://www.disgenet.org), Genecard (http://www.genecards.org) and DrugBank (https://go.drugbank.com) databases, respectively, and then merged, de-duplicated and integrated. Using the ‘Draw Venn Diagram’ (bioinformatics.PSB.ugent.be/webtools/Venn) to draw a Venn diagram, to derive the potential target genes of the active ingredient in CF against HUA. Import the active ingredient of CF and target information into Cytoscape 3.8.0 to build a drug-potential active ingredient-target network. Constructed protein–protein interaction (PPI) network using STRING 11.0 (https://string-db.org/cgi/input.pl) and Cytoscape software for further network analysis, calculation and map of key genes in R. The Gene Ontology (GO) and Kyoto Encyclopaedia of Genes and Genomes (KEGG) pathway enrichment analysis were executed by loading the ‘clusterProfiler’ package in the R language for the potential targets of CF active ingredients. A threshold value of p < 0.05 was used to statistically screen out the biological processes and pathways with significant differences, and dot plots were performed.
Component–target molecular docking
The PDB ID of the core target proteins obtained above was searched in UniProt. The three-dimensional structure files of core target proteins were retrieved and downloaded in PBD format via the RSCB PBD database (https://www.rcsb.org/), and the MOL2 structure of the core components was downloaded from the TCMSP database. The downloaded target proteins were preprocessed using AutoDockTools-1.5.6 and PyMOL software for removing water molecules, separating proteins, adding non-polar hydrogens, calculating the Gasteiger charges for the structure, and saving them as PDBQT files (Morris et al. Citation2009). AutoDock is a prevalent receptor-ligand docking simulation programme. In this study, the target protein was the receptor and the active ingredient was the ligand. AutoDock was also used to evaluate the binding affinity of the protein to the ligand and to choose the lowest energy conformation in the docking simulation (Bitencourt-Ferreira et al. Citation2019). Ultimately, Autodock Vina was adopted for molecular docking, and it is commonly believed that the lower the binding energy of the receptor to the ligand, the higher the affinity and the greater the likelihood of binding occurring. The conformation with the lowest affinity was opted as the superior docking conformation and visualized in Pymol.
Serological measurements and histopathological observation
Extracting the blood, and serum is obtained by a centrifuge (Cence, Hunan, China) which is set at 3000 rpm and 4 °C for 15 min to obtain serum and do the biochemistry measurement. The levels of UA, creatinine (CREA) and urea (UREA) in serum samples were determined using an automated biochemical analyzer (Roche, China). Take the rat kidneys to fixed in 4% polyformaldehyde, and use the gradient ethanol to dehydrate and paraffin embedding. Cut the wax blocks into 4 μm thick slices, stain them with haematoxylin and eosin (HE), and observation of renal tissue with an upright optical microscope (Eclipse E100, Nikon Instruments Inc., Japan).
Quantitative Real-Time polymerase chain reaction
Total RNA from the kidney samples of rats was extracted with AxyPrep™ Multisource Total RNA Maxiprep Kit (Corning, Jiangsu, China) according to the manufacturer’s instructions, and then reverse transcribed using PrimeScript™ RT reagent Kit with gDNA Eraser (Takara Bio, Beijing, China). And Quantitative PCR experiments were carried out using iTaq™ Universal SYBR® Green Supermix (Bio-Rad, Shanghai, China). The expression levels were normalized to the reference gene GAPDH and analysed by the 2–ΔΔCT method. And the qRT-PCR primer sequences are listed in .
Table 2. Primer sequences used for quantitative real-time polymerase chain reaction expression analysis.
Gut microbiota analysis
DNA purification
Appropriate and equal amounts of faeces were collected from each group of rats, and use a faecal genomic DNA extraction kit to extract rat faecal cDNA. Use the Zymo Research BIOMICS DNA Microprep Kit (Cat# D4301) (ZYMO Research, California, USA) to depuration the sample gDNA, and detected the integrity of gDNA by 0.8% agarose electrophoresis, followed by nucleic acid concentration detection using Tecan F200.
PCR amplification
Based on the sequenced region, specific primers with index sequences were synthesized to amplify the V4 region of the sample, and the amplified primer sequences were as follows: Primer 5′-, −3′: 515 F (5′-gtgyCAGCMGCCGCGGTAa-3′) and 806 R (5′-ggactachvGGGTWTCTAat-3′). PCR test was conducted under the action of TOYOBO KOD-Plus-Neo DNA Polymerase (KOD-401B), which was performed on Applied Biosystems® PCR System 9700. The entire PCR system was listed in . PCR expansion conditions are as follows: pre-generation in 94 °C for 1 min in 1 cycle; transgender 94 °C for the 20 s, and then annealing 54 °C last 30 s and extension to 72 °C for 5 min in 1 cycle; and insulation thermal in 4 °C. Repeat the PCR technology 3 times per sample, and collect the equivalent mixture of linear PCR products used for subsequent library construction.
Table 3. The composition of the PCR system.
Detection, purification and quantification of PCR products
PCR product was mixed with 6 times upper sample buffer, and then 2% agarose gel was used for target fragment electrophoresis detection. The qualified samples were recovered from the target bands, which used Zymoclean Gel Recovery Kit (D4008), use [email protected] Fluorometer (Thermo Fisher Scientific, USA) to quantify, and finally make the equimolar mixing. Use the NEBNext Ultra II DNA Library Prep Kit for Illumina (NEB#E7645L) (NEW ENGLAND BioLabs, Ipswich, MA, USA) to build the library. Then use PE250 sequencing to sequence, sequencing kit used Hiseq Rapid SBS Kit v2(FC-402-4023 500 Cycle) (Illumina, San Diego, CA, USA) following the manufacturer’s guidelines. Alpha diversity analysis, beta diversity analysis, community composition analysis, and Lefse analysis were performed successively.
Statistical analysis
Statistical analysis of the data and Graphics was performed using GraphPad Prism 5.0 (GraphPad Software, La Jolla, CA, USA). Data are represented as mean ± standard deviation (SD) for each group of six rats. One-way analysis of variance (ANOVA) was applied for multiple comparisons between groups. p < 0.05 indicates that the difference is statistically significant.
Results
Identification of the main components of CF based on UPLC/Q-TOF-MS analysis
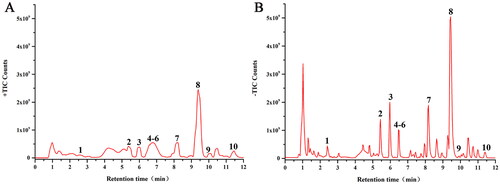
Ten major compounds were identified using UPLC/Q-TOF-MS analysis, which would be classified into four categories, including five phenylpropanoids (chlorogenic acid, cryptochlorogenic acid, isochlorogenic acid B, isochlorogenic acid A and isochlorogenic acid C), two iridoids (shanzhiside, genipin 1-gentiobioside), one glycoside (capparoside A) and two flavonoids (puerarin 6″-O-xyloside and daidzin). Detailed descriptions of these compounds are listed in . The total ion chromatograms of CF in positive and negative ion modes were shown in .
Figure 1. Effect of CF on serological changes and histopathological changes of renal tissue in HN rats. (A)Processing of the whole experiment. (B) Food intake of rats. (C) Body weight changes of rats. (D–F) Effects of CF on the level of UA, UREA and CREA. (G–P) HE staining result of kidney tissue in each group. Data are presented as mean ± SD (n = 6). G, I, K, M and O tissues were observed under an upright optical microscope (×10.0); H, J, L, N and P tissues were observed under an upright optical microscope (×40.0). *p < 0.05; **p < 0.01; ***p < 0.001, compared with the CG. #p < 0.05, compared with the HNG. The black arrows point to the renal tubules and their epithelial cell lesions.
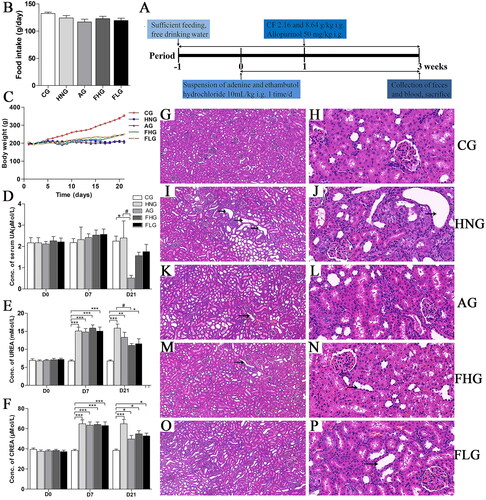
Table 4. Characterization of chemical constituents of Cichorium intybus formula (CF) by UPLC/Q-TOF-MS.
Effect of CF on serological changes in rats with HN
The body weight changes and food intake of the rats during the experiment were shown in . After 3 weeks of consecutive modelling, the results of the blood biochemical index showed that the concentration of serum UA, UREA and CREA in the HNG were higher than that in the CG, marking the successful construction of the HN model. The serum UA concentration in the CG was 2.25 μMol/L, whereas it increased to 2.40 μMol/L in the HNG group. After allopurinol treatment, there was a significant decrease in UA concentration in the AG to 0.52 μMol/L (p < 0.05). Also, the serum UA levels of rats in FHG and FLG showed a decrease compared with the HNG, which was consistent with the impact of allopurinol intervention (). As shown in , The UREA level increased from 6.75 mMol/L in CG to 15.87 mMol/L in HNG (p < 0.001). Under pathophysiological conditions, drastic UREA level increases provide key information on renal function and the diagnosis of various kidney disorders (Pundir et al. Citation2019). After intervention with CF, the concentration of UREA declined to 11.05 mMol/L in FHG (p < 0.05). Likewise, the serum CREA level in the CG was 38.5 μmol/L, whereas, in HN rats, it increased to 64.83 μmol/L, which suggests the presence of kidney dysfunction induced by HUA. CREA levels in the AG, FHG and FLG groups were notably lower than those in the HN group after administration of the corresponding drugs ().
Figure 2. The major chemical components of CF. (A) UPLC/Q-TOF MS total ion chromatogram of CF in positive ion mode. (B) UPLC/Q-TOF MS total ion chromatogram of CF in negative ion mode. 1, Shanzhiside (Zhang et al. Citation2018); 2, Chlorogenic acid (Wang et al. Citation2015); 3, Cryptochlorogenic acid (Wang et al. Citation2015); 4, Isochlorogenic acid B (Tian et al. Citation2020); 5, Isochlorogenic acid A (Tian et al. Citation2020); 6, Isochlorogenic acid C (Tian et al. Citation2020); 7, Genipin 1-gentiobioside (Li et al. Citation2016); 8, Capparoside A (Luecha et al. Citation2009); 9, Puerarin 6″-O-xyloside (Yu et al. Citation2012); 10, Daidzin (Gaya et al. Citation2016).
Effect of CF on histopathological changes of renal tissue in rats with HN
The results of HE staining revealed that the kidney structure in CG rats was normal and no urate crystallization was observed while rats in HNG had irregular distortion, glomerulosclerosis, interstitial fibrosis and renal arteriolosclerosis in the kidney. Even crystal deposition in the renal papillary collecting duct and inflammatory reactions in the renal interstitium of HNG rats were observed (). Histological alterations in glomerular and tubular structures were blocked to some extent among FHG, FLG and AG ().
Network pharmacology-based analysis
We have conducted network pharmacology to investigate the potential components and molecular targets of CF that have a therapeutic impact on HUA. A total of 65 potentially active compounds conforming to the screening criteria of OB ≥ 30% and DL ≥ 0.18 and 246 active ingredients-related targets corresponding to these compounds were identified by the TCMSP database for the chemical composition of CF which is composed of five herbal medicines. We also searched for HUA-related genes using the keyword ‘HUA’, and identified 15 targets in the OMIM database, 196 in the DisGeNet database, 35 in the Drugbank database and 759 in the GeneCards database, and ultimately obtained a total of 777 HUA-related targets after de-duplication. Drug-disease Venn diagrams were created, leading to the identification of 83 overlapping targets ().
Figure 3. Network pharmacology-based analysis. (A) The Venn diagram of CF-HUA. (B) The protein–protein interaction (PPI) network of CF in the treatment of HUA. (C) Top 30 key targets of CF for HUA. (D) The drug-potential active ingredient-target network. (E) Gene Ontology (GO) function analysis of common targets. (F) Kyoto Encyclopaedia of Genes and Genomes (KEGG) pathway enrichment analysis of common targets.
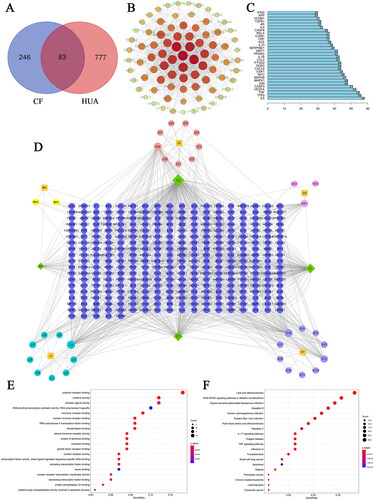
The PPI network of CF for the treatment of HUA was constructed with common targets, as shown in , we were amazed to find that IL6 (interleukin 6), TP53 (tumor protein P53), TNF (tumor necrosis factor), VEGFA (vascular endothelial growth factor A), CASP3 (caspase-3) and MAPK1 (mitogen-activated protein kinase 3) were located at the centre of the network. R language was used to calculate the core genes, and the top 30 genes were shown in . Most of all, to comprehensively investigate the mechanism of action of CF on HUA, presented the drug- potential active ingredient-target network of CF, which consists of 371 nodes (42 compounds and 329 candidate targets) and 818 edges, and indicated that each active ingredient act on multiple targets.
To further reveal the molecular mechanism of CF anti-HUA, GO analysis and KEGG pathway enrichment of the above 83 common targets were conducted with the ‘clusterProfiler’ in R language, and a total of 103 significantly enriched GO terms were identified (p < 0.05). The top five enriched GO entries included cytokine receptor binding, cytokine activity, steroid hormone receptor activity, nuclear receptor activity, transcription factor activity and direct ligand regulated sequence-specific DNA binding, and the top 20 terms were displayed in . In addition, 97 KEGG pathways conformed to the requirement of p < 0.05, and bubble maps of the top 20 KEEG signalling pathways were constructed based on p values, in which AGE-RAGE signalling pathway in diabetic complications, lipid and atherosclerosis, hepatitis B, Kaposi sarcoma-associated herpesvirus infection, IL-17 (interleukin-17) signalling pathway were determined to be the dominant pathways (). To ascertain whether the active ingredients of CF in HUA treatment would interact directly with the core target, we assessed their binding affinity with the help of molecular docking analysis to verify the accuracy of network pharmacological predictions. Six central core proteins including IL6, TP53, TNF, VEGFA, CASP3 and JUN were selected as receptors, and the active components of CF, which ranked among the top four in the degree value in the drug-potential active ingredient-target network, including quercetin, kaempferol, luteolin, 3-epioleanolic acid were chosen as ligands for molecular docking. The binding energy is below 0 kcal/mol indicating that these ligands and receptors have affinity and could bind spontaneously. As can be seen from , the molecular binding affinities of the selected active compounds to the core target proteins were all < −5.0 kcal/mol, suggesting that the ligands had an excellent affinity for the receptors and that they readily form a stable binding conformation (Hsin et al. Citation2013). demonstrated the docking pattern of the core target proteins to the active ingredient, as well as the binding sites of the top three target proteins including TP53, VEGFA and CASP3 were visualised according to their average binding energy to the active ingredient, respectively.
Figure 4. Molecular docking diagram and visualisation of the major active ingredients of CF and the core targets.
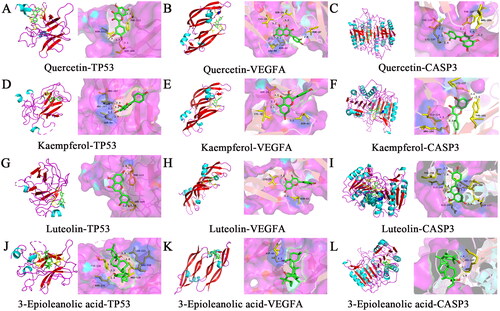
Table 5. The molecular docking result of major active components of Cichorium intybus formula (CF) with core target proteins.
qRT-PCR analysis
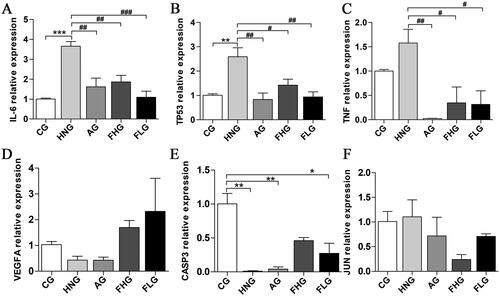
Based on the Prediction of network pharmacology, we chose IL6, TP53, TNF, VEGFA, CASP3 and JUN to investigate the mechanism of CF to ameliorate HN. As shown in , the expression levels of IL6, TP53 and TNF mRNA were significantly higher in the HNG compared with the CG (p < 0.05), while the expression levels of VEGFA, CASP3 and JUN mRNA were decreased. Compared with the HNG, the expression levels of IL6, TP53, TNF and JUN mRNA were significantly decreased in the AG, FHG and FLG (p < 0.05), while the expression levels of VEGFA and CASP3 mRNA were increased.
Figure 5. Effect of CF on the mRNA expression of IL-6, TP53, TNF, VEGFA, CASP3 and JUN. (A) The relative mRNA expression of IL-6. (B) The relative mRNA expression of TP53. (C) The relative mRNA expression of TNF. (D) The relative mRNA expression of VEGFA. (E) The relative mRNA expression of CASP3. (F) The relative mRNA expression of JUN. Data were presented as mean ± SD (n = 6). *p < 0.05; **p < 0.01; ***p < 0.001, compared with the CG. #p < 0.05; ##p < 0.05, compared with the HNG.
Effects of CF on intestinal microbiota in HN rats
Quality evaluation of sequencing data
First, all data should be quality assessed by statistical methods. Quality control is required to obtain high-quality sequences. The UCHIME algorithm was used to remove chimaeras and obtain effective tags. The results were evaluated by calculating raw PE, raw tags, clean tags, effective tags, effective rates (%), average length (nt) and Q30 (%) for each sample, and the results showed that all data fulfilled the quality evaluation requirements ().
Table 6. The quality assessment of sequencing date.
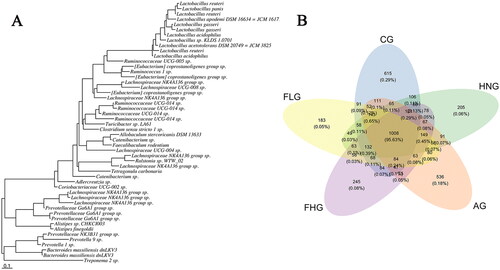
Operational taxonomic units (OTUs) are hypothetical taxa for sequence clustering that facilitate the study of sample species composition and diversity information. In general, OTU clustering analysis is usually performed at a 97% similarity level, with each OTU representing a set of similar sequences. The representative sequences of OTUs are annotated taxonomically by the UCLUST classification (Edgar Citation2010). The evolutionary tree composed of the top 50 OTUs in abundance was performed in , primarily for the calculation of subsequent α-diversity and β-diversity analyses. Venn diagrams () visualize the similarity of OTUs composition between groups. The overlapping part of the petal is the OTUs shared by adjacent groups, and each colour represents a group. A total of 4851 OTUs were generated from the five groups, and there were 615 unique OTUs in CG, 205 in HNG, 536 in AG, 245 in FHG and 183 in FLG, five groups with 1008 OTUs in common.
Figure 6. (A) Phylogenetic tree of high abundance OUT. (B) Venn diagram analysis of differences in OTU distribution in each group.
Alpha diversity analysis
Alpha diversity refers to diversity within a particular region or ecosystem. Commonly used alpha diversity indices include Chao1, PD, Simpson and Shannon, where Chao1 reflects the total number of species, PD value is calculated by summing all branch lengths of the evolutionary tree, and Simpson and Shannon can indicate the diversity and homogeneity of microorganisms. As shown in , the values of Chao1, PD, Simpson and Shannon indexes were reduced in the HNG compared to the CG, with the decrease in Simpson being statistically significant (p < 0.05), suggesting that the handling of adenine and ethambutol hydrochloride disturbed the balance of the intestinal microbiota. In contrast, after gavage CF treatment, the FHG produced higher community richness and diversity than the HNG, and likewise, the increase in Simpson values was statistically significant (p < 0.05). The effect of high-dose CF and allopurinol on the diversity of the flora was approximately identical, while the FLG group did not create such a pattern, implying that the high-dose of CF was more conducive to the development of intestinal flora than the low-dose. The detailed results of the alpha diversity index were shown in .
Figure 7. The Alpha diversity analysis. (A–D) The Chao1, PD, Simpson and Shannon index of each group. (E) The Rarefaction Curve of each sample. (F) OTU Rank abundance curves of each group. *p < 0.05; **p < 0.01; ***p < 0.001.
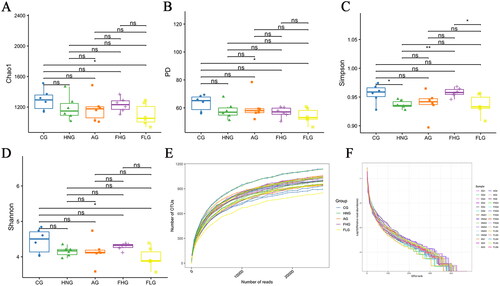
Table 7. A summary of the α-diversity index for all samples.
Furthermore, the results of the alpha diversity index could be further validated by the rarefaction curve () and the rank-abundance curve (). The rarefaction curves eventually tended to be relatively smooth, which illustrated that the quantity of sequencing data was adequate to represent most of the microbial information in the samples, i.e., the sequencing data were reasonable and the sampling depth was reliable (). In addition, rank-abundance curves could interpret both species abundance and species evenness (). In the horizontal direction, the abundance of species is captured by the width of the curve; the higher the abundance of species, the greater the extent of the curve on the horizontal axis. On the other hand, the shape of the curve (smoothness) reflects the evenness of the species in the sample; the flatter the curve, the more evenly distributed the species are. Thus, high-dose of CF had a more significant back regulatory effect on bacterial diversity.
β-Diversity analysis
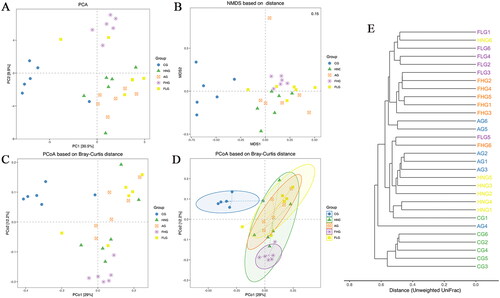
β-Diversity is a comparative analysis of the microbial community structure of different samples (Anderson et al. Citation2011). As seen from Principal Component Analysis (PCA), Non-metric Multi-Dimensional Scaling (NMDS) and Co-ordinates Analysis (PCoA) analysis (), the community composition of microorganisms in CG was different from that of the HNG, AG, FHG and FLG, indicating that low- and high-doses of CF intake altered the composition of the entire intestinal flora. PCoA based on Bray–Curtis distance with the confidence ellipses was performed in . And the confidence ellipses represented the 95% confidence intervals for each group. The PCoA based on the Bray–Curtis plot portrayed that CG and HNG can be completely separated, indicating that HN contributed to alterations in the structure of the intestinal flora. Lastly, clustering analysis based on Unweighted UniFrac distance was performed on the samples using hierarchical clustering methods to explore the similarity of community composition. As shown in , the samples of each group are quite close together indicating that the community structure within the group is extremely similar.
Figure 8. β-Diversity analysis. (A) The OUT-based Principal Component Analysis (PCA). (B) Non-metric Multi-Dimensional Scaling (NMDS) based on Jaccard distance. (C) Principal Co-ordinates Analysis (PCoA) based on Bray-Curtis distance. (D) PCoA based on Bray-Curtis distance with ellipses. (E) Clustering Dendrogram based on Unweighted UniFrac distance. Confidence ellipses represented the 95% confidence interval of each group.
Analysis of differences in the composition of intestinal flora
A total of 22 bacterial species were found in the intestinal flora at the phylum level, and sequence analysis of CG, HNG, AG, FHG and FLG identified 20, 15, 17, 14 and 18 phyla, respectively. From the phylum-level analysis (), there were certain differences in the composition of intestinal flora between the groups. It can be concluded that 90% of the intestinal flora mainly consisted of Firmicutes, Bacteroidetes and Proteobacteria. The relative abundance of Firmicutes in CG, HNG, AG, FHG and FLG were 48.3%, 44.5%, 49.9%, 45.8% and 52.9%, respectively. The relative abundance of Bacteroidetes in CG, HNG, AG, FHG and FLG were 35.4%, 39.2%, 35.9%, 39.0% and 30.7%, respectively. As shown in , the relative abundance of Firmicutes in the HNG was lower than that in CG, but it increased after CF administration. Meanwhile, as can be discerned from , the relative abundance of Bacteroidetes in the HNG was higher than that in CG, AG, FHG and FLG. These differences are not statistically significant. The ratio of Firmicutes to Bacteroidetes was lowest in the HNG group, and it increased after the administration of CF.
Figure 9. Analysis of differences in the composition of intestinal flora. (A) Barplot of top 10 relative abundance at the phylum level. (B-C) The relative abundance of Firmicutes and Bacteroides in each group, the data were subjected by one-way ANOVA. Data are presented as mean ± SD (n = 6). (D) Barplot of top 10 relative abundance at the genus level. (E-F) The relative abundance of Ruminococcaceae UCG-014 and Bifidobacterium in each group, the data were subjected by one-way ANOVA. Data are presented as mean ± SD (n = 6). (G-I) Barplot of top 10 relative abundance at class, order and family level. *p < 0.05; **p < 0.01; ***p < 0.001. Others represent the sum of the relative abundance of all species other than 10 and species without annotation information.
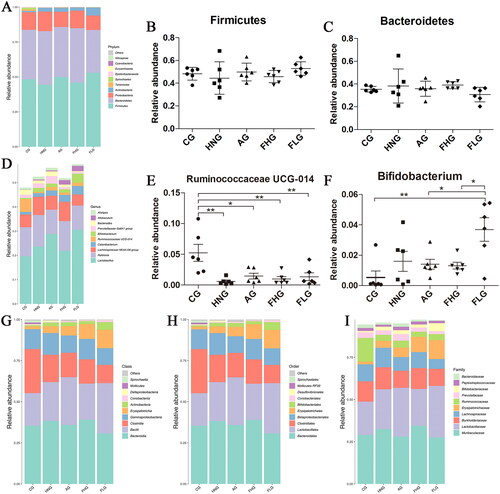
At the genus level, a total of 293 genera were obtained from five groups and 214, 200, 213, 176 and 195 genera were obtained from CG, HNG, AG, FHG and FLG, respectively. It can be seen that the intestinal flora in the five groups was mainly composed of Lactobacillus, Ralstonia and Lachnospiraceae NK4A136 group (). The relative abundances of Lactobacillus in CG, HNG, AG, FHG and FLG were 19.6%, 23.6%, 28.8%, 21.9% and 30.5%, respectively. And the relative abundances of Ralstonia in CG, HNG, AG, FHG and FLG were 12.0%, 13.0%, 10.0%, 12.2% and 10.0%, respectively. As shown in , the relative abundance of Ruminococcaceae UCG-014 in the CG was significantly higher than that in the HNG (p < 0.01), AG (p < 0.05), FHG (p < 0.01) and FLG (p < 0.01), and the relative abundance of Ruminococcaceae UCG-014 was increased after treating with CF and allopurinol. As shown in , the relative abundance of Bifidobacterium in the CG (p < 0.01), AG (p < 0.05) and FHG (p < 0.05) were significantly lower than that in the FLG. The cumulative histogram of the top 10 species generated at the taxonomic level of relative abundance for class, order and family were shown in .
LEfse analysis
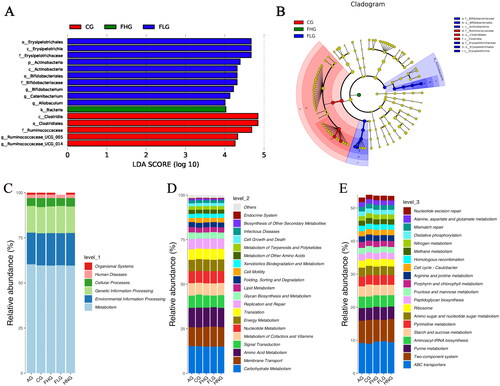
In our study, LEfse analysis (Segata et al. Citation2011) was adopted to seek biomarkers with statistically significant differences (LDA score > 4). As shown in , the main microbial species that differed between CG and other groups were Ruminococcaceae, Ruminococcaceae_UCG_005, Ruminococcaceae_UCG_014, Clostridiales and Clostridia. The main microbial species that differed between FHG and other groups were Bacteria. The main microbial species that differed between FLG and other taxa were Allobaculum, Erysipelotrichaceae, Bifidobacteriales, Bifidobacteriaceae, Erysipelotrichales, Erysipelotrichia, Catenibacterium, Bifidobacterium, Actinobacteria, Actinobacteria. An evolutionary diagram was shown in to demonstrate the distribution patterns of phylogenetic relationships for species that play an important role in each group. The functional prediction results of enrichment at three different levels of the ko metabolic pathway were shown in .
Figure 10. The result of LEfse analysis and functional enrichment of the ko metabolic pathway at 3 different levels. (A) LDA score of Lefse. (B) Cladogram of Lefse. (C) ko analysis of level 1. (D) ko analysis of level 2. (E) ko analysis of level 3.
Discussion
Clinical research indicated that HUA belongs to the damp-heat constitution in the TCM constitution type (Liang et al. Citation2020). CF is a typical prescription used by the Uighurs to control the symptoms of gout and lower uric acid levels. Chicory is an essential supplement of bioactive components for humans, including carbohydrates (inulin), volatile compounds, phenolic compounds (phenolic acids), amino acids and proteins, fatty acids and derivatives, sesquiterpene lactones, vitamins and minerals. The important nutritional properties of chicory indicated its different biological activities: anti-hepatotoxic activity, anti-diabetic effect, antimicrobial effect, antioxidant activity and other bioactivities (Perovic et al. Citation2021). One of the chicory extracts, inulin, is Generally Regarded as Safe (GRAS) by the FDA and makes an appearance on the list of Everything Added to Food in the United States (EAFUS) (Coussement Citation1999). Gardeniae fructus was initially documented in Sheng Nong’s herbal classic, which was used extensively as a traditional herb for its effectiveness in clearing away heat evil and promoting diuresis, cooling the blood detoxification, reducing fire except vexed (Liu et al. Citation2014). A review has summarized the pharmacology of Gardeniae fructus including hepatoprotective and choleretic effects, anti-inflammation, treatment of nervous system-related diseases, diabetes, treatment of cardiovascular diseases, antitumor and anti-apoptotic effects, etc. (Tian et al. Citation2022). Geniposide is the main active component of Gardeniae fructus (Lee et al. Citation2014), previous studies have established that could effectively modulate the development of diabetic nephropathy (Hu et al. Citation2017; Li et al. Citation2020). Mulberry leaves have been the primary diet of silkworms and are also utilized as animal livestock feed. Mulberry leaves are principally composed of flavonoids, which have various biological activities such as antioxidant, antibacterial, antidiabetic and antihyperlipidemic (Chan et al. Citation2016). Pueraria lobata (Willd.) Ohwi (Fabaceae) has been conventionally used to treat cardiovascular disease, acute dysentery, deafness and diarrhoea (Zhang et al. Citation2013). Puerariae lobatae Radix is a popular Chinese herb used to treat a variety of diseases (Wu et al. Citation2012). Lilii Bulbus is worldwide prevalent folk medicine, mainly used for the treatment of anti-respiratory diseases. It has been demonstrated that the bioactive polysaccharides of Lilii Bulbus participated in anti-tumour effects by inhibiting the growth of Lewis lung carcinoma, increasing the phagocytosis of macrophages, the proliferation of splenocytes, and the production of cytokines (Sun et al. Citation2014). From UPLC/Q-TOF-MS analysis, the major components of CF included shanzhiside, chlorogenic acid, cryptochlorogenic acid, isochlorogenic acid B, isochlorogenic acid A, isochlorogenic acid C, genipin 1-gentiobioside, capparoside A, puerarin 6″-O-xyloside, daidzin. Zhou et al. (Citation2021) proposed that chlorogenic acid supplementation could ameliorate HUA, alleviate kidney inflammation, and regulate homeostasis in the intestine. This result will contribute to the quality control of CF and facilitate further pharmacodynamic studies.
The above experiments were inclined to demonstrate the effectiveness of each of the herbs in CF on gout and HUA. However, there is little known about the effectiveness of the CF in HN, and the underlying mechanisms. Therefore, we established a rat model of HN with a suspension composed of adenine and ethambutol hydrochloride to evaluate the effect of CF on HN and to ascertain the mechanism of action. The pathological basis of HN is the overproduction or overexcretion of UA resulting in the deposition of uric acid crystals in the kidney with an inflammatory response that impairs renal function. Purines are natural substances that are contained in almost all foods, it has been reported that high consumption of purine-rich diets increases serum UA levels, which could result in gout and become a risk factor for cardiovascular disease, kidney disease and metabolic syndrome (Kaneko et al. Citation2014). Adenine is one of the purines that is normally used to supplement exogenous UA and generally be viewed as a precursor of UA, which can lead to the ascend of serum UA level and eventually induce HN. While, ethambutol hydrochloride could inhibit the excretion of uric acid and increase the accumulation of uric acid in the body, thus elevating the concentration of UA, contributing to HUA-induced renal impairment (Postlethwaite and Kelley Citation1972). The combination of adenine with ethambutol hydrochloride to construct a model of HUA-induced renal damage has been reported in several articles (Feng et al. Citation2017; Kang et al. Citation2020). In this study, we induced HN in rats by gavage of suspension for 3 consecutive weeks to enhance the severe histopathological damage inflicted on the kidney, and corresponding drugs were given for two consecutive weeks starting from the second week, AG i.g. allopurinol, HFG i.g. high-dose of CF, HLG i.g. low-dose of CF, simultaneously CG and HNG were given equal volumes of saline. Allopurinol is a XO inhibitor that prevents the conversion of hypoxanthine and xanthine to uric acid, causing a decrease in uric acid synthesis and thus reducing urate deposition in the bones, joints and kidneys, which is universally adopted for the treatment of gout (Chen et al. Citation2016). The results of serology revealed that the serum concentrations of UA, CREA and UREA were the highest in the HNG, indicating that the model of HN was successfully established. The levels of UREA and CREA in the serum are consistently regarded as common indicators of kidney function (Xu et al. Citation2017). Nevertheless, the levels of UA, CREA and UREA in the FHG and FLG were decreased to different degrees compared to the HNG, which was consistent with those in the AG. However, irregular distortion, glomerulosclerosis and interstitial fibrosis were observed in the HN from histopathology, whereas in FHG, FLG and AG, histological alterations in glomerular and tubular structures were somewhat blocked. Hence, these results suggested that CF has anti-HUA activity and could protect against HUA-induced renal injury.
To further investigate the mechanism of action of CF on the prevention and treatment of HUA at the molecular level, network pharmacology was used to construct the drug-potential active ingredient-target network, and molecular docking techniques were adopted to verify the binding ability of active ingredients and core targets protein. In this study, 65 active ingredients and 246 predicted targets of CF were obtained through database screening. 777 targets related to HUA were detected, and 83 common targets were derived by taking the intersection, among which six key targets were screened, including IL-6, TP53, TNF, VEGFA, CASP3 and JUN as key targets of CF for the treatment of HUA. And the qRT-PCR assay indicated that CF significantly decreased the mRNA expression of inflammatory cytokines (i.e., TNF and IL-6) and increased the mRNA expression of CASP3 and VEGFA the in renal tissues. Numerous studies have suggested that the development and progression of HN is closely correlated with elevated levels of inflammatory factor expression (Chen et al. Citation2020; Ren et al. Citation2021). Other studies reported that these cytokines are related to disturbances of intestinal flora, intestinal immunity and intestinal inflammation (Xuan-Qing et al. Citation2021). For instance, it was shown that Saccharomyces boulardii attenuated the carcinogenicity of ulcerative colitis in mice by reducing TNF-α and IL-6 levels and function, and by rebalancing intestinal flora (Wang C et al. Citation2019). IL-6 is generally recognized as a marker of systemic activation of pro-inflammatory cytokines (Barton Citation1997). In common with many other cytokines, IL-6 has both pro-inflammatory and anti-inflammatory properties (Opal and DePalo Citation2000). It has been established that UA has a direct pro-inflammatory effect and that there is a certain relationship between serum UA and IL-6 production, with high serum UA causing elevated IL-6 levels (Crișan et al. Citation2016; Tanaka et al. Citation2017). Furthermore, it has been proved that allopurinol treatment in mice with potassium oxonate-induced HUA decreased serum UA levels and significantly lowered serum IL-6 levels (Liang et al. Citation2019). TP53 is an essential anti-oncogene, and mutations of the gene are associated with a variety of human cancers, including hereditary cancers, such as Li-Fraumeni syndrome (Olivier et al. Citation2010). TNF-α is also an inflammatory biomarker. TNF-α levels in synovial fluid are elevated in gout patients. Thus, UA crystal deposition induces TNF-α release and IL-1β production. UA could induce TNF-α expression in vascular smooth muscle cells via the ROS-MAPK-NF-κB signalling pathway, which provided new evidence for the pro-inflammatory and pro-atherosclerotic effects of UA (Tang et al. Citation2017). Studies have reported satisfactory efficacy of TNF-α antagonist (etanercept) in the treatment of refractory gout (Zhang et al. Citation2020). Yu et al. (Citation2015) proposed that in the presence of UA, downregulation of miR-92a increased KLF2 expression and consequently inhibited VEGFA, leading to a decrease in angiogenesis. Thus miR-92a-KLF2-VEGFA axis might be a potential target for the treatment of HUA. CASP3 plays a crucial role in the execution phase of apoptosis. UA induces apoptosis in Min6 cells and enhances the expression of CASP3, decreasing the level of insulin secretion (Zhang and Qiu Citation2020). From the drug-potential active ingredient-target network, it can be concluded that quercetin, kaempferol, luteolin and 3-epioleanolic acid are the major active ingredients of CF. Quercetin inhibits xanthine oxidoreductase in vitro. Clinical trials have revealed that supplementation with quercetin significantly lowered plasma UA concentrations in healthy men (Shi and Williamson Citation2016). Some papers even pointed out that quercetin plays an influential role in the preservation of renal organs (Yao et al. Citation2011; Hu et al. Citation2012). Kaempferol inhibited XO activity, where the mechanism may be that kaempferol inserts into the active site of XO that occupies the catalytic centre of the enzyme to avoid substrate entry and induce conformational changes in XO (Wang et al. Citation2015). Similarly, molecular docking results showed that luteolin interacts with major amino acid residues located within the active site pocket of XO (Yan et al. Citation2013). The results of the enrichment analysis indicated that a multitude of signalling pathways is involved, including the IL-17 signalling pathway, TNF signalling pathway, and so on. IL-17 is a characteristic cytokine secreted by TH17 cells, which is involved in inflammatory and immune responses in vivo. Studies have illustrated that IL-17 binding to its receptor can activate downstream pathways such as NF-κB and MAPK, thereby inducing the expression of pro-inflammatory cytokines such as IL-6 and TNF-α, and ultimately inducing an inflammatory response (Xu and Cao Citation2010). Research indicates that the differentiation of cytokines linked to the IL-17 signalling pathway is associated with the colonisation of intestinal flora and may be engaged in intestinal immune homeostasis (Wang Y et al. Citation2019).
Intestinal flora is intimately related to human health, and an increase in soluble UA may alter the optimal physiological environment for intestinal flora, consequently affecting intestinal flora composition and function. Bian et al. (Citation2020) substantiated that chicory could improve HUA by regulating the intestinal flora and inhibiting the inflammatory response of the LPS/TLR4 axis in quail. According to the analysis of α-diversity, β-diversity and species composition analysis, it can be found that CF could significantly regulate the richness and diversity of intestinal microflora in adenine and ethambutol-induced HN rats and achieve the reconstruction of intestinal microecology. Emerging literature revealed that the ratio of Firmicutes to Bacteroidetes is strongly associated with various metabolic diseases. Intriguingly, the reverse trend has also been confirmed in obese animal experiments. One possible interpretation is that metabolic and ecological dysregulation may interact, leading to different effects of microbiota on different diseases (Magne et al. Citation2020). The ratio evolved at different life stages. For infants, adults and the elderly, the measured ratios were 0.4, 10.9 and 0.6, respectively (Mariat et al. Citation2009). The results indicated that the abundance of Rumenococcus UCG-014 and Bifidobacterium increased after CF treatment. Ruminococcaceae UCG-014 are known to participate in the production of short chain fatty acids (SCFAs), and their relative abundance is associated with improved host health (Lee et al. Citation2018). Bifidobacterium is a beneficial bacterium that acidifies the intestinal environment, inhibits spoilage and the growth of pathogenic bacteria, protects the intestinal barrier, and reduces the entry of botulinum toxin into the blood (Salminen et al. Citation1998). Likewise, Lactobacillaceae, Bifidobacteriaceae, and Rikenellaceae can modulate pro-inflammatory pathways by reducing cytokines such as IL-6 and TNF-α, inducing immune tolerance, and inhibiting T-cell effectors (Abdel-Gadir et al. Citation2019).
To the best of our knowledge, our current study is the first to suggest a nephroprotective role of CF in a rat model of HN. We determined the main chemical substances in CF, but the chemical components may have changed during the decoction process. In our study, because the relevant targets for HN cannot be retrieved at present, that network pharmacology studied the anti-HUA therapeutic effect of CF, while intestinal flora studied the nephroprotective effect of CF on nephropathy induced by HUA. This limitations and defects need to be explored in future studies.
Conclusions
Administration of 2.16 and 8.64 g/kg of CF for 2 weeks to rats with adenine and ethambutol-induced HN significantly ameliorated physiological and serological imbalances as well as renal injury. Network pharmacology indicated that the key targets of CF treatment for HUA included IL-6, TP53, TNF, VEGFA and CASP3. Intestinal flora analysis revealed that CF improves HN through alteration of bacterial diversity, community structure and species composition. Our study could provide a solid theoretical basis for CF in the prevention and treatment of HUA and HN.
Disclosure statement
The authors declare that they have no known competing financial interests or personal relationships that could have appeared to influence the work reported in this paper.
Additional information
Funding
References
- Abdel-Gadir A, Stephen-Victor E, Gerber GK, Noval Rivas M, Wang S, Harb H, Wang L, Li N, Crestani E, Spielman S, et al. 2019. Microbiota therapy acts via a regulatory T cell MyD88/RORgammat pathway to suppress food allergy. Nat Med. 25(7):1164–1174.
- Anderson MJ, Crist TO, Chase JM, Vellend M, Inouye BD, Freestone AL, Sanders NJ, Cornell HV, Comita LS, Davies KF, et al. 2011. Navigating the multiple meanings of beta diversity: a roadmap for the practicing ecologist. Ecol Lett. 14(1):19–28.
- Barton BE. 1997. IL-6: insights into novel biological activities. Clin Immunol Immunopathol. 85(1):16–20.
- Bian M, Lin Z, Wang Y, Zhang B, Li G, Wang H. 2018. Bioinformatic and metabolomic analysis reveal intervention effects of chicory in a quail model of hyperuricemia. Evid Based Complement Alternat Med. 2018:5730385.
- Bian M, Wang J, Wang Y, Nie A, Zhu C, Sun Z, Zhou Z, Zhang B. 2020. Chicory ameliorates hyperuricemia via modulating gut microbiota and alleviating LPS/TLR4 axis in quail. Biomed Pharmacother. 131:110719.
- Bitencourt-Ferreira G, Pintro VO, de Azevedo WF. Jr. 2019. Docking with AutoDock4. Methods Mol Biol. 2053:125–148.,
- Bravo JA, Forsythe P, Chew MV, Escaravage E, Savignac HM, Dinan TG, Bienenstock J, Cryan JF. 2011. Ingestion of Lactobacillus strain regulates emotional behavior and central GABA receptor expression in a mouse via the vagus nerve. Proc Natl Acad Sci USA. 108(38):16050–16055.
- Chan EW, Lye PY, Wong SK. 2016. Phytochemistry, pharmacology, and clinical trials of Morus alba. Chin J Nat Med. 14(1):17–30.
- Chen C, Lu JM, Yao Q. 2016. Hyperuricemia-related diseases and xanthine oxidoreductase (XOR) inhibitors: an overview. Med Sci Monit. 22:2501–2512.
- Chen X, Ge H-Z, Lei S-S, Jiang Z-T, Su J, He X, Zheng X, Wang H-Y, Yu Q-X, Li B, et al. 2020. Dendrobium officinalis six nostrum ameliorates urate under-excretion and protects renal dysfunction in lipid emulsion-induced hyperuricemic rats. Biomed Pharmacother. 132:110765.
- Chou YC, Kuan JC, Yang T, Chou WY, Hsieh PC, Bai CH, You SL, Chen CH, Wei CY, Sun CA. 2015. Elevated uric acid level as a significant predictor of chronic kidney disease: a cohort study with repeated measurements. J Nephrol. 28(4):457–462.
- Coussement PA. 1999. Inulin and oligofructose: safe intakes and legal status. J Nutr. 129(7 Suppl):1412S–1417S.
- Crișan TO, Cleophas MCP, Oosting M, Lemmers H, Toenhake-Dijkstra H, Netea MG, Jansen TL, Joosten LAB. 2016. Soluble uric acid primes TLR-induced proinflammatory cytokine production by human primary cells via inhibition of IL-1Ra. Ann Rheum Dis. 75(4):755–762.
- de Oliveira EP, Burini RC. 2012. High plasma uric acid concentration: causes and consequences. Diabetol Metab Syndr. 4:12–18.
- Edgar RC. 2010. Search and clustering orders of magnitude faster than BLAST. Bioinformatics. 26(19):2460–2461.
- Evenepoel P, Poesen R, Meijers B. 2017. The gut-kidney axis. Pediatr Nephrol. 32(11):2005–2014.
- Fathallah-Shaykh SA, Cramer MT. 2014. Uric acid and the kidney. Pediatr Nephrol. 29(6):999–1008.
- Feng Y, Sun F, Gao Y, Yang J, Wu G, Lin S, Hu J. 2017. Taurine decreased uric acid levels in hyperuricemic rats and alleviated kidney injury. Biochem Biophys Res Commun. 489(3):312–318.
- Gaya P, Arqués JL, Medina M, Álvarez I, Landet JM. 2016. A new HPLC-PAD/HPLC-ESI-MS method for the analysis of phytoestrogens produced by bacterial metabolism. Food Ana. Methods. 9(2):537–547.
- Guo Z, Zhang J, Wang Z, Ang KY, Huang S, Hou Q, Su X, Qiao J, Zheng Y, Wang L, et al. 2016. Intestinal microbiota distinguish gout patients from healthy humans. Sci Rep. 6:20602.
- Hsin KY, Ghosh S, Kitano H. 2013. Combining machine learning systems and multiple docking simulation packages to improve docking prediction reliability for network pharmacology. PLoS One. 8(12):e83922.
- Hu QH, Zhang X, Wang X, Jiao RQ, Kong LD. 2012. Quercetin regulates organic ion transporter and uromodulin expression and improves renal function in hyperuricemic mice. Eur J Nutr. 51(5):593–606.
- Hu QH, Zhu JX, Ji J, Wei LL, Miao MX, Ji H. 2013. Fructus Gardenia extract ameliorates oxonate-induced hyperuricemia with renal dysfunction in mice by regulating organic ion transporters and mOIT3. Molecules. 18(8):8976–8993.
- Hu X, Zhang X, Jin G, Shi Z, Sun W, Chen F. 2017. Geniposide reduces development of streptozotocin-induced diabetic nephropathy via regulating nuclear factor-kappa B signaling pathways. Fundam Clin Pharmacol. 31(1):54–63.
- Jandhyala SM, Talukdar R, Subramanyam C, Vuyyuru H, Sasikala M, Nageshwar Reddy D. 2015. Role of the normal gut microbiota. World J Gastroenterol. 21(29):8787–8803.
- Jin YN, Lin ZJ, Zhang B, Bai YF. 2018. Effects of chicory on serum uric acid, renal function, and GLUT9 expression in hyperuricaemic rats with renal injury and in vitro verification with cells. Evid Based Complement Alternat Med. 2018:1764212.
- Johnson RJ, Nakagawa T, Jalal D, Sanchez-Lozada LG, Kang DH, Ritz E. 2013. Uric acid and chronic kidney disease: which is chasing which? Nephrol Dial Transplant. 28(9):2221–2228.
- Kaneko K, Aoyagi Y, Fukuuchi T, Inazawa K, Yamaoka N. 2014. Total purine and purine base content of common foodstuffs for facilitating nutritional therapy for gout and hyperuricemia. Biol Pharm Bull. 37(5):709–721.
- Kang L, Miao JX, Cao LH, Miao YY, Miao MS, Liu HJ, Xiang LL, Song YG. 2020. Total glucosides of herbaceous peony (Paeonia lactiflora Pall.) flower attenuate adenine- and ethambutol-induced hyperuricaemia in rats. J Ethnopharmacol. 261:113054.
- Lee EJ, Hong JK, Whang WK. 2014. Simultaneous determination of bioactive marker compounds from Gardeniae fructus by high performance liquid chromatography. Arch Pharm Res. 37(8):992–1000.
- Lee H, Lee Y, Kim J, An J, Lee S, Kong H, Song Y, Lee CK, Kim K. 2018. Modulation of the gut microbiota by metformin improves metabolic profiles in aged obese mice. Gut Microbes. 9(2):155–165.
- Li H, Yang H, Xue X, Liu XF, Poh YH, Cai H, Lee YH, Yu H, Yu H, et al. 2016. A metabolomics approach to study the dual modulation by characterization of chemical alteration during processing of Gardeniae Fructus using UPLC-ESI-QTOF. Anal Methods. 2016:3629–3635.
- Li S, Zhang B. 2013. Traditional Chinese medicine network pharmacology: theory, methodology and application. Chin. J Nat Med. 11(2):110–120.
- Li F, Chen Y, Li Y, Huang M, Zhao W. 2020. Geniposide alleviates diabetic nephropathy of mice through AMPK/SIRT1/NF-kappaB pathway. Eur J Pharmacol. 886:173449.
- Li X, Meng X, Timofeeva M, Tzoulaki I, Tsilidis KK, Ioannidis JP, Campbell H, Theodoratou E. 2017. Serum uric acid levels and multiple health outcomes: umbrella review of evidence from observational studies, randomised controlled trials, and Mendelian randomisation studies. BMJ. 357:j2376.
- Liang G, Nie Y, Chang Y, Zeng S, Liang C, Zheng X, Xiao D, Zhan S, Zheng Q. 2019. Protective effects of Rhizoma Smilacis glabrae extracts on potassium oxonate- and monosodium urate-induced hyperuricemia and gout in mice. Phytomedicine. 59:152772.
- Liang X, Wang Q, Jiang Z, Li Z, Zhang M, Yang P, Wang X, Wang Y, Qin Y, Li T, et al. 2020. Clinical research linking Traditional Chinese Medicine constitution types with diseases: a literature review of 1639 observational studies. J Tradit Chin Med. 40(4):690–702.
- Liu LM, Cheng SF, Shieh PC, Lee JC, Chen JJ, Ho CT, Kuo SC, Kuo DH, Huang LJ, Way TD. 2014. The methanol extract of Euonymus laxiflorus, Rubia lanceolata and Gardenia jasminoides inhibits xanthine oxidase and reduce serum uric acid level in rats. Food Chem Toxicol. 70:179–184.
- Liu X, Zhai T, Ma R, Luo C, Wang H, Liu L. 2018. Effects of uric acid-lowering therapy on the progression of chronic kidney disease: a systematic review and meta-analysis. Ren Fail. 40(1):289–297.
- Luecha P, Umehara K, Miyase T, Noguchi H. 2009. Antiestrogenic constituents of the Thai medicinal plants Capparis flavicans and Vitex glabrata. J Nat Prod. 72(11):1954–1959.
- Luo TT, Lu Y, Yan SK, Xiao X, Rong XL, Guo J. 2020. Network pharmacology in research of Chinese medicine formula: methodology, application and prospective. Chin J Integr Med. 26(1):72–80.
- Magne F, Gotteland M, Gauthier L, Zazueta A, Pesoa S, Navarrete P, Balamurugan R. 2020. The Firmicutes/Bacteroidetes ratio: a relevant marker of gut dysbiosis in obese patients? Nutrients. 12(5):1474–1490.
- Mariat D, Firmesse O, Levenez F, Guimarăes V, Sokol H, Doré J, Corthier G, Furet J-P. 2009. The Firmicutes/Bacteroidetes ratio of the human microbiota changes with age. BMC Microbiol. 9:123–128.
- Morris GM, Huey R, Lindstrom W, Sanner MF, Belew RK, Goodsell DS, Olson AJ. 2009. AutoDock4 and AutoDockTools4: automated docking with selective receptor flexibility. J Comput Chem. 30(16):2785–2791.
- Olivier M, Hollstein M, Hainaut P. 2010. TP53 mutations in human cancers: origins, consequences, and clinical use. Cold Spring Harb Perspect Biol. 2(1):a001008.
- Opal SM, DePalo VA. 2000. Anti-inflammatory cytokines. Chest. 117(4):1162–1172.
- Perovic J, Tumbas Saponjac V, Kojic J, Krulj J, Moreno DA, Garcia-Viguera C, Bodroza-Solarov M, Ilic N. 2021. Chicory (Cichorium intybus L.) as a food ingredient - Nutritional composition, bioactivity, safety, and health claims: a review. Food Chem. 336:127676.
- Postlethwaite AE, Kelley WN. 1972. Studies on the mechanism of ethambutol-induced hyperuricemia. Arthritis Rheum. 15(4):403–409.
- Pundir CS, Jakhar S, Narwal V. 2019. Determination of urea with special emphasis on biosensors: A review. Biosens Bioelectron. 123:36–50.
- Ren Q, Tao S, Guo F, Wang B, Yang L, Ma L, Fu P. 2021. Natural flavonol fisetin attenuated hyperuricemic nephropathy via inhibiting IL-6/JAK2/STAT3 and TGF-beta/SMAD3 signaling. Phytomedicine. 87:153552.
- Rolnik A, Olas B. 2021. The plants of the Asteraceae family as agents in the protection of human health. IJMS. 22(6):3009–3018.
- Roman YM. 2019. The Daniel K. Inouye College of Pharmacy scripts: perspectives on the epidemiology of gout and hyperuricemia. Hawaii J Med Public Health. 78:71–76.
- Ru J, Li P, Wang J, Zhou W, Li B, Huang C, Li P, Guo Z, Tao W, Yang Y, et al. 2014. TCMSP: a database of systems pharmacology for drug discovery from herbal medicines. J Cheminform. 6:13–18.
- Salminen S, Bouley C, Boutron-Ruault MC, Cummings JH, Franck A, Gibson GR, Isolauri E, Moreau MC, Roberfroid M, Rowland I. 1998. Functional food science and gastrointestinal physiology and function. Br J Nutr. 80 Suppl 1: s 147–171.
- Segata N, Izard J, Waldron L, Gevers D, Miropolsky L, Garrett WS, Huttenhower C. 2011. Metagenomic biomarker discovery and explanation. Genome Biol. 12(6):R60.
- Sharaf El Din UAA, Salem MM, Abdulazim DO. 2017. Uric acid in the pathogenesis of metabolic, renal, and cardiovascular diseases: a review. J Adv Res. 8(5):537–548.
- Shi Y, Williamson G. 2016. Quercetin lowers plasma uric acid in pre-hyperuricaemic males: a randomised, double-blinded, placebo-controlled, cross-over trial. Br J Nutr. 115(5):800–806.
- Sun X, Gao RL, Xiong YK, Huang QC, Xu M. 2014. Antitumor and immunomodulatory effects of a water-soluble polysaccharide from Lilii Bulbus in mice. Carbohydr Polym. 102:543–549.
- Tanaka T, Milaneschi Y, Zhang Y, Becker KG, Zukley L, Ferrucci L. 2017. A double blind placebo controlled randomized trial of the effect of acute uric acid changes on inflammatory markers in humans: a pilot study. PLoS One. 12(8):e0181100.
- Tang L, Xu Y, Wei Y, He X. 2017. Uric acid induces the expression of TNF alpha via the ROSMAPKNFkappaB signaling pathway in rat vascular smooth muscle cells. Mol Med Rep. 16(5):6928–6933.
- The UniProt C. 2017. UniProt: the universal protein knowledgebase. Nucleic Acids Res. 45(D1):D158–D169.
- Tian D, Yang Y, Yu M, Han Z, Wei M, Zhang H, Jia H, Zou Z. 2020. Anti-inflammatory chemical constituents of Flos Chrysanthemi Indici determined by UPLC-MS/MS integrated with network pharmacology. Food Funct. 11(7):6340–6351.
- Tian J, Qin S, Han J, Meng J, Liang A. 2022. A review of the ethnopharmacology, phytochemistry, pharmacology and toxicology of Fructus Gardeniae (Zhi-zi). J Ethnopharmacol. 289:114984.
- Wan L, Chen G, Jian S, Yin XJ, Zhu H. 2018. Antioxidant and xanthine oxidase inhibitory properties and LC-MS/MS identification of compounds of ethanolic extract from mulberry leaves. Acta Sci Pol Technol Aliment. 17(4):313–319.
- Wang C, Li W, Wang H, Ma Y, Zhao X, Zhang X, Yang H, Qian J, Li J. 2019. Saccharomyces boulardii alleviates ulcerative colitis carcinogenesis in mice by reducing TNF-alpha and IL-6 levels and functions and by rebalancing intestinal microbiota. BMC Microbiol. 19(1):246–257.
- Wang X, Zhang Y, Zhang M, Kong H, Wang S, Cheng J, Qu H, Zhao Y. 2019. Novel carbon dots derived from Puerariae lobatae radix and their anti-gout effects. Molecules. 24(22):4152–4163.
- Wang Y, Wen J, Zheng W, Zhao L, Fu X, Wang Z, Xiong Z, Li F, Xiao W. 2015. Simultaneous determination of neochlorogenic acid, chlorogenic acid, cryptochlorogenic acid and geniposide in rat plasma by UPLC-MS/MS and its application to a pharmacokinetic study after administration of Reduning injection. Biomed Chromatogr. 29(1):68–74.
- Wang Y, Yin Y, Chen X, Zhao Y, Wu Y, Li Y, Wang X, Chen H, Xiang C. 2019. Induction of intestinal Th17 cells by flagellins from segmented filamentous bacteria. Front Immunol. 10:2750.
- Wang Y, Zhang G, Pan J, Gong D. 2015. Novel insights into the inhibitory mechanism of kaempferol on xanthine oxidase. J Agric Food Chem. 63(2):526–534.
- Wu Y, Wang X, Fan E. 2012. Optimisation of ultrasound-assisted extraction of puerarin and total isoflavones from Puerariae Lobatae Radix (Pueraria lobata (Wild.) Ohwi) with response surface methodology. Phytochem Anal. 23(5):513–519.
- Xu S, Cao X. 2010. Interleukin-17 and its expanding biological functions. Cell Mol Immunol. 7(3):164–174.
- Xu ZJ, Shu S, Li ZJ, Liu YM, Zhang RY, Zhang Y. 2017. Liuwei Dihuang pill treats diabetic nephropathy in rats by inhibiting of TGF-beta/SMADS, MAPK, and NF-kB and upregulating expression of cytoglobin in renal tissues. Medicine (Baltimore). 96(3):e5879.
- Xuan-Qing CHEN, Xiang-Yu LV, Shi-Jia LIU. 2021. Baitouweng decoction alleviates dextran sulfate sodium-induced ulcerative colitis by regulating intestinal microbiota and the IL-6/STAT3 signaling pathway. J Ethnopharmacol. 265:113357.
- Yan D, Tu Y, Jiang F, Wang J, Zhang R, Sun X, Wang T, Wang S, Bao Y, Hu C, et al. 2015. Uric acid is independently associated with diabetic kidney disease: a cross-sectional study in a Chinese population. PLoS One. 10(6):e0129797.
- Yan J, Zhang G, Hu Y, Ma Y. 2013. Effect of luteolin on xanthine oxidase: inhibition kinetics and interaction mechanism merging with docking simulation. Food Chem. 141(4):3766–3773.
- Yao F, Zhang R, Fu R, He W. 2011. Preventive and therapeutic effects of quercetin on hyperuricemia and renal injury in rats. Wei Sheng Yan Jiu. 40(2):175–177.
- Yu L, Gao F, Yang L, Xu L, Wang Z, Ye H. 2012. Biotransformation of puerarin into puerarin-6″-O-phosphate by Bacillus cereus. J Ind Microbiol Biotechnol. 39(2):299–305.
- Yu S, Hong Q, Wang Y, Hou K, Wang L, Zhang Y, Fu B, Zhou Y, Zheng W, Chen X, et al. 2015. High concentrations of uric acid inhibit angiogenesis via regulation of the Kruppel-like factor 2-vascular endothelial growth factor-A axis by miR-92a. Circ J. 79(11):2487–2498.
- Yuan H, Ma Q, Cui H, Liu G, Zhao X, Li W, Piao G. 2017. How can synergism of traditional medicines benefit from network pharmacology? Molecules. 22(7):1135–1153.
- Zhang D, Gao YL, Jiang S, Chen Y, Zhang Y, Pan Z. 2018. The similarity and variability of the iridoid glycoside profile and antioxidant capacity of aerial and underground parts of Lamiophlomis rotata according to UPLC-TOF-MS and multivariate analyses. RSC Adv. 8(5):2459–2468.
- Zhang T, Qiu F. 2020. Icariin protects mouse insulinoma min6 cell function by activating the PI3K/AKT pathway. Med Sci Monit. 26:e924453.
- Zhang Y, Pan R, Xu Y, Zhao Y. 2020. Treatment of refractory gout with TNF-alpha antagonist etanercept combined with febuxostat. Ann Palliat Med. 9(6):4332–4338.
- Zhang Z, Lam TN, Zuo Z. 2013. Radix Puerariae: an overview of its chemistry, pharmacology, pharmacokinetics, and clinical use. J Clin Pharmacol. 53(8):787–811.
- Zhou X, Zhang B, Zhao X, Lin Y, Wang J, Wang X, Hu N, Wang S. 2021. Chlorogenic acid supplementation ameliorates hyperuricemia, relieves renal inflammation, and modulates intestinal homeostasis. Food Funct. 12(12):5637–5649.