
 ?Mathematical formulae have been encoded as MathML and are displayed in this HTML version using MathJax in order to improve their display. Uncheck the box to turn MathJax off. This feature requires Javascript. Click on a formula to zoom.
Abstract
Context
Wen-Shen-Tong-Luo-Zhi-Tong (WSTLZT) Decoction is a Chinese prescription with antiosteoporosis effects, especially in patients with abnormal lipid metabolism.
Objective
To explore the effect and mechanism of WSTLZT on osteoporosis (OP) through adipocyte-derived exosomes.
Materials and methods
Adipocyte-derived exosomes with or without WSTLZT treated were identified by transmission electron microscopy, nanoparticle tracking analysis (NTA) and western blotting (WB). Co-culture experiments for bone marrow mesenchymal stem cells (BMSCs) and exosomes were performed to examine the uptake and effect of exosome in osteogenesis and adipogenic differentiation of BMSC. MicroRNA profiles, luciferase and IP were used for exploring specific mechanisms of exosome on BMSC. In vivo, 80 Balb/c mice were randomly divided into four groups: Sham, Ovx, Exo (30 μg exosomes), Exo-WSTLZT (30 μg WSTLZT-exosomes), tail vein injection every week. After 12 weeks, the bone microstructure and marrow fat distribution were analysed by micro-CT.
Results
ALP, Alizarin red and Oil red staining showed that WSTLZT-induced exosomes from adipocyte can regulate osteoblastic and adipogenic differentiation of BMSC. MicroRNA profiles observed that WSTLZT treatment resulted in 87 differentially expressed miRNAs (p < 0.05). MiR-122-5p with the greatest difference was screened by q-PCR (p < 0.01). The target relationship between miR-122-5p and SPRY2 was tested by luciferase and IP. MiR-122-5p negatively regulated SPRY2 and elevated the activity of MAPK signalling pathway, thereby regulating the osteoblastic and adipogenic differentiation of BMSC. In vivo, exosomes can not only improve bone microarchitecture but also significantly reduce accumulation of bone marrow adipose.
Conclusions
WSTLZT can exert anti-OP effect through SPRY2 via the MAKP signalling by miR-122-5p carried by adipocyte-derived exosomes.
Introduction
Osteoporosis (OP) is a chronic bone metabolic disease with a high incidence, high disability rate, long disease course and high medical cost that severely affects the quality of life of middle-aged and elderly people. According to epidemiological studies, it is estimated that 50% of postmenopausal women worldwide are affected by this disease, approximately 40% of whom will eventually progress to the occurrence of osteoporotic fractures, which will impose a heavy economic burden on all societies (Rachner et al. Citation2011; Si et al. Citation2015). Currently, most drugs on the market still rely on the bone homeostasis mechanism mediated by osteoblasts and osteoclasts as the main target for the treatment of OP, involving the use of bisphosphonates and oestrogen receptor drugs. However, these drugs have defects, including poor absorption and many adverse reactions, resulting in an inability to achieve satisfactory efficacy (Barnsley et al. Citation2021). Therefore, OP must be urgently understood as a systemic metabolic disease from a new perspective.
Increasing evidence has shown that the imbalance of bone lipid metabolism mediated by bone marrow mesenchymal stem cells (BMSCs) is an important mechanism underlying the pathogenesis of OP (Fazeli et al. Citation2013; Scheller et al. Citation2015). As a kind of pluripotent stem cells in the human bone marrow cavity, BMSCs can participate in construction of the bone marrow microenvironment and can differentiate into osteoblasts, adipocytes and chondrocytes. Osteogenesis and adipogenic differentiation are in a contradictory relationship: in the bone marrow of OP patients, adipocytes increase significantly with a decrease in bone mass, and this trend of relative stability between bone and adipose tissue is called bone–fat balance (Yu et al. Citation2018). Previous studies have shown that many cytokines related to bone remodelling, such as leptin and adiponectin, are all secreted by adipocytes (Cornish et al. Citation2018). These cytokines can directly or indirectly affect the direction of BMSC differentiation and regulate osteogenic markers (Runx2, Osterix, etc.) and the expression of adipogenic markers (PPARγ, CEBP-α/β/γ, etc.), which further affect the bone remodelling process (Cornish et al. Citation2018; Fassio et al. Citation2018). Therefore, the above studies suggest that adipocytes and their metabolites can affect BMSC osteogenesis and adipogenic differentiation in bone marrow, thereby regulating bone–fat balance.
Exosomes are important for intercellular communication and signal transmission, and the normal secretion of exosomes is closely related to body homeostasis. Studies have shown that almost all cultured cells can secrete exosomes, which are widely distributed in biological fluids, such as peripheral blood, urine and synovial fluid (Kalluri and LeBleu Citation2020). Exosomes can act on target cells by releasing and transmitting biologically active molecules, including RNA, proteins, antigen expression molecules and DNA, to activate signalling cascades in the target cells, thereby mediating physiological and pathological processes, such as cell migration, cell differentiation and immune response (Meldolesi Citation2018). It was reported that obesity can lead to hypoxia in adipocytes and that bioactive substances, such as miRNAs, in adipocyte-derived exosomes can increase accordingly (Sano et al. Citation2014). The osteogenic differentiation of BMSCs was significantly inhibited when the expression of Rab27a was inhibited in the bone microenvironment (Liu et al. Citation2015). These studies suggest that the effector molecules carried by exosomes are the key substances by which adipocytes communicate with distant organs and regulate systemic metabolism under physiological and pathological conditions.
Wen-Shen-Tong-Luo-Zhi-Tong (WSTLZT) Decoction, a prescription intended to warm kidneys and unblock the collaterals, is an empirical prescription by Professor YongMa for treating primary OP. WSTLZT is composed of Cornus officinalis Sieb. & Zucc. (Cornaceae), Davallia trichomanoides Blume. (Polypodiaceae), Astragalus membranaceus var. mongholicus (Bunge) P. K. Hsiao. (Fabaceae), Cnidium monnieri (L.) Spreng. (Apiaceae), Coix lacryma-jobi var. ma-yuen (Rom. Caill.) Stapf in Hook. f. (Poaceae), Aconitum carmichaelii Debeaux. (Ranunculaceae), Heracleum hemsleyanum Diels. (Apiaceae), Hansenia weberbaueriana (Fedde ex H. Wolff) Pimenov & Kljuykov. (Apiaceae), Gastrodia elata BI. (Orchidaceae) and other herbs have been used in the Affiliated Hospital of Nanjing University of Chinese Medicine for more than 10 years. This formula can effectively relieve patients’ clinical symptoms, such as pain in the back and loin; increase bone density; and improve patients’ quality of life (Zheng et al. Citation2016). Osthole, the main component of WSTLZT, can promote osteoblast differentiation through the Wnt signalling pathway and endoplasmic reticulum stress (Zheng et al. Citation2018), inhibit osteoclast differentiation and maturation through the NF-κB signalling pathway, and improve bone microstructure and bone metabolic homeostasis (Ma et al. Citation2019). An interesting phenomenon noted in a large number of clinical practices has attracted our attention: the efficacy of WSTLZT in patients with abnormal lipid metabolism in similar age groups seems to be significant. Therefore, we speculate that adipocyte-derived exosomes can regulate the influence on some signalling pathways through the effector substances they carry, thereby affecting the bone–fat balance in BMSCs in the bone marrow. Thus, WSTLZT can regulate the secretion of adipocyte exosomes and ultimately exert an anti-osteogenesis effect.
This study was designed to observe the effect of traditional Chinese medicine intervention on the secretion of adipocyte exosomes and to analyse the specific mechanism of adipocyte-derived exosomes on BMSC bone lipid differentiation and bone lipid metabolism in OP model mice, thereby revealing the regulatory effects and mechanisms of WSTLZT in bone–fat balance from the perspective of exosomes, effector miRNAs and targeted signalling pathways.
Materials and methods
Preparation of WSTLZT Decoction
WSTLZT is a decoction of 15 Chinese herbs as shown in . All these herbs were purchased in 2020 from the Affiliated Hospital of Nanjing University of Chinese Medicine (Nanjing, China), which was authenticated by Professor Dekang Wu from Nanjing University of Chinese Medicine (product code: Aconitum carmichaelii (NZY-MA-2020001), Cornus officinalis (NZY-MA-2020002), Davallia trichomanoides (NZY-MA-2020003), Epimedium brevicornum Maxim. (Berberidaceae) (NZY-MA-2020004), Cnidium monnieri (NZY-MA-2020005), Woodwardia japonica (L. f.) Sm. (Dicksoniaceae) (NZY-MA-2020006), Coix lacryma-jobi var. ma-yuen (NZY-MA-2020007), Atractylodes macrocephala Koidz. (Asteraceae) (NZY-MA-2020008), Hansenia weberbaueriana (NZY-MA-2020009), Asarum heterotropoides F. Schmidt. (Aristolochiaceae) (NZY-MA-2020010), Gastrodia elata (NZY-MA-2020011), Paeonia lactiflora Pall (Ranunculaceae) (NZY-MA-2020012), Glycyrrhiza uralensis Fisch (Fabaceae) (NZY-MA-2020013), Heracleum hemsleyanum (NZY-MA-2020014), and Astragalus membranaceus var. mongholicus (NZY-MA-2020015)). The herbs in WSTLZT were mixed according to the prescription and soaked in 10 times the volume of distilled water (v/w) for 0.5 h. Then, the herbs were boiled in the above distilled water for 1 h. The decocted dregs were added eight times the volume of distilled water (v/w) and boiled again for another 1 h. After that, the two decoctions were mixed, filtered, and then concentrated to 2 g/mL by rotavapor (Yarong, Shanghai, China). The medicinal liquid was lyophilized using freeze dryer (LTE Scientific, Greenfield, UK).
Table 1. Composition of WSTLZTF.
Qualitative analysis of components of WSTLZT water extract
The qualitative chemical composition of WSTLZT was analysed by a Waters 2695 high-performance liquid chromatography (HPLC) system (Waters, Milford, MA). The chromatographic separation was carried out by EClassical Hypersil OSD-C18 column (250 × 4.6 mm, 5 μm) with the temperature at 25 °C. The detection wavelength was scanned at 210–360 nm and used at 234 nm. Individual compounds were identified by comparing peak retention times with those of pure standard compounds. The volume of injection was 10 μL, and the flow rate was 1 mL/min. Solvent A (acetonitrile) and solvent B (acetonitrile, 0.1% phosphoric acid and 0.1% diethylamine) were used as mobile phases with the following gradient elution: 0–15 min, 95–84% A, 5–16% B; 15–17 min, 84% A, 16% B; 17–23 min, 84–79% A, 16–21% B; 23–45 min, 21–50% A, 79–50% B; 45–62 min, 50–95% A, 50–5% B. The representative active ingredients of WSTLZT are presented in .
Figure 1. Ultra performance liquid chromatography of WSTLZT with the representative active ingredients. (A) The total ion chromatogram in ion mode of WSTLZT water extract; (B) the total ion chromatogram in ion mode of standards; (C) chemical formula structure of active ingredients: 1, gastrodin; 2, protocatechuic acid; 3, loganin; 4, naringin; 5, benzoylmesaconine; 6, benzoylaconitine; 7, benzoylhypaconine; 8, icariin; 9, osthole; 10, isoimperatorin.

Experimental animals
The animals for the experiment were 8-week-old male (n = 23) and female (n = 103) Balb/c mice obtained from Shanghai Xipuer‐Bikai Laboratory Animal Co. Ltd (Shanghai, China, SCXK(Hu)2018-0006). The specific uses are as follows: three male and three female mice were used for BMSC isolation; 40 mice (20 male and 20 female) were used for preparation of drug-containing serum; the rest of the mice were kept in a light- and temperature-controlled room with 12 h light/dark cycle at 23 ± 2 °C constant temperature and in relative humidity between 50 and 60%. The mice were maintained and the research conducted on them followed the guidelines of the National Institute of Health Guidelines for Laboratory Animals, and approved by Animal Ethics Committee of Nanjing University of Chinese Medicine (no. ACU200601).
Preparation of drug-containing serum
A random selection of mice was divided into two groups of 20 mice each, and they were fed a normal diet. WSTLZT group was given water extract containing equivalent amounts of 2.63 g/kg WSTLZT once daily, whereas the control group received the same volume of distilled water once a day for seven days. Blood of two groups were aseptically collected from the abdominal aorta 2 h after final administration and the serum was then acquired by centrifugation of the blood at 720×g for 20 min. The drug-containing serum was stored at −80 °C and inactivated at 56 °C for 30 min before use.
Cell culture and differentiation
The pre-adipocyte 3T3‐L1 cell was purchased from American Type Culture Collection (Manassas, VA). For mouse BMSC isolation, the femora and tibiae were flushed with pipette to remove bone marrow. Cells were filtered through a 40 μM strainer. The cells were cultured in Dulbecco’s modified Eagle’s medium (DMEM) containing 10% FBS (Gibco, Carlsbad, CA). Colony forming cells were resuspended and stained with anti-CD90-FITC (1:1000, Biolegend, San Diego, CA, Cat#206105), anti-CD29-FITC (1:250, Invitrogen, Carlsbad, CA, Cat#11-0291-80), anti-CD45-FITC (1:1000, Invitrogen, Carlsbad, CA, Cat#11-0291-80), anti-CD34-Alexa488 (1:1000, Novus, Littleton, CO, Cat#NBP2-47911) for 30 min on ice under dark conditions. The immunophenotyping of CD90 + CD29 + CD45 + CD34 of the cells were performed by flow cytometry (Gaillios, Beckman, Brea, CA).
In order to induce osteogenic differentiation, we incubated the BMSC with mineralization-inducing media that contains 100 μM/mL ascorbic acid, 2 mM β-glycerophosphate and 10 nM dexamethasone (Sigma-Aldrich, St. Louis, MO). In order to induce adipogenic differentiation, we incubated the BMSC with adipogenic-inducing media that contains 0.5 mM isobutylmethylxanthine, 1 μM dexamethasone and 10 μg/mL insulin (Sigma-Aldrich, St. Louis, MO).
Exosome isolation
3T3-L1 cells were resuspended and seeded into six-well plate with each well containing 2 × 10⁴ cells and maintained in the culture medium containing 10% exosomes-free FBS. After 5–6 days of adipogenic induction, two groups were replaced with 10% blank/drug-containing serum, and exosome isolation was performed after 72 h of intervention. The supernatant from two groups was subjected to sequential centrifugation: 300×g for 10 min, 2000×g for 10 min, 10,000×g for 30 min and 100,000×g for 30 min by ultracentrifuge (L-100XP, Beckman, Brea, CA). All procedures were performed at 4 °C. Phosphate-buffered saline (PBS) was used to resuspend exosomes collected from the last pellet.
Nanoparticle tracking analysis (NTA)
A total of 20 μg of exosomes were dissolved in a 1 mL of PBS and rotated for 1 min. With the help of nanoparticle tracking analyser (Malvern Panalytical, Worcestershire, UK), the sample was used to measure the diameter size and particle number. Based on Brownian motion and diffusion coefficient, particles were tracked and sized automatically. Measurement conditions for the NTA analysis were 21.0 °C ± 0.5 °C; 0.99 °Cp; 25 frames/s; 30 s measurement time. The detection threshold was the same for all samples. Each sample was tested three times.
Transmission electron microscopy
Exosomes from 3T3-L1 cells were resuspended in PBS and fixed with 2% paraformaldehyde for 30 min at room temperature. We then dropped the sample onto UV-treated EM grids and allowed it to dry at room temperature for 15 min. Exosomes on the grids were then stained with 4% phosphotungstic acid for 5 min. The grids were then air-dried and examined under a LIBRA 200 transmission electron microscope at 120 kV (Zeiss, Oberkochen, Germany).
Exosome labelling and fluorescence microscopy
Exosomes were incubated with fluorescent dye PKH-67 for 5 min under dark condition at 20 °C. Purification of fluorescently labelled exosomes was performed by Exo-spin mini columns (EX03, Cell Guidance, Cambridge, UK). The purified exosomes were seeded on BMSCs and co-cultured for 12 h. Subsequently, DAPI staining was used to label the nuclei of BMSC. The uptake of exosomes by BMSC was observed by fluorescence microscopy (DMI8, Leica, Wetzlar, Germany).
ALP staining, Alizarin red staining and Oil red O staining
ALP staining: After 10–14 days of osteogenic induction, the BMSCs were fixed in 4% formaldehyde for 5 min at room temperature. In accordance with the protocol, alkaline phosphatase (ALP) staining kit (G1480, Solarbio, Beijing, China) was used for incubating with working solutions for 20 min. After the staining solution is removed by washing with PBS twice, the cells are dried in the air. An inverted microscope (DMI1, Leica, Wetzlar, Germany) was used to observe the staining results.
Alizarin red staining: After 21 days of osteogenic induction, the cells were fixed with 95% ethanol for 10 min and stained according to the instructions of Alizarin red kit (G1450, Solarbio, Beijing, China). The stained calcium nodules were observed under an optical microscope.
Oil red O staining: After seven days of adipogenic induction, the cells were fixed with 10% neutral formalin for 1 h and stained according to the instructions of Oil red O staining kit (G1262, Solarbio, Beijing, China). After washing with distilled water, the stained lipid droplets were observed under an inverted microscope.
microRNA extraction and microarray analysis
The miRNAs of high purity from the collected exosomes were extracted by miRNAs Isolation Kit (05080576001, Roche, Basel, Switzerland). Briefly, mix the exosome solution with 600 μL lysis/binding solution in the EP tube. After adding 60 μL of miRNA homogenization additive, invert and mix repeatedly and then let stand on ice for 10 min. Add 600 μL of acidified phenol and chloroform centrifuge at 3000×g for 5 min, take the supernatant for passing through the column to elute twice, and use the filtrate for later use.
In accordance with the manufacturer’s instructions, miRNAs were amplified and hybridized to Illumina expression profiling microarrays. Briefly, RNA was poly-A tailed, reverse transcribed from a polydT primer and biotinylated to create cDNA. The cDNA was extended with miRNA-specific oligos for all targeted sequences, and then amplification was carried out with cyanine 3 (Cy3) fluorophore-labelled primers. 0.1 N NaOH was used to denature the double-stranded PCR product bound to magnetic beads. Fluorophore-labelled strands were hybridized to microarrays of 1536 IllumiCode sequences attached to 3 μm beads. Hybridization was carried out overnight with a temperature ramp of 60–45 °C, washed to remove excess label, and dried in a vacuum desiccator before imaging by laser excitation of the fluorochrome-labelled sample. With the iScan system (Illumina, San Diego, CA), the fluorescence intensity images were analysed quantitatively. For screens of most differentially expressed miRNAs, a fold change of more than 2.0 and a p value of less than 0.05 were used.
Target prediction
According to the results of differentially expressed miRNAs, the prediction of gene targets of significantly differentially expressed miRNAs was performed by the Targetscan (www.targetscan.org), miRTarbase (https://miRTarBase.cuhk.edu.cn) and miRDB (www.mirdb.org). The following Venn diagram was created using the R language software (R Foundation for Statistical Computing, Vienna, Austria).
Cell grouping and transfection
The BMSC were classified into six groups as follows: the NC-mimic group (transfected with miR-122-5p negative control sequence), the miR-122-5p mimic group (transfected with miR-122-5p mimic), the NC-inhibitor group (transfected with the miR-122-5p inhibitor negative control sequence), the miR-122-5p inhibitor group (transfected with the miR-122-5p inhibitor sequence), the miR-122-5p mimic + SPRY2 OE group (transfected with miR-122-5p mimic and OE-SPRY2 plasmid) and the miR-122-5p inhibitor + SPRY2 KD group (transfected with miR-122-5p mimic and KD-SPRY2 plasmid). All sequences and plasmid were obtained from Nanjing Shenji Biotechnology Co. Ltd (Nanjing, China).
The logarithmic growth-phase BMSC were seeded into 12-well plates prior to transfection. After that, cell transfection was performed using Lipofectamine 2000 (Thermo Fisher, Carlsbad, CA) according to the manufacturer’s instructions. The sequences mentioned above were diluted by 250 μL serum-free Opti-MEM (Gibco, Grand Island, NY) and incubated for 5 min. An additional 250 μL serum-free medium Opti-MEM was used to dilute 5 μL lipofectamine 2000, and above two solutions were gently mixed and incubated for another 20 min. Lastly, the 50 μL of mixture was added to the wells containing BMSCs from all groups. Transfection medium was replaced with fresh growth medium after 6 h of incubation at 37 °C with 5% CO2, followed by another 24–48 h of incubation.
Luciferase assays
Human embryonic kidney (HEK)-293T cells obtained from ATCC were used as tool cell in this assay. To construct the pmirGLO vector, the complementary DNA (cDNA) fragment of SPRY2 3′-untranslated region (UTR) containing the miR-122-5p binding site was inserted. The mutated SPRY2 3′-UTR was constructed using DNA point mutation technology. It was inserted into pmirGLO vector and the correct insertion verified by sequencing. A pmirGLO-SPRY2 or pmirGLO-mutSPRY2 recombinant vector was then co-transfected with miR-122-5p mimics or miR-NC in HEK-293T cells. According to manufacturer’s instructions, we measured luciferase activity using a Luciferase Assay Kit (Promega, Sydney, Australia).
RT-qPCR
Total RNA was extracted from BMSC by TRIzol reagent (Tiangen, Beijing, China), and 1 μg of total RNA was used for the reverse transcription reaction. cDNA was generated by reverse transcription using FastKing gDna Dispelling RT SuperMix Kit (Tiangen, Beijing, China). The relative quantitative expression of mRNA or miRNA was determined by real-time RT-PCR using SYBR Green Supermix (Tiangen, Beijing, China). The data were analysed using the 2–ΔΔCT method. The sequences for primers are shown in .
Table 2. Primer sequence used in qPCR experiments.
RNA-binding protein IP assay
The RNA-binding protein IP assay was performed using the Magna RIPTM RNA Binding Protein Immunoprecipitation Kit (Millipore, Bedford, MA). Approximately 1 × 10⁷ cells were pelleted and resuspended in RIP lysis buffer with protease inhibitor cocktail and RNase inhibitors. Incubation with magnetic beads of anti-Ago2 Ab (ab186733, Abcam, Cambridge, UK) was performed at 4 °C overnight. In order to synthesize cDNA, RNAs were treated with proteinase K buffer and purified with TRIzol reagent. In order to detect specific expression of RNA, RT-qPCR was used with the sequence-specific primers listed above.
Western blot analysis
Total proteins were extracted by RIPA buffer and measured using the BCA method from BMSC in each group. SDS-PAGE was performed on a 10% polyacrylamide gel and samples were transferred onto PVDF nitrocellulose membranes (Millipore, Bedford, MA) under semi-dry conditions. The membranes were blocked overnight with 5% non-fat milk, then incubated with primary antibodies at 4 °C overnight, including: CD9 (1:1000, #13403, CST, Boston, MA),CD63 (1:1000, sc-5275, Santa Cruz, Dallas, TX), RUNX2 (1:1000, sc-101145, Santa Cruz, Dallas, TX), Osterix (1:1000, ab944744, Abcam, Cambridge, UK), CEBP-α (1:1000, AF6333, Affinity, Cincinnati, OH), PPARγ2 (1:1200, sc-7273, Santa Cruz, Dallas, TX), SPRY2 (1:1000, #14954, CST, Boston, MA), p-JNK (1:1000, #9255, CST, Boston, MA), JNK (1:1000, #9252, CST, Boston, MA), p-p38 (1:1000, #4511, CST, Boston, MA), p38 (1:1000, #8690, CST, Boston, MA), ERK1/2 (1:800, #11257-1-AP, Proteintech, Rosemont, IL), p-ERK1/2 (1:2000, #4370, CST, Boston, MA), GAPDH (1:1500, #5174, CST, Boston, MA). Following this, membranes were incubated with secondary horseradish peroxidase-conjugated antibodies at room temperature for 2 h. Lastly, the proteins were analysed using the luminescent image analyser Image Quant LAS-4000 Mini (GE Healthcare, Chicago, IL). All reactions were repeated three times and data were analysed with Image J software (Bethesda, MD).
OVX-induced animal model construction and drug administration
The remaining 80 female Balb/c mice were OVX or Sham-operated at 12 weeks of age. The detailed operation procedure was performed as our previous study (Wang et al. Citation2020). After three days, the mice were randomly divided into four groups of 20 mice each. Mice in each group were received drug intervention of 12 consecutive weeks and weighed once a week. The grouping method and doses administration was as follows: (a) the mice from Sham-operated group (Sham) were injected with 200 μL normal saline via tail vein injection once a week; (b) The mice from model group (OVX) were injected with 200 μL normal saline via tail vein injection once a week; (c) The mice from exosome group (EXO) were injected with 30 μg adipocyte-derived exosomes (diluted by 200 μL normal saline) via tail vein injection once a week; (d) The mice from WSTLZT-induced exosome group (WSTLZT + EXO) were injected with 30 μg WSTLZT-induced adipocyte-derived exosomes (diluted by 200 μL normal saline) via tail vein injection once a week. After 12 weeks of administration, the mice were sacrificed and the serum and bone tissues from all groups were collected.
Micro-CT
Both structure of trabecular bone of the femur and marrow adipose tissue (MAT) of tibia were analysed by micro-CT (Skyscan 1176, Bruker, Kontich, Belgium). The main protocol of micro-CT for bone microarchitecture was reported in our previous published literature (Wang et al. Citation2020). The CT scanner was configured as follows: resolution 9 μm, voltage 55 kV and current 70 mA. The following morphometric parameters, including: bone volume fraction (BV/TV), three-dimensional bone mineral density (3D BMD), trabecular bone thickness (Tb.Th), number of trabecular bone (Tb.N) and trabecular bone separation (Tb.Sp), were analysed by CTAn 1.14 software. Subsequently, the segmented data were imported to the software to construct the three‐dimensional images.
According to another previous published literature, tibias were removed from soft tissues, freed from connective tissues, and fixed in 10% formalin for 24 h. Decalcification of bones took place in 4% EDTA at pH 7.4 for two weeks. The tibiae were immersed into the glass vials containing 1:1 ratio of 2% osmium tetroxide and 5% potassium dichromate solution for two days. The parameters of CT scanner were set up as follows: resolution 16 μm, voltage 55 kV and current 70 mA. rMAT was analysed by measuring the BV/TV of the proximal 3 mm of the tibiae, as well as cMAT measured with BV/TV of the end of tibiae distal to the tibiofibular joint (Scheller et al. Citation2015).
Statistical analysis
All measurement data were presented as mean value ± standard deviation (±s). The statistical analysis was performed with SPSS 22.0 (SPSS Inc., Chicago, IL). The one-way analysis of variance (ANOVA) was used to compare multigroup enumeration data. The Student–Newman–Keuls test was used for pairwise comparisons. A statistical significance of p < 0.05 was considered significant.
Results
Characterization of exosomes secreted by adipogenesis
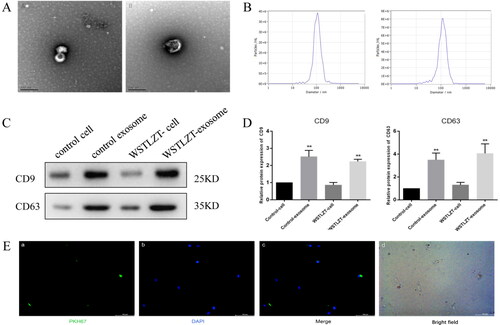
After the two groups of 3T3-L1 adipocytes were induced to mature, the culture medium supernatant was collected, and exosomes were extracted using ultracentrifugation for identification. In both groups of exosomes, typical small globular vesicles were observed under TEM (). The centre of the vesicles exhibited low density, with a diameter of approximately 80–130 nm. NTA revealed amplified particle signals in real time. The exosome diameters in the two groups were 102 ± 42 nm and 106 ± 55 nm (). WB showed that all proteins extracted from the cells and exosomes in the control group and WSTLZT group expressed CD9 and CD63 (). These results were consistent with the expression of antigenic markers in exosomes, and the expression in the WSTLZT group was higher than that in the control group.
Figure 2. Identification and uptake of adipocyte-derived exosomes. (A) Typical images of microscopic morphology of exosomes under transmission electron microscope (left: control group; right: WSTLZT group), scale bar = 200 nm. (B) Detection of the diameter distribution of adipocyte-derived exosomes (left: control group; right: WSTLZT group). (C) The protein levels of CD9 and CD63 in 3T3-L1 cells and exosomes secreted by cells were measured by western blot. (D) Relative protein expression of CD9 and CD63 was analysed to those in control. (E) Fluorescence microscope images of colocalization of exosomes from cells 3T3-L1 cells with BMSC. Exosomes were labelled by PKH-67 (green) and cell nuclei were stained with DAPI (blue), scale bar = 100 μm. Mean ± SEM (n = 3), **p < 0.01 vs. control-cell group.
WSTLZT-induced exosomes regulate osteoblastic and adipogenic differentiation of BMSC
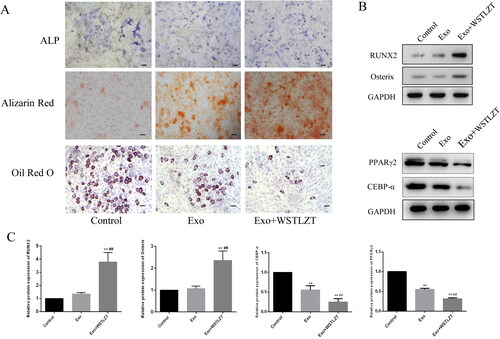
After PKH-67-labeled adipocyte-derived exosomes were added to BMSCs with DAPI-labelled nuclei for 12 h of co-culture, microscopic observation showed that exosomes with green fluorescence appeared in or around the nucleus (blue fluorescence). These results suggest that adipocyte-derived exosomes can be taken up by BMSCs (). BMSCs and adipocyte-derived exosomes were co-cultured and subjected to osteogenic induction. The exosomes significantly stimulated the osteogenic differentiation of BMSCs. The numbers of ALP-positive cells and the Alizarin red-positive area were significantly greater than in the control group. Osteogenic differentiation was further stimulated in the WSTLZT group (). In addition, the mRNA and protein expression trends of the osteogenic markers RUNX2 and Osterix were consistent with their osteogenic differentiation phenotypes. Co-culture with exosomes significantly inhibited adipogenic differentiation of BMSCs, and the proportion of mature adipocytes was significantly less than that in the control group. Adipogenic differentiation was further inhibited in the WSTLZT group. Moreover, the mRNA and protein expression trends of the adipogenic markers CEBP-α and PPARγ2 were consistent with their adipogenic differentiation phenotypes ().
Figure 3. WSTLZT-induced exosomes regulate osteoblastic and adipogenic differentiation of BMSC in the co-culture system of BMSC and adipocyte-derived exosomes. (A) ALP staining, Alizarin red staining, Oil red O staining, scale bar = 100 μm; (B) the protein levels of osteogenic markers RUNX2, Osterix and adipogenic markers CEBP-α, PPARγ2 were measured by western blot. (C) Protein expression of RUNX2, Osterix, CEBP-α and PPARγ2 was analysed relative to those in control. Mean ± SEM (n = 3). Compared with the control group, **p < 0.01; compared with the co-culture group, ##p < 0.01.
WSTLZT-induced exosomes secreted by adipocyte transfer miR-122-5p to BMSC
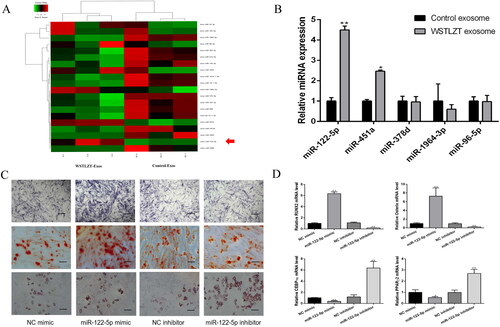
By processing high-throughput data, we screened the top 20 differentially expressed miRNAs, which included miR-122-5p, and verified the top five differentially expressed miRNAs in the comprehensive ranking using PCR experiments. We found that the expression level of miR-122-5p was the highest (). Thus, we chose miR-122-5p for follow-up experiments. Subsequently, we performed osteogenic and adipogenic induction of BMSCs transfected with NC mimic, miR-122-5p mimic, NC inhibitor or miR-122-5p inhibitor. The results showed that ALP and Alizarin red staining was darkest in the miR-122-5p mimic group, while Oil red O staining did not change significantly. The transcription levels of the osteogenic differentiation-related factors Runx2 and Osterix were increased, and the levels of the adipogenesis-related factors PPARγ2 and CEBP-α were lower than those in the NC group. In the miR-122-5p inhibitor group, the number of lipid droplets stained with Oil red O increased significantly, while ALP and Alizarin red staining did not change significantly (). The levels of the osteogenic differentiation-related factors Runx2 and Osterix were reduced while the levels of the adipogenesis-related factors PPARγ2 and CEBP-α were increased compared with levels in the NC group ().
Figure 4. Exosomes secreted by adipocyte regulate osteoblastic and adipogenic differentiation of BMSC by transferring miR-122-5p to BMSC. (A) A heatmap of the top 20 differentially expressed miRNAs in the exosomes derived from 3T3-L1 cells between control group and WSTLZT group. (B) MiRNAs levels in exosomes of 3T3-L1 cells between control group and WSTLZT group were analysed by q-PCR. Compared with the control group, *p < 0.05, **p < 0.01. (C) ALP staining after transfection, Alizarin red staining after transfection, Oil red O staining after transfection, scale bar = 200 μm. (D) The mRNA expression patterns of RUNX2, Osterix, CEBP-α and PPARγ2 after transfection measured by q-PCR. Mean ± SEM (n = 3). Compared with the NC mimic group, *p < 0.05, **p < 0.01.
Specific binding of miR-122-5p to the target gene SPRY2
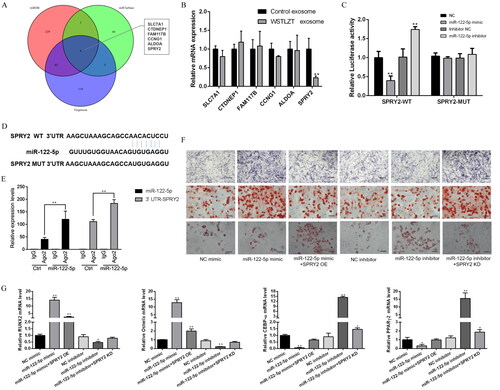
As shown in , potential miR-122-5p target genes were predicted using three online databases, and a total of six genes were obtained after intersection (SLC7A1, CTDNEP1, FAM117B, CCNG1, ALDOA and SPRY2). By examining the expression levels of the six potential target genes in the two groups, it was found that the expression level of SPRY2 was reduced in the TCM group. Next, based on these results, SPRY2-wild-type and SPRY2-mutant luciferase vectors were constructed. Each group was transfected with the vectors, and luciferase activity was detected. After transfection with miR-122-5p mimic, luciferase activity was significantly reduced in the SPRY2-wild-type group, and after transfection with miR-122-5p inhibitor, luciferase activity was significantly increased. In the SPRY2-mutant group, there was no significant change in luciferase activity regardless of whether the cells were transfected with miR-122-5p mimic or miR-122-5p inhibitor (). These results suggest that miR-122-5p can specifically target and bind SPRY2 through the binding sites shown in the figure. In addition, the binding of miR122-5p to SPRY2 was further verified by RNA-binding protein immunoprecipitation. miRNA and its target gene sequences were enriched using Ago2 antibody. The mRNA expression levels of miR-122-5p and SPRY2 were detected by qPCR. SPRY2 mRNA levels in the immunoprecipitation complex were found to increase after overexpression of miR-122-5p (). These results suggest that miR-122-5p can bind to the SPRY2 3’UTR to regulate its function.
Figure 5. MiR-122-5p regulates osteoblastic and adipogenic differentiation of BMSC by down-regulating SPRY2. (A) Predicted target genes of miR-122-5p from Targetscan, miRDB and miR Tarbase. (B) Validation of predicted potential target genes by q-PCR. Compared with the control exosome group, **p < 0.01. (C) Targeting relationship between miR-122-5p and SPRY2 verified by dual luciferase reporter assay. Compared with the NC group, **p < 0.01. (D) The binding sites between miR-122-5p and SPRY2 validated by the biological in the NCBI. (E) Targeting relationship between miR-122-5p and SPRY2 verified by immunoprecipitation. Compared with the miR-122-5p group, **p < 0.01. (F) ALP staining after transfection, Alizarin red staining after transfection, Oil red O staining after transfection, scale bar = 200 μm. (G) The mRNA expression patterns of RUNX2, Osterix, CEBP-α and PPARγ2 after transfection measured by q-PCR. Mean ± SEM (n = 3). Compared with the NC mimic group, *p < 0.05, **p < 0.01.
miR-122-5p carried by WSTLZTF-induced exosomes regulates osteoblastic and adipogenic differentiation of BMSC by SPRY2 and MAPK signalling pathway
Furthermore, we detected osteogenic- and lipogenic-related indicators in each group. The results showed that ALP and Alizarin red staining was darker in the miR-122-5p mimic group than in the NC mimic group, while the Oil red O staining did not change significantly. However, after cotransfection with miR-122-5p mimic and SPRY2 OE, ALP and Alizarin red staining was light, and the number of lipid droplets stained with Oil red O was significantly increased. In the miR-122-5p inhibitor group, the number of lipid droplets stained with Oil red O increased significantly compared with the number in the NC mimic group, while ALP and Alizarin red staining did not change significantly. However, after cotransfection with miR-122-5p inhibitor and SPRY2 KD, the ALP and Alizarin red staining became darker, while the number of lipid droplets stained with Oil red O was significantly reduced (). These results suggest that miR-122-5p can regulate osteogenesis and adipogenic differentiation by targeting SPRY2. The mRNA and protein expression trends of the osteogenic markers Runx2 and Osterix and the adipogenic markers CEBP-α and PPARγ2 were also consistent with the cell differentiation phenotypes ().
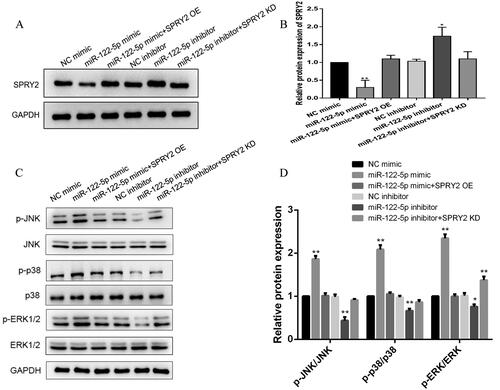
As shown in , WB results showed that overexpression of miR-122-5p inhibited SPRY2 protein expression, which was significantly downregulated compared with that in the NC mimic group. However, after cotransfection with miR-122-5p mimic and SPRY2 OE, the SPRY2 protein expression level was restored to the level in the NC mimic control group. The SPRY2 protein expression level in the miR-122-5p inhibitor group was significantly higher than that in the NC inhibitor control group. However, after cotransfection with miR-122-5p inhibitor and SPRY2 KD, the protein expression level of SPRY2 was restored to the level in the NC inhibitor control group. To further clarify the downstream mechanism of SPRY2, we detected the protein expression levels of the related proteins p-JNK, JNK, p-p38, p38, p-ERK1/2 and ERK1/2 in the MAPK signalling pathway and found that the relative p-JNK/JNK, p-p38/p38 and p-ERK1/2/ERK1/2 protein expression levels were significantly increased in the miR-122-5p mimic group compared with the NC mimic group. In the miR-122-5p inhibitor group, the relative p-JNK/JNK, p-p38/p38 and p-ERK1/2/ERK1/2 protein expression levels were reduced to different degrees compared with levels in the NC mimic group. In the miR-122-5p + SPRY2 KD group, only the relative protein expression levels of p-ERK1/2/ERK1/2 were elevated compared to levels in the NC mimic group, but there was no significant difference in the relative protein expression levels in the other groups compared with the NC mimic group ().
Figure 6. MiR-122-5p activates the MAPK signalling pathway by SPRY2. (A) The protein level of SPRY2 was measured after transfection by western blot. (B) Protein expression of SPRY2 was analysed relative to that of control. (C) The protein levels of MAPK signalling pathway-related genes (p-JNK, JNK, p-p38, p38, p-ERK1/2 and ERK1/2) were measured after transfection by western blot. (D) Protein expression of p-JNK/JNK, p-p38/p38 and p-ERK1/2/ERK1/2 was analysed relative to those of control. Mean ± SEM (n = 3). Compared with the NC mimic group, *p < 0.05, **p < 0.01.
WSTLZT-induced exosomes secreted by adipocyte regulate bone–fat balance in ovariectomized mice
The three parameters 3D BMD, BV/TV and Tb.Th were significantly lower in the model group than in the Sham surgery group. The injection of exosomes and TCM intervention of exosomes improved the trend of the three parameters to varying degrees. The trabecular spacing (Th.Sp) value in the model group was significantly higher than that in the Sham surgery group, but the Th.Sp value in the exosome group and TCM intervention of exosome group was significantly lower than in the model group ().
Figure 7. WSTLZT-induced exosomes secreted by adipocyte regulate bone–fat balance in ovariectomized mice. (A) Representative 3D morphometry reconstruction and images of distal femur by micro-CT. (B) Quantitative measurements of bone mineral density (BMD), bone volume/tissue volume (BV/TV), trabecular thickness (Tb.Th) and trabecular separation (Tb.Sp) by system. (C) Representative 3D morphometry reconstruction and images of adipocyte volume in the tibiae by micro-CT. (D) Quantitative measurements of regulated marrow adipose tissue (rMAT) and constitutive marrow adipose tissue (cMAT) by system. Mean ± SEM (n = 3). Compared with the Sham group, *p < 0.05, **p < 0.01, compared with the OVX group, #p < 0.05, ##p < 0.01.
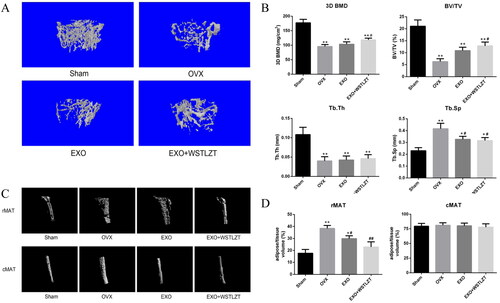
By observing three-dimensional reconstructed images of rMAT and cMAT, we found that the rMAT increased significantly in mice in the model group and that the injection of exosomes and TCM intervention of exosomes significantly reversed this trend. However, the changes in cMAT among the four groups were not significant. To further quantify bone MAT, we analysed the ratio of fat volume to tissue volume in each group via micro-CT analysis. We found that the rMAT level in the model group was significantly higher than that in the Sham surgery group. The injection of exosomes and TCM intervention of exosomes significantly reversed this trend, while the changes in cMAT among the four groups were not significant ().
Discussion
The role of adipose tissue as a new type of endocrine ‘organ’ in the bone marrow microenvironment has gradually been recognized. Adipose tissue can participate in intercellular signal transmission through direct secretion and paracrine functions (Rendina-Ruedy and Rosen Citation2017). Studies have shown that bone MAT in patients with OP increases significantly with the reduction in bone mass (Yu et al. Citation2018). Patients with OP are more likely to have lipid metabolism disorders, such as hyperlipidaemia and fatty liver (Liu et al. Citation2015). As a major method of intercellular communication, the important role of exosomes in bone metabolism has been gradually revealed. Chinese medicine and its effective components have been confirmed to participate in the regulation of exosome secretion (Liao et al. Citation2019). Buyang Huanwu Decoction (BYHWD) exposure was proved to augment angiogenetic miRNA and VEGF expression in exosomes secreted by MSCs and elevated angiogenesis in rat brain (Yang et al. Citation2015). Active ingredients of Chinese herbs such as Morinda officinalis F. C. How (Rubiaceae), enable suppression of osteoclastic differentiation by exosomes derived from rat mesenchymal stem cells (Wu et al. Citation2022). In this study, we first extracted adipocyte-derived exosomes by ultracentrifugation and successfully identified them via transmission electron microscopy (TEM), NTA and western blotting (WB). Subsequently, successful uptake of adipose-derived exosomes by BMSCs was verified by co-culture after fluorescence labelling of exosomes with PKH-67. When we added adipocyte-derived exosomes to the BMSC culture system, we found that the exosomes significantly enhanced the osteogenic differentiation ability of BMSCs and inhibited adipogenic differentiation, while this effect was further amplified by WSTLZT. Therefore, further investigation of the active substances in exosomes and the specific mechanisms underlying their action attracted our interest.
Among the relevant studies involving the contents of exosomes, studies on miRNAs have received increasing attention. Circulating miR-214 in exosomes not only represents a biomarker for bone loss but could selectively regulate osteoblast function (Sun et al. Citation2016). In addition, studies have found that exosomal miR-31a-5p derived from BMSCs in aged rats can enhance osteoclast differentiation, thereby exacerbating age-related bone loss (Xu et al. Citation2018), suggesting that inhibition of miR-31a-5p has a potential therapeutic effect on age-related OP. Gao et al. (Citation2021) found that miR-34a carried by adipocyte exosomes inhibited the polarization of M1 macrophages in a mouse model of osteolysis. To further explore the active substances in exosomes, we extracted exosome-derived miRNAs and performed high-throughput sequencing to screen out the 20 most significantly differentially expressed miRNAs. The differentially expressed miRNAs were verified in PCR experiments to include miR-122-5p. To further study the effect of miR-122-5p on the balance of bone lipid differentiation of BMSCs, we induced osteogenic and adipogenic differentiation of BMSCs transfected with miR-122-5p mimic. Osteogenic differentiation was found to be enhanced in the mimic group, while adipogenic differentiation was not significantly changed compared to that in the other groups. Adipogenic differentiation was enhanced in the inhibitor group, while osteogenic differentiation was not significantly changed compared to that in the other groups. q-PCR experiments showed that the mimic increased the expression of the osteogenic differentiation marker genes RUNX2 and Osterix but inhibited expression of the adipogenic differentiation marker genes CEBP-α and PPARγ2, while treatment with the inhibitor yielded the opposite results. As a classic miRNA, miR-122-5p has received a certain degree of attention in recent years. Hsa-miR-122-5p was differentially regulated by nanotopography. This miRNA could be related to the osteogenic differentiation response of BMSC to help control the osseointegration process (Sartori et al. Citation2018). Meanwhile, miR-122-5p can also be considered as targets of adipocyte involvement in adipocyte microenvironment dysregulation (Delort et al. Citation2020). It can be seen that miR-122-5p is closely related to osteogenesis and adipogenesis.
To further explore the target of miR-122-5p, we first used three online target gene prediction websites and obtained six genes after intersection of the results. Subsequently, the expression of the six candidate target genes was verified by q-PCR. The expression level of SPRY2 in exosomes treated with TCM was found to be significantly reduced, preliminarily verifying that SPRY2 is a target gene of differentially expressed miRNAs. We predicted the site of SPRY2 targeted binding to miR-122-5p using a bioinformatic website. Subsequently, we used a luciferase assay and RIP-qPCR analysis to confirm the targeted binding of miR-122-5p to SPRY2 from both exogenous and endogenous perspectives. In vivo analyses have revealed that SPRY2 is associated with bone formation and mineralization (Taketomi et al. Citation2018). The enhancement of osteogenic differentiation of BMSC is often accompanied by the weakening of adipogenic differentiation function. This tendency to maintain the dynamic balance of bone and adipose tissue is called bone–fat balance (Yu et al. Citation2018). Then, BMSCs were transfected with SPRY2 overexpression and knockdown plasmids. After induction of differentiation, we observed the cell differentiation in each group, the expression levels of osteogenic adipogenic marker genes and the protein expression level of SPRY2. The results confirmed that miR-122-5p regulates the balance of bone lipid differentiation of BMSCs by targeting SPRY2. Previous studies have confirmed that SPRY2 is a target gene of miR-122-5p and that miR-122-5p can induce downregulation of SPRY2 to negatively regulate the ERK/MAPK signalling pathway, promoting the proliferation of psoriatic keratinocytes (Jiang et al. Citation2017). BMSC-derived exosomes can carry miR-122-5p and bind SPRY2 to delay the occurrence and development of osteonecrosis of the femoral head by regulating the RTK/Ras/MAPK signalling pathway (Liao et al. Citation2019). Sequencing and subsequent Kyoto Encyclopedia of Genes and Genomes (KEGG) analysis results showed that the differentially expressed genes were enriched in the Ras signalling pathway, a signalling pathway that regulates stem cell pluripotency, and Ras, the most famous upstream signal of ERK in the MAPK signalling pathway, has a close relationship with this pathway.
The MAPK signalling pathway is a classical signalling pathway mediated by serine–threonine kinases that participate in a variety of cellular activities. This pathway is involved in a variety of intracellular signal transduction activities, including cell proliferation, differentiation, apoptosis and necrosis (McCubrey et al. Citation2006). The mammalian MAPK family is mainly composed of ERK, p38 and JNK (Torii et al. Citation2006). These three molecules represent the three main branching routes in the MAPK pathway. Among them, JNK and p38 are mainly related to inflammation, apoptosis and growth, while ERK is mainly related to cell growth and differentiation (Kim and Choi Citation2010). The MAPK signalling pathway also plays important role in mediating osteogenesis and adipogenesis of BMSC. MAPK signalling pathway was responsible for the enhanced BMSCs’ osteogenesis induced by alpha CGRP, which might offer a promising strategy for bone-related disorders (Jiang et al. Citation2022). Icariin, one of the active ingredients of WSTLZT, has been proved that can promote the proliferation and inhibited the apoptosis and adipogenesis of BMSC by suppressing MAPK pathway (Deng et al. Citation2022). Further, gambogic acid was confirmed to mediate p38 and JNK signalling pathways to inhibit osteoclast formation and exert its potential anti-osteolysis effect. In this study, we further detected the expression of MAPK-related signalling proteins in each group and found that the three-relative p-JNK/JNK, p-p38/p38 and p-ERK1/2/ERK1/2 ratios were significantly increased in the mimic group but were significantly downregulated in the inhibitor group. However, only the relative p-ERK1/2/ERK1/2 protein expression levels were increased in the miR-122-5p + SPRY2 KD group compared to the NC mimic group. Therefore, we can draw the following conclusions: miR-122-5p can regulate the bone lipid differentiation effect of BMSCs by binding to the target gene SPRY2 to mediate the MAPK signalling pathway, and the ERK branch line of the signalling pathway may play a major role in this process.
In the in vivo experiment, we administered an appropriate frequency of exosome intervention in ovariectomized mice via tail vein injection and conducted three-dimensional observation of the bone microstructure and detected the distribution of adipose tissue around the bone via micro-CT analysis. Bone MAT is a type of functionally specific fat accumulation in bones that has the potential to promote local and systemic metabolism (Scheller and Rosen Citation2014; Liu et al. Citation2015). Further accumulation of MAT can occur under a variety of clinical conditions, including OP, aging, gonadal dysfunction, diabetes and anorexia (Fazeli et al. Citation2013). Bone MAT has regional specificity. Proximal tibial fat is defined as rMAT, which is easily affected by various factors, such as age, temperature and drugs; distal tibial fat is defined as cMAT, and its content is relatively stable and not easily affected by other factors (Scheller et al. Citation2015). We observed bone loss in the mice in the model group, and the bone microstructure was destroyed. In addition, the injection of exosomes significantly improved the three bone cancellous parameters except trabecular thickness (Tb.Th), and the effect in the TCM regulating exosome group was slightly better than that in the exosome group. Furthermore, we found a significant accumulation of rMAT in the OVX group by analysing the fat volume proportion, and exosomes significantly improved this trend. The effect in the TCM regulating exosome group was better than that in the exosome group, but no significant differences were observed between the two groups. The cMAT changes in the four groups were not significant. The main limitation of this in vivo study is that only the effect was observed, but the mechanism was not studied; however, the results can be used as an entry point for further studies.
Conclusions
Our study preliminarily demonstrated that adipocyte-derived exosomes can regulate the SPRY2-mediated MAPK signalling pathway through the effector miR-122-5p carried by exosomes, thereby affecting the balance of bone lipid differentiation of BMSCs in the bone marrow. In addition, WSTLZT can regulate the secretion of adipocyte-derived exosomes and ultimately exert an anti-OP effect through the above process.
Author contributions
LW and YG contributed to conception and design of study. JW, ZH and JS contributed to acquisition of data. LY, ML and ZY contributed to analysis of data. LW and YP contributed to drafting the manuscript. YM, ML and PT contributed to revising the manuscript critically for important intellectual content. All authors approved the version of the manuscript to be published.
Supplemental Material
Download TIFF Image (687 KB)Supplemental Material
Download TIFF Image (59.1 KB)Supplemental Material
Download TIFF Image (2.3 MB)Acknowledgements
We thank all the staff of Lab of Professor Tonghui Ma in Nanjing University of Chinese Medicine.
Disclosure statement
The authors declare no conflict of interest.
Data availability statement
The data sets used and/or analysed during the current study or supplementary material are available from the corresponding author on reasonable request.
Additional information
Funding
References
- Barnsley J, Buckland G, Chan PE, Ong A, Ramos AS, Baxter M, Laskou F, Dennison EM, Cooper C, Patel HP. 2021. Pathophysiology and treatment of osteoporosis: challenges for clinical practice in older people. Aging Clin Exp Res. 33(4):759–773.
- Cornish J, Wang T, Lin JM. 2018. Role of marrow adipocytes in regulation of energy metabolism and bone homeostasis. Curr Osteoporos Rep. 16(2):116–122.
- Delort L, Cholet J, Decombat C, Vermerie M, Dumontet C, Castelli FA, Fenaille F, Auxenfans C, Rossary A, Caldefie-Chezet F. 2020. The adipose microenvironment dysregulates the mammary myoepithelial cells and could participate to the progression of breast cancer. Front Cell Dev Biol. 8:571948.
- Deng S, Zeng Y, Xiang J, Lin S, Shen J. 2022. Icariin protects bone marrow mesenchymal stem cells in aplastic anemia by targeting MAPK pathway. Mol Biol Rep. 49(9):8317–8324.
- Fassio A, Idolazzi L, Rossini M, Gatti D, Adami G, Giollo A, Viapiana O. 2018. The obesity paradox and osteoporosis. Eat Weight Disord. 23(3):293–302.
- Fazeli PK, Horowitz MC, Macdougald OA, Scheller EL, Rodeheffer MS, Rosen CJ, Klibanski A. 2013. Marrow fat and bone – new perspectives. J Clin Endocrinol Metab. 98(3):935–945.
- Gao XR, Ge J, Li WY, Zhou WC, Xu L, Geng DQ. 2021. miR-34a carried by adipocyte exosomes inhibits the polarization of M1 macrophages in mouse osteolysis model. J Biomed Mater Res. 109(6):994–1003.
- Jiang M, Ma W, Gao Y, Jia K, Zhang Y, Liu H, Sun Q. 2017. IL-22-induced miR-122-5p promotes keratinocyte proliferation by targeting Sprouty2. Exp Dermatol. 26(4):368–374.
- Jiang Y, Xin N, Xiong Y, Guo Y, Yuan Y, Zhang Q, Gong P. 2022. AlphaCGRP regulates osteogenic differentiation of bone marrow mesenchymal stem cells through ERK1/2 and p38 MAPK signaling pathways. Cell Transplant. 31:9636897221107636.
- Kalluri R, Lebleu VS. 2020. The biology, function, and biomedical applications of exosomes. Science. 367(6478):u6977.
- Kim EK, Choi EJ. 2010. Pathological roles of MAPK signaling pathways in human diseases. Biochim Biophys Acta. 1802(4):396–405.
- Liao W, Ning Y, Xu H-J, Zou W-Z, Hu J, Liu X-Z, Yang Y, Li Z-H. 2019. BMSC-derived exosomes carrying microRNA-122-5p promote proliferation of osteoblasts in osteonecrosis of the femoral head. Clin Sci. 133(18):1955–1975.
- Liu H-F, He H-C, Yang L, Yang Z-Y, Yao K, Wu Y-C, Yang X-B, He C-Q. 2015. Pulsed electromagnetic fields for postmenopausal osteoporosis and concomitant lumbar osteoarthritis in southwest China using proximal femur bone mineral density as the primary endpoint: study protocol for a randomized controlled trial. Trials. 16(1):265.
- Liu S, Liu D, Chen C, Hamamura K, Moshaverinia A, Yang R, Liu Y, Jin Y, Shi S. 2015. MSC transplantation improves osteopenia via epigenetic regulation of notch signaling in lupus. Cell Metab. 22(4):606–618.
- Ma Y, Wang L, Zheng S, Xu J, Pan Y, Tu P, Sun J, Guo Y. 2019. Osthole inhibits osteoclasts formation and bone resorption by regulating NF-kappaB signaling and NFATc1 activations stimulated by RANKL. J Cell Biochem. 120(9):16052–16061.
- McCubrey JA, Lahair MM, Franklin RA. 2006. Reactive oxygen species-induced activation of the MAP kinase signaling pathways. Antioxid Redox Signal. 8(9–10):1775–1789.
- Meldolesi J. 2018. Exosomes and ectosomes in intercellular communication. Curr Biol. 28(8):R435–R444.
- Rachner TD, Khosla S, Hofbauer LC. 2011. Osteoporosis: now and the future. Lancet. 377(9773):1276–1287.
- Rendina-Ruedy E, Rosen CJ. 2017. Bone–fat interaction. Endocrinol Metab Clin North Am. 46(1):41–50.
- Sano S, Izumi Y, Yamaguchi T, Yamazaki T, Tanaka M, Shiota M, Osada-Oka M, Nakamura Y, Wei M, Wanibuchi H, et al. 2014. Lipid synthesis is promoted by hypoxic adipocyte-derived exosomes in 3T3-L1 cells. Biochem Biophys Res Commun. 445(2):327–333.
- Sartori E, Magro-Filho O, Mendonça D, Li X, Fu J, Mendonça G. 2018. Modulation of microRNA expression and osteoblast differentiation by nanotopography. Int J Oral Maxillofac Implants. 33(2):269–280.
- Scheller EL, Doucette CR, Learman BS, Cawthorn WP, Khandaker S, Schell B, Wu B, Ding S-Y, Bredella MA, Fazeli PK, et al. 2015. Region-specific variation in the properties of skeletal adipocytes reveals regulated and constitutive marrow adipose tissues. Nat Commun. 6:7808.
- Scheller EL, Rosen CJ. 2014. What’s the matter with MAT? Marrow adipose tissue, metabolism, and skeletal health. Ann N Y Acad Sci. 1311(1):14–30.
- Si L, Winzenberg TM, Jiang Q, Chen M, Palmer AJ. 2015. Projection of osteoporosis-related fractures and costs in China: 2010–2050. Osteoporos Int. 26(7):1929–1937.
- Sun W, Zhao C, Li Y, Wang L, Nie G, Peng J, Wang A, Zhang P, Tian W, Li Q, et al. 2016. Osteoclast-derived microRNA-containing exosomes selectively inhibit osteoblast activity. Cell Discov. 2(1):16015.
- Taketomi T, Onimura T, Yoshiga D, Muratsu D, Sanui T, Fukuda T, Kusukawa J, Nakamura S. 2018. Sprouty2 is involved in the control of osteoblast proliferation and differentiation through the FGF and BMP signaling pathways. Cell Biol Int. 42(9):1106–1114.
- Torii S, Yamamoto T, Tsuchiya Y, Nishida E. 2006. ERK MAP kinase in G cell cycle progression and cancer. Cancer Sci. 97(8):697–702.
- Wang L, Zheng S, Huang G, Sun J, Pan Y, Si Y, Tu P, Xu G, Ma Y, Guo Y. 2020. Osthole-loaded N-octyl-O-sulfonyl chitosan micelles (NSC-OST) inhibits RANKL-induced osteoclastogenesis and prevents ovariectomy-induced bone loss in rats. J Cell Mol Med. 24(7):4105–4117.
- Wu P, Jiao F, Huang H, Liu D, Tang W, Liang J, Chen W. 2022. Morinda officinalis polysaccharide enable suppression of osteoclastic differentiation by exosomes derived from rat mesenchymal stem cells. Pharm Biol. 60(1):1303–1316.
- Xu R, Shen X, Si Y, Fu Y, Zhu W, Xiao T, Fu Z, Zhang P, Cheng J, Jiang H. 2018. MicroRNA-31a-5p from aging BMSCs links bone formation and resorption in the aged bone marrow microenvironment. Aging Cell. 17(4):e12794.
- Yang J, Gao F, Zhang Y, Liu Y, Zhang D. 2015. Buyang Huanwu Decoction (BYHWD) enhances angiogenic effect of mesenchymal stem cell by upregulating VEGF expression after focal cerebral ischemia. J Mol Neurosci. 56(4):898–906.
- Yu B, Huo L, Liu Y, Deng P, Szymanski J, Li J, Luo X, Hong C, Lin J, Wang C-Y. 2018. PGC-1α controls skeletal stem cell fate and bone–fat balance in osteoporosis and skeletal aging by inducing TAZ. Cell Stem Cell. 23(2):193–209.e5.
- Zheng S, Ma Y, Guo Y, Wang L, Pan Y. 2018. Osthole promote differentiation and inhibit proliferation of osteoblast by activating Wnt signaling and endoplasmic reticulum stress. Pharmacogn Mag. 14:641–646.
- Zheng S, Ma Y, Guo Y, Dong W, Fan J, Huang G. 2016. Treating primary osteoporosis with Wen-Shen-Tong-Luo-Zhi-Tong Decoction. Liaoning J Tradit Chin Med. 43:2098–2100.