
Abstract
Context
Sanguinarine (SAG) is the most abundant constituent of Macleaya cordata (Willd.) R. Br. (Popaceae). SAG has shown antimammary and colorectal metastatic effects in mice in vivo, suggesting its potential for cancer chemotherapy.
Objective
To determine the antimetastatic effect and underlying molecular mechanisms of SAG on melanoma.
Materials and methods
CCK8 assay was used to determine the inhibition of SAG on the proliferation of A375 and A2058 cells. Network pharmacology analysis was applied to construct a compound-target network and select potential therapeutic targets of SAG against melanoma. Molecular docking simulation was conducted for further analysis of the selected targets. In vitro migration/invasion/western blot assay with 1, 1.5, 2 μM SAG and in vivo effect of 2, 4, 8 mg/kg SAG in xenotransplantation model in nude mice.
Results
The key targets of SAG treatment for melanoma were mainly enriched in PI3K-AKT pathway, and the binding energy of SAG to PI3K, AKT, and mTOR were −6.33, −6.31, and −6.07 kcal/mol, respectively. SAG treatment inhibited the proliferation, migration, and invasion ability of A375 and A2058 cells (p < 0.05) with IC50 values of 2.378 μM and 2.719 μM, respectively. It also decreased the phosphorylation levels of FAK, PI3K, AKT, mTOR and protein expression levels of MMP2 and ICAM-2. In the nude mouse xenograft model, 2, 4, 8 mg/kg SAG was shown to be effective in inhibiting tumour growth.
Conclusions
Our research offered a theoretical foundation for the clinical antitumor properties of SAG, further suggesting its potential application in the clinic.
Introduction
Malignant melanoma is a major cause of death in individuals with cutaneous cancer. In the United States, melanoma is responsible for the 5th and 7th most common cancer among men and women, respectively (Siegel et al. Citation2021). The poor prognosis of this cancer can be ascribed to its ability to easily spread to distant organs and its resistance to conventional chemotherapies (Leiter et al. Citation2014; Lo and Fisher Citation2014). According to statistics, more than 90% of patients die from metastasis instead of original cancer, and the median survival and 5-year survival rate of inoperable metastatic melanoma are 6 months and less than 5%, respectively (Leong et al. Citation2012; Kurishima et al. Citation2014; Lo and Fisher Citation2014; Che et al. Citation2019). Therefore, considerable attention has been paid to the treatment strategy against the invasion of the basement membrane and the adhesion of tumour cells to matrix components for malignant melanoma (Fidler Citation2003).
Macleaya cordata (Wild.) R.Br. (Popaceae) is a perennial herb, mainly distributed in China, North America, and Europe (Lin et al. Citation2018). According to the records of Chinese herbal medicine works, Macleaya cordata is primarily used to treat skin cancer and body surface tumours, but also has some efficacy in cervical cancer and thyroid tumours (Xu et al. Citation1997). Sanguinarine (SAG) is one of the main active ingredients of Macleaya cordata and is the most abundant (Pi et al. Citation2008), it was used by North American Indians in combination with zinc chloride for cancer treatment as early as 1857 (Fell Citation1857). It is also widely used as a livestock feed additive and toothpaste additive to prevent bacterial infection (Vrublova et al. Citation2008; Hu et al. Citation2019; Laines-Hidalgo et al. Citation2022). In recent years, SAG has been reported to have an anticancer effect on a variety of cancer cells, including those of the lung (Prabhu et al. Citation2021), liver (Su et al. Citation2019), prostate (Rahman et al. Citation2019), etc. In addition, SAG exerts anti-angiogenic effects in vitro and in vivo (De Stefano et al. Citation2009). Of note, as the most abundant constituent of Macleaya cordata, SAG is shown to be effective against melanoma. For example, SAG inhibits the proliferation and induces the death of K1735-M2 cells via DNA and mitochondrial damage (Serafim et al. Citation2008). In human melanoma cells, SAG induces caspase- and reactive oxygen species-dependent cell death (Burgeiro et al. Citation2013). However, it is still unknown whether SAG has an effect on the migration and invasion of melanoma, and how it functioned.
To this end, the present study investigates the effect of SAG on the migration and invasion of melanoma by combining network pharmacology with in vitro and in vivo experiments. For the verification of the underlying mechanisms, A375 cells were employed to examine its effect on protein expression related to cell-Matrigel adhesion and Matrigel membrane invasion. It is found in this study that SAG can inhibit melanoma migration and invasion by targeting the FAK/PI3K/AKT/mTOR signalling pathway. The findings presented herein will lay a groundwork for further investigation of SAG and its containing herbal medicines.
Materials and methods
Drugs and reagents
SAG (>98%) was obtained from Shanghai Yuanye Bio-Technology Co., Ltd. (Shanghai, China). CCK8 Assay Kit and dimethyl sulfoxide (DMSO) were purchased from Sigma-Aldrich (St. Louis, MO, USA). SAG was dissolved in DMSO at a concentration of 10 mM as a stock solution and stored at −20 °C. DMEM medium and foetal bovine serum were purchased from Gibco Company (Gaithersburg, MD, USA). Matrigel was purchased from Shanghai Nova Pharmaceutical Technology Co., Ltd. (Shanghai, China). Transwell chambers were purchased from Corning Incorporated (USA). Antibodies against FAK, p-FAk, PI3K, p-PI3K, AKT, p-AKT, mTOR, p-mTOR, MMP2 and ICAM-1, were purchased from Santa Cruz Biotechnology, Inc. (USA).
Cell lines and culture conditions
The malignant melanoma cell lines A375 were purchased from Shanghai EK-Bioscience Biotechnology Co., Ltd. (Shanghai, China), and A2058 was purchased from Procell Life Science&Technology Co., Ltd. (Wuhan, China). The cell lines were grown in Dulbecco’s Modified Eagle Medium (DMEM) medium containing 10% foetal bovine serum and 1% P/S solution at 37 °C in a 5% CO2 humidified incubator.
CCK8 assay
A375 and A2058 melanoma cells were seeded in 96-well plates at 5 × 10⁴/mL in 100 μL of DMEM medium containing 10% FBS. After 24 h of incubation, 100 μL of SAG at different concentrations was added to the 96-well plates, and the plates were incubated for another 48 h. At the end of the incubation, the drug-containing medium was removed from the wells, and then 100 μL of fresh DMEM and 10 μL of CCK8 were mixed and added to each well, followed by incubation for 4 h. The OD value of each well was measured at 450 nm with a microplate reader (BioTeck, Synergy H1 Hybrid, USA).
Flow cytometric
Following treatment with different concentrations of SAG for 48 h, cells were collected, centrifuged at 200 g for 5 min and washed twice with PBS. Then, the cells were labelled with FITC-conjugated annexin-V and propidium iodide (PI). FITC-labelled and PI-labelled cells were measured by flow cytometric analyses.
Wound healing assay
Cells cultured in 6-well plates were wounded with a 200 μL pipette tip and incubated with serum-free medium containing different concentrations of SAG for 48 h, and the media was changed every day. The distance between the cells located at one edge of the linear defect and those located at the opposite edge of the defect was determined after 0, 24, and 48 h of incubation.
Invasion assay
The invasion assay was performed in a 24-well plate with Matrigel-coated polycarbonate membrane inserts. Cells were resuspended in a serum-free medium containing SAG final concentrations of 1, 1.5, and 2 μM, and the cell density was adjusted to 2.5 × 10⁵/mL. To each upper chamber, 200 μL of cells were added, and to the bottom chambers, a medium containing 15% FBS was added. After 24 h of incubation, the upper chambers were cleaned with a cotton swab, the cells were stained using crystal violet for 10 min, and the invaded cells were counted using a microscope in 5 random fields.
Matrigel cell adhesion assay
A375 and A2058 cells were cultured with SAG at different concentrations for 24 h and then collected and seeded at 5000 cells per well in 96-well plates coated with Matrigel for 2 h. Then, non-adherent cells were removed by washing twice with PBS. To each well, 100 μL MTT (1 mg/mL) was added and incubated for 4 h. The supernatant was decanted, 150 μL DMSO was added to each well, and the absorbance at 450 nm was read on a microplate reader (BioTeck, Synergy H1 Hybrid, USA).
Acquisition of relevant targets and data analysis
Generic names and Canonical SMILES for components are provided by Pubchem (https://pubchem.ncbi.nlm.nih.gov/). Potential targets of SAG are derived from Swiss TargetPrediction (http://www.swisstargetprediction.ch/) and the melanoma-associated target is derived from GeneCards (https://www.genecards.org/). Venn diagrams of SAG targets and melanoma targets were constructed using VENNY2.1 (https://bioinfogp.cnb.csic.es/tools/venny/). For further data mining, KEGG pathway analysis and GO enrichment analysis was conducted. Gene Ontology (GO) functional enrichment analysis and Kyoto Encyclopaedia of Genes and Genomes (KEGG) pathway enrichment analysis of potential therapeutic target genes was performed using the DAVIDV6.8 database (http://david.ncifcrf.gov), and visualization of the analyzed data through bubble plots. Cytoscape 3.8.0 software was used to build the component-target-pathway network. Adjust the node size and transparency according to the Degree value. The common targets of SAG and melanoma were imported using the String database, and then the protein interaction network was analyzed using the Cytoscape 3.8.0 program to generate the PPI network.
Molecular docking
The SDF structure files of SAG were retrieved from the PubChem website (http://pubchem.ncbi.nlm.nih.gov/), and the related protein structures PIK3 (PDBID:1e8w), AKT (PDBID:2uzw2), mTOR (PDBID:7pec) were retrieved from the Protein Data Bank (http://www.rcsb.org/pdb) database in 3D crystal structures. Molecular docking of SAG with some core targets was performed using AutoDock Vina 1.1.2, and the binding energy was scored. Using Pymol software to visualize and analyze results.
Western blot
A375 cells were collected after coculture with either 1–2 μM SAG or 0.5% DMSO culture medium for 48 h. The proteins in the cell lysates were separated by sodium dodecyl sulfate-polyacrylamide gel electrophoresis (SDS-PAGE), transferred to polyvinylidene difluoride membranes and exposed to the appropriate antibodies (Santa Cruz Biotechnology, Inc., Santa Cruz, USA) overnight. The blots were visualized by an enhanced chemiluminescence (ECL) method according to the recommended procedure using horseradish peroxidase-conjugated anti-rabbit or anti-mouse secondary antibody (Santa Cruz Biotechnology, Inc., Santa Cruz, USA). All experiments were repeated at least three times independently.
Animal model
All animal experiments were conducted in accordance with the European Community guidelines (EEC Directive of 1986; 86/609/EEC) and licenced by the Institution Animal Care Committee of Southwest Medical University (Permit Number: 20220805-002). BALB/c nude female mice (4 weeks old) were purchased from Chongqing Tengxin Biotechnology Co., Ltd. The effects of SAG on melanoma were tested using a nude A375 xenograft mouse model. Briefly, A375 cells were digested and diluted in PBS to 1 × 10⁷/mL. A375 cell suspension (0.2 mL) was injected into the middle of the armpit of female nude mice, and the tumour growth was monitored every day. After the tumour volume had reached 100 mm³, mice in the treatment group were injected with SAG (2, 4, 8 mg/kg) intraperitoneally, while animals in the control group were injected with PBS every day, and the experiment was finished after 14 injections. The body weights of the mice and tumour sizes were measured at the same time, and tumours were stained with immunohistochemistry (IHC) and haematoxylin-eosin (HE).
Immunohistochemistry and HE staining
The tumour tissues were fixed with 4% paraformaldehyde and encapsulated in paraffin wax before being sliced into 4 μm slices with a paraffin microtome. In accordance with the instructions of the immunohistochemistry kit, tumour sections were immunohistochemically stained with antibodies against phosphorylated FAK, phosphorylated PI3K (1:50), phosphorylated AKT (1:50), phosphorylated mTOR (1:50), and MMP2 (1:50), ICAM-1 (1:50). HE staining was conducted following deparaffinization of tissues, staining with haematoxylin and eosin, and fixing the tissues on slides with neutral resin.
Statistical analysis
All data are presented as the mean ± SD of at least three independent experiments. Comparisons between two groups were conducted using Student’s unpaired t-tests, and comparisons between multiple groups were conducted using one-way analysis of variances (ANOVAs). The data were analyzed using GraphPad Prism 9.3.1 software. Differences were considered statistically significant when p < 0.05.
Results
SAG inhibits the proliferation of A375 and A2058 cells
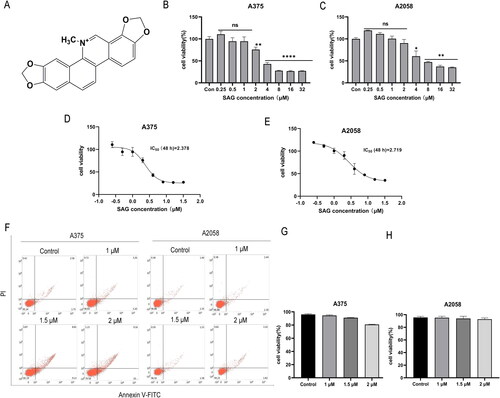
The effect of SAG () on the proliferation of the A375 and A2058 cell lines was investigated. Cells were incubated with different concentrations of SAG for 48 h. SAG (2–32 μM) significantly inhibited A375 cells as compared with the negative control, while the little effect on A375 cells was observed with 0.25–1 μM SAG (p > 0.05). For A2058 cells, potent inhibition was observed with 4–32 μM SAG (p < 0.01), with little cell inhibition seen at 0.25–2 μM SAG (p > 0.05) (). The half maximum inhibitory concentration (IC50) of SAG was determined using the CCK8 method. As shown in , the IC50 for A375 cells and A2058 cells was 2.378 and 2.719 μM, respectively. 1, 1.5, and 2 μM of SAG were used for subsequent experiments, because at these concentrations, SAG did not significantly influence cell growth, with cell viabilities of approximately 90%, 85% and 80%, respectively. The results of flow cytometric analysis also confirmed that these three concentrations of SAG did not significantly affect the viability of cells ().
Figure 1. (A) Chemical structure of SAG. (B and C) Effect of SAG on cell viability in A375 and A2058 cells. A375 and A2058 cells were treated with SAG for 48 h, and the 0.5% DMSO group was used as a control. (D and E) A375 and A2058 cells were treated with different concentrations of SAG or DMSO, and cell viability and the IC50 at 48 h were examined by CCK8 assay. (F-H) The results of flow cytometry showed there was no significant difference in the viability of the cells at each concentration of SAG. The data are shown as the mean ± SD of three independent experiments (*p < 0.05, **p < 0.01, as compared to the controls).
SAG- Melanoma-target network construction and core target screening
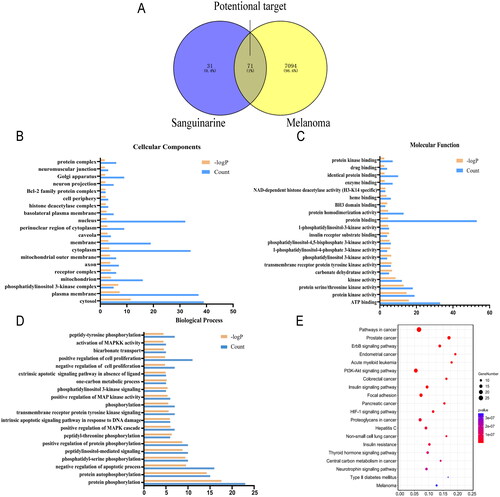
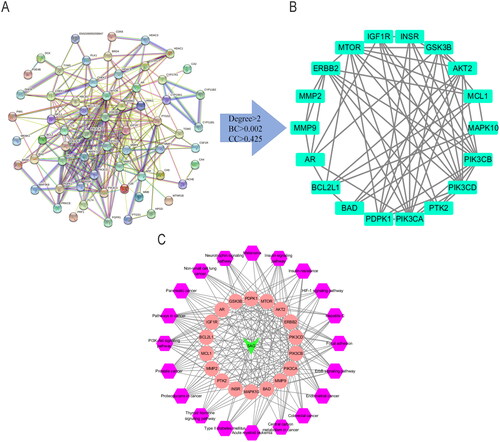
The potential therapeutic ability of SAG for melanoma was evaluated through network pharmacology. One hundred one potential targets for SAG and 7094 melanoma-related targets were separately collected from the Swiss TargetPrediction and GeneCards database, in which 71 targets were merged from Swiss TargetPrediction and GeneCards databases, and accordingly selected as candidate targets for SAG against melanoma. The PPI network of the 71 common targets of SAG and melanoma was established in the STRING database with a high confidence score (0.700), and included 85 nodes and 222 edges (). According to the screening threshold values of degree >2, betweenness-centrality >0.002, and closeness-centrality >0.425, 18 key targets were screened out, including MMP2, MMP9, MCL1, MTOR, ERBB2, PTK2 (FAK), PIK3CA, PIK3CB, PIK3CD, IGF1R, INSR, AR, GSK3B, BCL2L1, MAPK10, BAD, PDPK1 and AKT2 (). The PPI network of 18 core targets was constructed and included 18 nodes and 62 edges ().
Table 1. Degree, Betweenness and Closeness-Centrality values of each target.
GO and KEGG pathway enrichment analyses were executed by DAVID to elucidate the underlying mechanism of SAG against melanoma. The core targets highlighted in the GO analysis results were mainly related to the nucleus, cytoplasm and plasma membrane of cytoplasm in Cellular Components (CC) (), ATP binding, protein binding and protein kinase activity in Molecular Function (MF) (), and protein phosphorylation, protein autophosphorylation and negative regulation of apoptotic processes in Biological Process (BP) (). The main pathways are as follows: pathways in cancer, ErbB signalling pathway, insulin signalling pathway, PI3K-AKT signalling pathway and focal adhesion, etc. Pathways in cancer involved 26 genes, including GSK3B, PIK3CD, PIK3CB, IGF1R, AKT2, ERBB2, MMP2, MMP9, MTOR, PTK2, MAPK10, AR, PIK3CA, FGFR1 and BCL2L1. The ErbB signalling pathway involved 12 genes, including MAPK10, GSK3B, PIK3CA, BAD, AKT2, ERBB2, PIK3CD, PIK3CB, PTK2 and MTOR. Furthermore, according to the KEGG pathway enrichment analyses, the core targets that were associated with the previous analysis were also enriched, such as cancer, ErbB and PI3K-Akt signalling pathway (). Taking these results together, a compound-target-pathway network was constructed to holistically expound the underlying mechanism of SAG against melanoma.
Figure 2. Analysis of the melanoma-SAG-related targets and construction of the SAG-melanoma-target network: (A) The Venn diagram of SAG and melanoma intersection targets. (B-D) GO enrichment analysis of core target for SAG against melanoma. For (B) Cellular Components, (C) Molecular Function and (D) Biological Process, was shown in histograms. (E) Whole 20 enriched KEGG pathways of core targets for SAG against melanoma. The colour scales indicate the different thresholds of adjusted p-values, and the sizes of the dots represent the gene count of each term.
The C-T-P network was shown in , including 39 nodes (1 compound node, 18 target nodes, 20 pathway nodes) and 220 edges. The purple colour represents the pathways, pink the targets and green the SAG. The edges were used to indicate the correlation between different nodes. There are 26 genes associated with the PI3K-AKT signalling pathway, including GSK3B, BAD, INSR, PIK3CD, PIK3CB, MTOR, PTK2, IGF1R, PIK3CA, AKT2, BCL2, MCL1, FGFR1 and BCL2L1.
Figure 3. (A) The Protein-protein interaction (PPI) network of 71 common targets of SAG and Melanoma. (B, ) According to the screening threshold values of degree >2, betweenness-centrality >0.00212038 and closeness-centrality >0.425, 18 key targets were screened out. (C) The PPI network of 18 core targets was then constructed including 18 nodes and 62 edges.
Molecular docking of SAG with key molecular targets
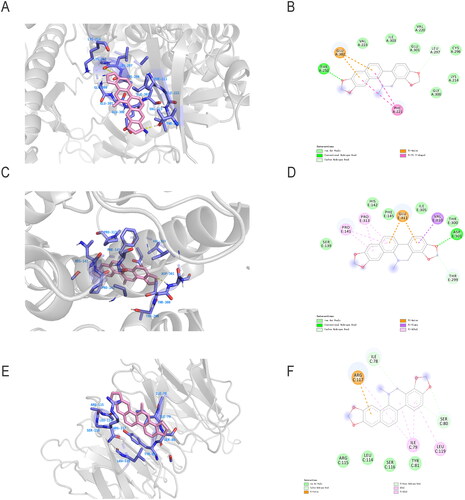
Since the top targets of the ‘component-target-pathway’ network, PIK3CA, PIK3CB, and PIK3CD, are regulatory subunits of PIK3 (Pridham et al. Citation2018), and AKT2 is a member of the AKT family (Pereira et al. Citation2015), it is conjectured that SAG may exert antitumor effects through the PI3K-AKT-mTOR pathway. To this end, molecular docking was used to test the interaction between SAG and the three targets. The results showed that SAG is bound to the active pocket of PI3K, AKT, and mTOR receptors. The binding energy value of SAG with PI3K was calculated using Autodock4.2.6 to be −6.33 kcal/mol, and its interaction residues were THR-232, GLU-302, and PHE221 (). As for SAG with AKT, its binding energy value was calculated to be −6.31 kcal/mol, and its interaction residues were GLU −331, PRO-313, PRO-141, VAL310, ASP-301 (). For SAG with mTOR, the binding energy was calculated to be −6.07 kcal/mol, and its interaction residues were ARG-117, ILE78, ILE-79, LEU-79, SER-80, LEU119 ().
Figure 4. Molecular docking of SAG with PI3K (A), AKT (C) and mTOR (E) receptors. Map of sites where SAG binds to the residues of (B) PI3K, (D) AKT and (F) mTOR receptors.
SAG impairs the adhesion ability of A375 and A2058 cells
A Matrigel cell adhesion assay was used to evaluate the effect of SAG on cell adhesion. A375 and A2058 cells were used for mutual verification. As shown in , melanoma cells adhering to Matrigel were significantly reduced after 48 h of SAG treatment. This illustrated that with an increase in SAG concentration, the adhesion rate of each group continuously decreased and different concentrations of SAG had a significant inhibitory effect on the cell stromal adhesion rate in A375 and A2058 cells.
SAG inhibits migration and invasion of A375 and A2058 cells
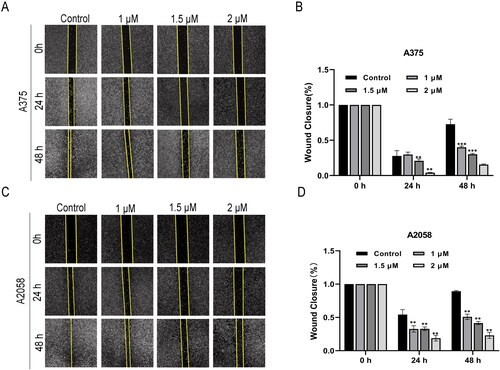
Migration and invasion are two important steps in tumour cell metastasis. Thus, the effect of SAG on melanoma cells migration was investigated. The wound healing assay showed that after culturing for 48 h, the number of A375 and A2058 cells entering the ‘wound area’ had increased with time. The results showed that SAG inhibited the migration of cells at all test concentrations (1, 1.5, and 2 μM). As shown in , the cells in the control group entered the wound area with time; however, in the SAG-treated group, the tendency of cells to enter the wound area was significantly inhibited.
Figure 5. (A-D) Effect of SAG on the migration of A375 and A2058 cells. The cells were cultured with different concentrations of SAG (0, 1, 1.5, 2 μM) for 48 h. Each scratch was photographed at 0 h, 24 h and 48 h. The histogram shows the closure rate of the scratches after 24 h and 48 h (*p < 0.05, ** p < 0.01, *** p < 0.001 as compared to the controls).
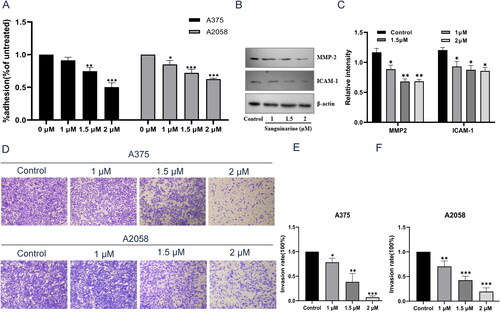
Invasion assays of A375 and A2058 cells were performed in a 24-well plate with Matrigel-coated polycarbonate membrane inserts. As shown in , this inhibitory effect on cell invasion increased gradually with the increase of SAG concentration. In combination with our previous findings, these results indicate that SAG has a strong cytotoxic effect on melanoma cells, suggesting that it not only has a strong antitumor potential against melanoma cells, but is also able to suppress the development of metastasis even at a very low dosage.
Figure 6. Effect of SAG on melanoma cell adhesion and invasion. (A) Effect of different concentrations of SAG on the adhesion ability of A375 and A2058 cells. (B and C) Effect of SAG on MMP2 and ICAM-1 protein expression in A375 cells. (D–F) SAG significantly reduced the numbers of A375 and A2058 cells that invaded through the membrane as compared to the controls. The results shown here are representative of three independent experiments (*p < 0.05, **p < 0.01, ***p < 0.001 as compared to the controls).
Metastasis-related protein expression
Adhesion to Matrigel and invasion are of importance in tumour metastasis (Li et al. Citation2022). Based on our findings, SAG could suppress melanoma cell metastasis by inhibiting adhesion, migration and invasion. To clarify the molecular mechanism of this phenomenon, the expression of two metastasis-related proteins was studied to evaluate the metastatic abilities of A375 and A2058 human melanoma cells. In the progression of tumours, matrix metallopeptidase 2 (MMP2) plays an important role, since it can degrade collagen type IV, which is a major component of basement membranes (Wang T et al. Citation2021). Intercellular cell adhesion molecule-1 (ICAM-1) is an important cell surface adhesion molecule that belongs to the immunoglobulin superfamily. Generally, these genes are not expressed or are rarely expressed in normal human tissues, but in tumour tissues, they are often overexpressed (Benedicto et al. Citation2017; Kong et al. Citation2018). Therefore, based on our findings, MMP2 and ICAM-1 might be the key target of SAG in regulating tumour cell adhesion and invasion of melanoma (Gho et al. Citation2001; Struglics and Hansson Citation2012). Compared with the control group, the expression of MMP2 and ICAM-1 decreased significantly after 1, 1.5, and 2 μM SAG treatment for 48 h ().
SAG suppressed FAK-PI3K-AKT-mTOR pathway
Cancer invasion and metastasis are highly associated with FAK (Chen et al. Citation2016; Neoh et al. Citation2017; He C et al. Citation2019). To clarify the targets of SAG involved in the inhibition of migration and invasion, western blotting analysis was performed to determine the regulatory effect of SAG on FAK. Compared with the control group, the expression of FAK and p-FAK was significantly decreased after 1, 1.5, and 2 μM SAG effects for 48 h, and the suppression was especially robust (). FAK phosphorylation (Tyr397) was decreased by over 50% with 2 μM of SAG compared to the control group.
Figure 7. SAG reduces A375 cell metastasis by down-regulating the FAK/PI3K/AKT/mTOR signalling pathways. (A-C) Western blotting assays were used to assess the effect of SAG on FAK and p-FAK (Tyr397). (D) The whole cell extract was harvested to detect p-PI3K/PI3K, p-AKT/AKT and p-mTOR/mTOR proteins by Western blot. (E-G) The histogram shows the relative protein expression of p-PI3K/PI3K, p-AKT/AKT and p-mTOR/mTOR in different groups quantified and normalized against β-actin bars, standard deviation (*p < 0.05, **p < 0.01, ***p < 0.001, as compared to the controls).
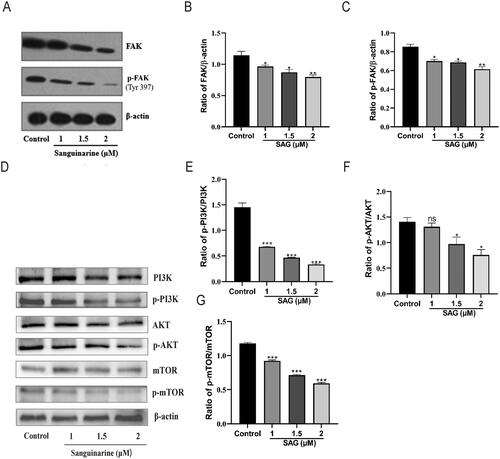
Network pharmacology and molecular docking results suggest that the anti-melanoma activity of SAG may be related to PI3K, AKT, and mTOR targets. To confirm whether SAG acts on the FAK-PI3K-AKT-mTOR signalling pathway, a western blotting assay was conducted as shown in , compared to the control group, the expressions of p-PI3K, p-AKT and p-mTOR were notably decreased in the SAG treatment group (p < 0.05).
SAG inhibited the growth of melanoma cells in vivo
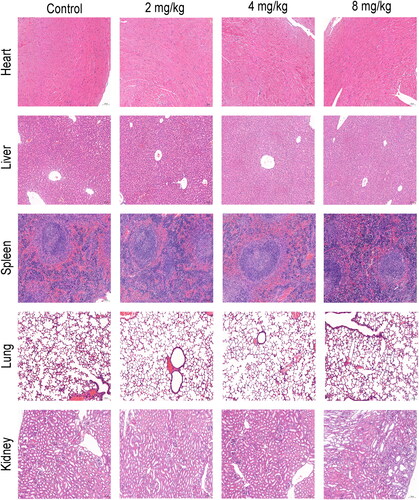
To investigate whether SAG has consistent anti-melanoma effects, in vitro and in vivo validation tests were conducted. As illustrated in , tumour growth was suppressed by increasing concentrations of SAG, while the body weight of mice did not fluctuate significantly. According to IHC analysis, the protein expression of p-FAK, p-PI3K, p-AKT, p-mTOR, ICAM-1, and MMP2 was reduced in mouse tumour tissues, which corroborates with the in vitro experiment observations. By HE staining, the organ conditions of the administered and model groups were found to be comparable, suggesting that there were no significant adverse effects ().
Figure 8. SAG inhibited the growth of A375 cells in vivo. (A) The timeline for the mouse in vivo experimental details. (B and C) Nude mice were injected with different concentrations of SAG and tumour volumes were measured daily. Compared with the control group, the SAG-treated group significantly inhibited tumour growth. (D) The body weight of the mice was weighed daily, and there was no significant difference between the body weight of the SAG-treated group and the control group. (E and F) p-FAK, p-PI3K, p-AKT, p-mTOR, MMP2 and ICAM-1 were detected by immunohistochemistry, the expression levels were downregulated with the increasing SAG levels (*p < 0.05, **p < 0.01, ***p < 0.001, as compared to the controls).
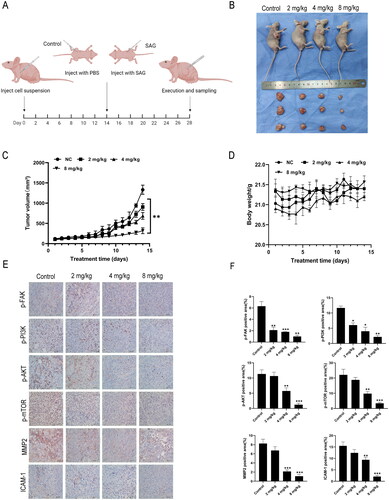
Figure 9. Mice with tumours were treated with SAG, and heart, liver, spleen, lung, and kidney tissue were stained with haematoxylin-eosin (HE). In both groups, there were no significant abnormalities in HE staining, and there was no difference between the treatment and control groups.
Discussion
Herbal medicines are a natural treasure trove of bioactive compounds valued by oncology drug R&D scientists (Zhang HQ et al. Citation2021). Numerous studies have demonstrated that many herbal active components play a crucial role in controlling tumour progression (Yan et al. Citation2017; He J et al. Citation2020; Wang Y et al. Citation2020). A few plant-derived compounds (e.g., paclitaxel and camptothecin) have been developed to be the first-line antitumor drug. As reported, both SAG and its original herb Macleaya cordata show potential anticancer effect towards melanoma, though the mechanisms are not completely clear. This provides an important clue for the current study.
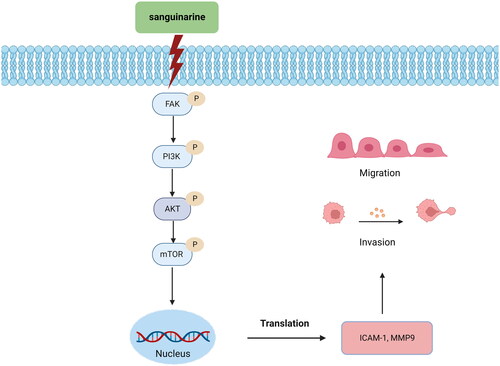
There are a number of sequential steps in the spread of tumour cells from the primary neoplasm to distant organs. Among them, the activities of basement membrane invasion, tumour cell adhesion to matrix components and tumour angiogenesis are considered to be the three most important aspects of tumour metastasis. By using network pharmacology and molecular docking simulation, the current study demonstrated that SAG significantly inhibited the adhesion and invasion abilities of A375 and A2058 cells (), in particular, the protein expression levels of metastasis-associated MMP2 and ICAM-1 (), suggesting the involvement of FAK signalling pathway. FAK is a non-receptor tyrosine kinase that is involved in many biological processes, such as cell survival, migration, and cancer cell invasion (Fan et al. Citation2016; Zhou et al. Citation2019). Activated FAK binds and phosphorylates the regulatory subunit of PI3K, which in turn subsequently activates AKT via phosphorylation (Flamini et al. Citation2017). The AKT family contains serine/threonine protein kinases, which are involved in the growth and survival of tumour cells in several types of cancer, among which the prominent one is the regulation of tumour migration (Xue and Hemmings Citation2013). FAK is over-expressed in the majority of melanoma cells, and it can also induce the secretion of MMP2 and ICAM-1, which play an important role in tumour cell adhesion and invasion in melanoma cells (Sein et al. Citation2000; Yasuda et al. Citation2001; Lu et al. Citation2018). For these reasons, FAK is considered a diagnostic marker of tumour invasion and metastasis, and the regulation of FAK may be a new strategy for melanoma therapy. Consistent with these results, Zhang W et al. (Citation2013) found that galangin inhibited B16F10 melanoma metastasis both in vivo and in vitro by suppressing the expression and activation of FAK. Nishibaba et al. (Citation2012) also proposed phosphorylated FAK as a target for the treatment of melanoma. Based on the results of the present study, it is suggested that SAG can reduce FAK protein levels, as well as FAK phosphorylation activity (Tyr397), which ultimately reduces downstream PI3K, p-PI3K, AKT, p-AKT, mTOR, p-mTOR protein levels, the potential molecular mechanism is shown in . This may contribute to the effect of SAG on the metastatic growth of A375 and A2058 cells.
Figure 10. Schematic diagram of the mechanism of SAG inhibition of melanoma migration and invasion.
The results of animal experiments demonstrated that SAG has a potent inhibitory effect against tumour growth in vivo. Based on immunohistochemistry analysis, SAG significantly downregulated the expression of p-FAK, p-PI3K, p-AKT, p-MTOR, ICAM-1 and MMP2 proteins. Considering that the FAK-PI3K-AKT-mTOR pathway contributes to tumour migration and invasion, SAG could have an anti-metastatic potential against melanoma. Nevertheless, this in vivo experiment was conducted over a short period of time (14 days), and no tumour metastasis was observed in mice. In light of this, it is still unclear whether SAG will have an effect on the xenograft metastasis of melanoma in nude mice. To clarify the issue of SAG anti-melanoma metastasis, further study by tail vein injections of tumour cells for moulding is needed.
In clinical practice, mutations in BRAF are reported in approximately half of all melanoma cases. Selective targeting of BRAF and its downstream substrate MEK inhibitors have improved the prognosis of patients with BRAF-mutated melanoma, but their efficacy is impaired by intrinsic and acquired drug resistance. By contrast, activation of the PI3K/AKT pathway is crucial in mediating the resistance of melanoma cells to BRAF inhibitors. Therefore, our study confirms that SAG may serve as a potential candidate for resistance to BRAF and MEK inhibitors.
In addition to the FAK-PI3K-AKT-mTOR signalling pathway, SAG is reported to be against melanoma through other molecular signalling pathways, suggesting the concerted contribution to the action of SAG. Interestingly, it has been reported that structural analogues of SAG from Macleaya cordata, including chelerythrine, chelidonine, and chelilutine have potent anticancer activities. For example, chelerythrine inhibits the metastasis of hepatocellular carcinoma via PI3K/Akt/mTOR (Zhu et al. Citation2018); chelidonine inhibits the growth of gefitinib-resistant non-small cell lung cancer cells via the EGFR-AMPK pathway (Xie et al. Citation2020); chelilutine induces apoptosis by reducing the levels of anti-apoptotic proteins (Bcl-xL, Mcl-1, XIAP) (Slunská et al. Citation2010). This suggests that different alkaloids in Macleaya cordata might contribute to the overall anticancer effect via multiple molecular mechanisms.
Conclusions
We have demonstrated that the bioactive alkaloid from Macleaya cordata, SAG, could be a promising anti-metastatic agent in the treatment of melanoma. SAG regulates the adhesion and migration of melanoma by targeting FAK and its phosphorylation. Further study is needed to clarify the action mechanism of SAG against melanoma with a more suitable animal model. The findings add new information about the therapeutic potential of Macleaya cordata as well as other SAG-containing herbal medicines.
Author contributions
M. Lü and S. Liang designed the study and checked the data. X. Qi, Y. Chen and S. Liu performed the experimental work and conducted original data analysis. Li. Liu provided the experimental assistance. X. Qi and Y. Chen wrote the first draft of the manuscript. M. Lü and S. Liang provided their valuable guidance and suggestions. Y. Chen and S. Liang revised the manuscript. X. Qi, M. Lü and S. Liang were responsible for funding acquisition. The manuscript has been read and approved by all the authors and each author believes that the manuscript represents honest work.
Acknowledgments
This work was supported by the National Natural Science Foundation (81672458, 82003850), the Grants from the Science and Technology Planning Project of Sichuan Province (2021JDTD0003, 2022NSFSC0576,2022YFS0631,2022YFS0626, 2022YFS0625), the Sichuan Province Post Doctoral Fund Special Assistance Program (202027),the Science and Technology Cooperation Project of Gulin County People's and Hospital and Southwest Medical University Affiliated Hospital (2022GLXNYDFY12),Suining First People's Hospital Southwest Medical University Cooperation Project (2022SNXNYD02), Office of science & technology and talent work of Luzhou (2022-JYJ-138) and the Youth Program of Southwest Medical University (2021ZKQN098).
Disclosure statement
No potential conflict of interest was reported by the author(s).
Correction Statement
This article was originally published with errors, which have now been corrected in the online version. Please see Correction (http://dx.doi.org/10.1080/13880209.2023.2210885).
References
- Benedicto A, Romayor I, Arteta B. 2017. Role of liver ICAM-1 in metastasis. Oncol Lett. 14(4):3883–3892.
- Burgeiro A, Bento AC, Gajate C, Oliveira PJ, Mollinedo F. 2013. Rapid human melanoma cell death induced by sanguinarine through oxidative stress. Eur J Pharmacol. 705(1-3):109–118.
- Che G, Huang B, Xie Z, Zhao J, Yan Y, Wu J, Sun H, Ma H. 2019. Trends in incidence and survival in patients with melanoma, 1974-2013. Am J Cancer Res. 9:1396–1414.
- Chen JS, Li HS, Huang JQ, Dong SH, Huang ZJ, Yi W, Zhan GF, Feng JT, Sun JC, Huang XH. 2016. MicroRNA-379-5p inhibits tumor invasion and metastasis by targeting FAK/AKT signaling in hepatocellular carcinoma. Cancer Lett. 375(1):73–83.
- De Stefano I, Raspaglio G, Zannoni GF, Travaglia D, Prisco MG, Mosca M, Ferlini C, Scambia G, Gallo D. 2009. Antiproliferative and antiangiogenic effects of the benzophenanthridine alkaloid sanguinarine in melanoma. Biochem Pharmacol. 78(11):1374–1381.
- Fan T, Chen J, Zhang L, Gao P, Hui Y, Xu P, Zhang X, Liu H. 2016. Bit1 knockdown contributes to growth suppression as well as the decreases of migration and invasion abilities in esophageal squamous cell carcinoma via suppressing FAK-paxillin pathway. Mol Cancer. 15:23.
- Fell JW. 1857. A Treatise on Cancer: and Its Treatment. Stirling, America: Franklin Classics Trade.
- Fidler IJ. 2003. The pathogenesis of cancer metastasis: the 'seed and soil’ hypothesis revisited. Nat Rev Cancer. 3(6):453–458.
- Flamini MI, Uzair ID, Pennacchio GE, Neira FJ, Mondaca JM, Cuello-Carrión FD, Jahn GA, Simoncini T, Sanchez AM. 2017. Thyroid hormone controls breast cancer cell movement via integrin αV/β3/SRC/FAK/PI3- kinases. Horm Cancer. 8(1):16–27.
- Gho YS, Kim PN, Li HC, Elkin M, Kleinman HK. 2001. Stimulation of tumor growth by human soluble intercellular adhesion molecule-1. Cancer Res. 61(10):4253–4257.
- He C, Chen ZY, Li Y, Yang ZQ, Zeng F, Cui Y, He Y, Chen JB, Chen HQ. 2019. miR-10b suppresses cell invasion and metastasis through targeting HOXA3 regulated by FAK/YAP signaling pathway in clear-cell renal cell carcinoma. BMC Nephrol. 20(1):127.
- He J, Yin P, Xu K. 2020. Effect and molecular mechanisms of traditional Chinese medicine on tumor targeting tumor-associated macrophages. Drug Des Devel Ther. 14:907–919.
- Hu NX, Chen M, Liu YS, Shi Q, Yang B, Zhang HC, Cheng P, Tang Q, Liu ZY, Zeng JG. 2019. Pharmacokinetics of sanguinarine, chelerythrine, and their metabolites in broiler chickens following oral and intravenous administration. J Vet Pharmacol Ther. 42(2):197–206.
- Kong DH, Kim YK, Kim MR, Jang JH, Lee S. 2018. Emerging roles of vascular cell adhesion molecule-1 (VCAM-1) in immunological disorders and cancer. IJMS. 19(4):1057.
- Kurishima K, Kagohashi K, Ohara G, Miyazaki K, Kawaguchi M, Takayashiki N, Satoh H. 2014. Skin metastasis from small cell lung cancer. Tuberk Toraks. 62(2):147–150.
- Laines-Hidalgo JI, Muñoz-Sánchez JA, Loza-Müller L, Vázquez-Flota F. 2022. An update of the sanguinarine and benzophenanthridine alkaloids’ biosynthesis and their applications. Molecules. 27(4):1378.
- Leiter U, Eigentler T, Garbe C. 2014. Epidemiology of skin cancer. In: Reichrath J, editor. Sunlight, Vitamin D and Skin Cancer. New York, NY: Springer New York; p. 120–140.
- Leong SP, Mihm MC, Jr., Murphy GF, Hoon DS, Kashani-Sabet M, Agarwala SS, Zager JS, Hauschild A, Sondak VK, Guild V, et al. 2012. Progression of cutaneous melanoma: implications for treatment. Clin Exp Metastasis. 29(7):775–796.
- Li W, Mao Y, Hua B, Gu X, Lu C, Xu B, Pan W. 2022. Sasanquasaponin inhibited epithelial to mesenchymal transition in prostate cancer by regulating the PI3K/Akt/mTOR and Smad pathways. Pharm Biol. 60(1):1865–1875.
- Lin L, Liu YC, Huang JL, Liu XB, Qing ZX, Zeng JG, Liu ZY. 2018. Medicinal plants of the genus Macleaya (Macleaya cordata, Macleaya microcarpa): a review of their phytochemistry, pharmacology, and toxicology. Phytother Res. 32(1):19–48. [InsertedFromOnine]
- Lo JA, Fisher DE. 2014. The melanoma revolution: from UV carcinogenesis to a new era in therapeutics. Science. 346(6212):945–949.
- Lu CT, Leong PY, Hou TY, Huang SJ, Hsiao YP, Ko JL. 2018. Ganoderma immunomodulatory protein and chidamide down-regulate integrin-related signaling pathway result in migration inhibition and apoptosis induction. Phytomedicine. 51:39–47.
- Neoh CA, Wu WT, Dai GF, Su JH, Liu CI, Su TR, Wu YJ. 2017. Flaccidoxide-13-acetate extracted from the soft coral Cladiella kashmani reduces human bladder cancer cell migration and invasion through reducing activation of the FAK/PI3K/AKT/mTOR signaling pathway. Molecules. 23(1):58.
- Nishibaba R, Higashi Y, Su J, Furukawa T, Kawai K, Kanekura T. 2012. CD147-targeting siRNA inhibits cell-matrix adhesion of human malignant melanoma cells by phosphorylating focal adhesion kinase. J Dermatol. 39(1):63–67.
- Pereira L, Horta S, Mateus R, Videira MA. 2015. Implications of Akt2/Twist crosstalk on breast cancer metastatic outcome. Drug Discov Today. 20(9):1152–1158.
- Pi G, Ren P, Yu J, Shi R, Yuan Z, Wang C. 2008. Separation of sanguinarine and chelerythrine in Macleaya cordata (Willd) R. Br. based on methyl acrylate-co-divinylbenzene macroporous adsorbents. J Chromatogr A. 1192(1):17–24.
- Prabhu KS, Bhat AA, Siveen KS, Kuttikrishnan S, Raza SS, Raheed T, Jochebeth A, Khan AQ, Chawdhery MZ, Haris M, et al. 2021. Sanguinarine mediated apoptosis in non-small cell lung cancer via generation of reactive oxygen species and suppression of JAK/STAT pathway. Biomed Pharmacother. 144:112358.
- Pridham KJ, Le L, Guo S, Varghese RT, Algino S, Liang Y, Fajardin R, Rodgers CM, Simonds GR, Kelly DF, et al. 2018. PIK3CB/p110β is a selective survival factor for glioblastoma. Neuro Oncol. 20(4):494–505.
- Rahman A, Pallichankandy S, Thayyullathil F, Galadari S. 2019. Critical role of H(2)O(2) in mediating sanguinarine-induced apoptosis in prostate cancer cells via facilitating ceramide generation, ERK1/2 phosphorylation, and Par-4 cleavage. Free Radic Biol Med. 134:527–544.
- Sein TT, Thant AA, Hiraiwa Y, Amin AR, Sohara Y, Liu Y, Matsuda S, Yamamoto T, Hamaguchi M. 2000. A role for FAK in the concanavalin A-dependent secretion of matrix metalloproteinase-2 and -9. Oncogene. 19(48):5539–5542.
- Serafim TL, Matos JA, Sardão VA, Pereira GC, Branco AF, Pereira SL, Parke D, Perkins EL, Moreno AJ, Holy J, et al. 2008. Sanguinarine cytotoxicity on mouse melanoma K1735-M2 cells–nuclear vs. mitochondrial effects. Biochem Pharmacol. 76(11):1459–1475.
- Siegel RL, Miller KD, Fuchs HE, Jemal A. 2021. Cancer statistics, 2021. CA Cancer J Clin. 71(1):7–33.
- Slunská Z, Gelnarová E, Hammerová J, Táborská E, Slaninová I. 2010. Effect of quaternary benzo[c]phenanthridine alkaloids sanguilutine and chelilutine on normal and cancer cells. Toxicol in Vitro. 24(3):697–706.
- Struglics A, Hansson M. 2012. MMP proteolysis of the human extracellular matrix protein aggrecan is mainly a process of normal turnover. Biochem J. 446(2):213–223.
- Su Q, Fan M, Wang J, Ullah A, Ghauri MA, Dai B, Zhan Y, Zhang D, Zhang Y. 2019. Sanguinarine inhibits epithelial-mesenchymal transition via targeting HIF-1α/TGF-β feed-forward loop in hepatocellular carcinoma. Cell Death Dis. 10(12):939.
- Vrublova E, Vostalova J, Vecera R, Klejdus B, Stejskal D, Kosina P, Zdarilova A, Svobodova A, Lichnovsky V, Anzenbacher P, et al. 2008. The toxicity and pharmacokinetics of dihydrosanguinarine in rat: a pilot study. Food Chem Toxicol. 46(7):2546–2553.
- Wang T, Zhang Y, Bai J, Xue Y, Peng Q. 2021. MMP1 and MMP9 are potential prognostic biomarkers and targets for uveal melanoma. BMC Cancer. 21(1):1068.
- Wang Y, Zhang Q, Chen Y, Liang CL, Liu H, Qiu F, Dai Z. 2020. Antitumor effects of immunity-enhancing traditional Chinese medicine. Biomed Pharmacother. 121:109570.
- Xie YJ, Gao WN, Wu QB, Yao XJ, Jiang ZB, Wang YW, Wang WJ, Li W, Hussain S, Liu L, et al. 2020. Chelidonine selectively inhibits the growth of gefitinib-resistant non-small cell lung cancer cells through the EGFR-AMPK pathway. Pharmacol Res. 159:104934.
- Xu G, Wang Q, Yu B, Pan M. 1997. Coloured illustrations of antitumour Chinese traditional and herbal drugs. Fuzhou, China: Fujian Science and Technology Press.
- Xue G, Hemmings BA. 2013. PKB/Akt-dependent regulation of cell motility. J Natl Cancer Inst. 105(6):393–404.
- Yan Z, Lai Z, Lin J. 2017. Anticancer properties of traditional Chinese medicine. Comb Chem High Throughput Screen. 20:423–429.
- Yasuda M, Tanaka Y, Tamura M, Fujii K, Sugaya M, So T, Takenoyama M, Yasumoto K. 2001. Stimulation of beta1 integrin down-regulates ICAM-1 expression and ICAM-1-dependent adhesion of lung cancer cells through focal adhesion kinase. Cancer Res. 61(5):2022–2030.
- Zhang W, Tang B, Huang Q, Hua Z. 2013. Galangin inhibits tumor growth and metastasis of B16F10 melanoma. J Cell Biochem. 114(1):152–161.
- Zhang HQ, Xie XF, Li GM, Chen JR, Li MT, Xu X, Xiong QY, Chen GR, Yin YP, Peng F, et al. 2021. Erianin inhibits human lung cancer cell growth via PI3K/Akt/mTOR pathway in vitro and in vivo. Phytother Res. 35(8):4511–4525.
- Zhou J, Yi Q, Tang L. 2019. The roles of nuclear focal adhesion kinase (FAK) on cancer: a focused review. J Exp Clin Cancer Res. 38(1):1–11.
- Zhu Y, Pan Y, Zhang G, Wu Y, Zhong W, Chu C, Qian Y, Zhu G. 2018. Chelerythrine inhibits human hepatocellular carcinoma metastasis in vitro. Biol Pharm Bull. 41(1):36–46.