
Abstract
Context
Current chemotherapeutic drugs cannot meet the treatment needs of patients with nasopharyngeal carcinoma (NPC), so urgent action is needed to discover novel chemotherapeutic agents. Our previous study revealed that garcinone E (GE) inhibited the proliferation and metastasis of NPC, suggesting that the compound might display promising anticancer activity.
Objective
To examine the mechanism underlying the anti-NPC activity of GE for the first time.
Materials and methods
For MTS assay, NPC cells were treated with 2.5-20 μmol/L GE or dimethyl sulfoxide for 24, 48, and 72 h. Colony formation capacity, cell cycle distribution, and in vivo xenograft experiment of GE were assessed. MDC staining, StubRFP-sensGFP-LC3 observation, LysoBrite Blue staining, and immunofluorescence examined the autophagy of NPC cells after GE exposure. Western blotting, RNA-sequencing, and RT-qPCR measured protein and mRNA levels.
Results
GE suppressed cell viability with an IC50 of 7.64, 8.83 and 4.65 μmol/L for HK1, HONE1 and S18 cells. GE inhibited colony formation and cell cycle, increased autophagosome number, and inhibited the autophagic flux partially by blocking lysosome-autophagosome fusion, and repressed S18 xenograft growth. GE dysregulated the expression of autophagy- and cell cycle-related proteins such as Beclin-1, SQSTM1/p62, LC3, CDKs, and Cyclins. Bioinformatics GO and KEGG pathway enrichment analysis of RNA-seq showed that autophagy was enriched in differentially expressed genes upon GE treatment.
Discussion and conclusion
GE acts as an autophagic flux inhibitor, which may have potential chemotherapeutic use for NPC treatment and may have an application in basic research to explore the mechanisms of autophagy.
Introduction
Nasopharyngeal carcinoma (NPC) is a malignant epithelial tumour of the head and neck. NPC has a high incidence rate in southeast Asia, southern China, and north Africa (Zhou et al. Citation2021). Lesions of NPC are located in the center of the head and often invade the adjacent parapharyngeal space, the bone of the skull base, and cranial nerves; thus, surgery is difficult to perform. Radical radiotherapy is the first option in the early stage of NPC (Luo et al. Citation2012). However, more than 50% of the patients are already in advanced stages (stage III-IV of NPC according to the American Joint Committee on Cancer classification) at the time of a certain diagnosis. To effectively improve the therapeutic outcomes of NPC, chemotherapy (concurrent chemoradiotherapy, adjuvant chemotherapy, and induction chemotherapy) has been included in the treatment system of NPC (Chen et al. Citation2019). Nevertheless, the 5-year survival rate of NPC patients after concurrent chemoradiotherapy is still unsatisfactory at only about 70% (Blanchard et al. Citation2015). Many patients with NPC cannot be cured because of resistance to radiotherapy and chemotherapy, local recurrence, or distant metastasis. Platinum-containing chemotherapy is the first choice for most patients with recurrent and metastatic NPC; however, there is a lack of standard second-line salvage treatment, and the median overall survival is only about one year if the first-line platinum-containing chemotherapy fails. Hence, searching for new and efficacious chemotherapeutic candidates to improve the treatment outcomes and quality of life for patients with advanced NPC is an urgent need.
Autophagy is a conserved intracellular degradative pathway for maintaining the homeostasis of cells by gathering organelles and cellular proteins in autophagosomes which subsequently fuse with lysosomes for lysosomal degradation. The dysfunction of autophagy is associated with accelerated ageing and various human diseases such as cancer, cardiovascular and neurodegenerative disorders (Schneider and Cuervo Citation2014; Lopez-Otin and Kroemer Citation2019). Autophagy plays a controversial role in cancer, but cumulative studies verify that autophagy is over-activated in a number of human cancers, protecting cancer cells against chemotherapy and radiotherapy (Kimmelman and White Citation2017). Thus, inhibition of protective autophagy has been considered a potential cancer treatment strategy (Amaravadi et al. Citation2019). It is important to find novel autophagy inhibitors that can act as tool compounds or clinical chemotherapeutic agents (Thu et al. Citation2021).
Garcinia mangostana L. (Clusiaceae), generally known as mangosteen, is one of the most famous tropical fruits cultivated in tropical Asia and Africa (Pedraza-Chaverri et al. Citation2008; Hu et al. Citation2021). Mangosteen was reportedly used for the treatment of inflammation, skin and wound infection, cholera, diarrhea, and dysentery (Taher et al. Citation2016). The major secondary metabolites in the hull of mangosteen are prenylated and oxygenated xanthones (Suksamrarn et al. Citation2002), and over 68 xanthones could be obtained from mangosteen fruit (Chin and Kinghorn Citation2008). Xanthones have been confirmed to have biological functions such as anticancer (Winter et al. Citation2013), antibacterial (Chukaew et al. Citation2019), antioxidant (Li et al. Citation2018; Tran et al. Citation2021), antimicrobial (Araújo et al. Citation2019), and anti-inflammatory activities (Mohan et al. Citation2018). Some well-studied xanthones with outstanding anticancer activities are gambogic acid, mangiferin, α-mangostin, β-mangostin, and γ-mangostin. For example, in phase IIa anticancer clinical trials for advanced cancers, gambogic acid showed a certain anticancer activity with mild side effects (Chi et al. Citation2013). Numerous studies revealed that gambogic acid promoted cancer cell apoptosis, regulated autophagy, blocked cell cycle, inhibited cancer stem cells, inhibited angiogenesis, inhibited cell migration and invasion, and synergized with chemotherapeutic drugs to achieve its anticancer functions (Chen et al. Citation2015). Moreover, studies showed that gambogic acid regulated tumour progression through autophagy. In the early stage of treatment, gambogic acid activated c-Jun N-terminal kinase and induced autophagy, while in the late stage of treatment, it inhibited autophagy due to the activation of caspases (Ishaq et al. Citation2014). Garcinone E, a xanthone, can be extracted and isolated from the hull of mangosteen. Our previous study revealed that garcinone E reduced the viability and migration and invasion potential of NPC cells by modulating the epithelial-mesenchymal transition process (Kong et al. Citation2018). It was reported that garcinone E suppressed cell migration and invasion in ovarian cancer and cervical carcinoma (Xu et al. Citation2017; Yang et al. Citation2020). In addition, several published studies showed that garcinone E had in vitro cytotoxic activity in some cancer cell lines (Ho et al. Citation2002; Mohamed et al. Citation2017). Although the anticancer activity of garcinone E has been reported (Ho et al. Citation2002; Mohamed et al. Citation2017), its underlying mechanism still needs to be further explored. In the present study, we evaluated the activity of garcinone E against NPC through assays of cell viability, colony formation, cell cycle, and autophagy. This is the first time that garcinone E has been reported as an autophagic flux inhibitor with anticancer activity in NPC.
Materials and methods
Extraction and isolation of garcinone E
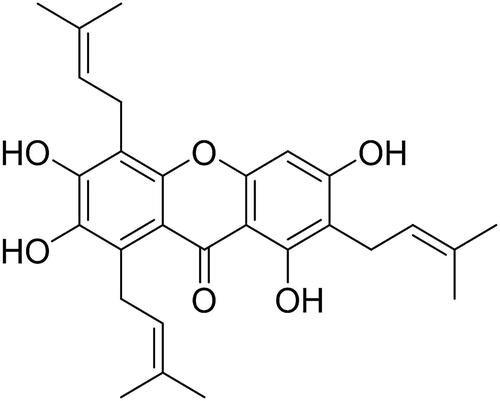
The fruits of Garcinia mangostana were purchased from the Jintou Market of Nanning, Guangxi, China in February and July 2017, and characterized by associate professor Xiaomei Wei, an expert from Guangxi Botanical Garden of Medicinal Plants. Samples of the fruit hulls were deposited in the Museum of Traditional Chinese Herbal Specimens, Guangxi Medical University and our lab. The herbarium number is NN-SZ-170712. The fruit hulls were air-dried and powdered. Our previous study introduced the extraction and isolation method of sub-fractions A-J in detail (Xia et al. Citation2018). Sub-fraction D was further eluted by silica gel column chromatography (CCl3-MeOH-H2O, 100:3:1). Then, fraction 5 was purified by the Rp-C18 column and eluted using 85% MeOH. The fraction was purified by Sephadex LH-20 column chromatography, employing methanol, to obtain garcinone E. The purity of garcinone E was determined by electron spray ionization mass spectrometry and 1H and 13C nuclear magnetic resonance (NMR) spectra. Garcinone E (; C28H32O6, yellow powder, purity exceeded 98%): ESIMS: m/z 465.4 [M + H]+, 463.5 [M − H]−. 1H-NMR (500 MHz, DMSO-d6): δ 13.88 (1H, s, 1-OH), 6.46 (1H, s, H-4), 5.20 (1H, m, H-12), 5.18 (2H, m, H-17, 22), 3.98 (2H, d, J = 6.8 Hz, H-11), 3.21 (2H, d, J = 8.0 Hz, H-21), 3.36 (2H, d, J = 8.0 Hz, H-16), 1.63 − 1.73 (CH3×6, s, H-14, 15, 19, 20, 24, 25). 13C NMR (125 MHz, DMSO-d6): δ 161.8 (C-1), 111.4 (C-2 and 8a), 163.5 (C-3), 93.3 (C-4), 112.3 (C-5), 147.3 (C-6), 135.2 (C-7), 125.9 (C-8), 183.9 (C-9), 150.9 (C-10a), 155.9 (C-4a), 25.9 (C-14 and 19), 123.9 (C-12, 22), 132.1 (C-13), 18.4 (C-15),131.7 (C-18 and 23), 124.4 (C-17), 103.9 (C-9a), 29.4 (C-11), 15.5 (C-16 and 21), 15.5 (C-24), 18.2 (C-20), 17.9 (C-25). Garcinone E was dissolved in absolute dimethylsulfoxide (DMSO) (D2650, Sigma-Aldrich, St. Louis, MO, USA) to a concentration of 20 mmol/L to be used as a stock solution.
Figure 1. Garcinone E chemical structure.
Cell culture
Three cell lines of human NPC, HK1, HONE1 and S18, were gifts of Dr. Chao‑Nan Qian from the Department of Nasopharyngeal Carcinoma, Sun Yat-sen University Cancer Center (Guangzhou, Guangdong, China). Cells were cultured in Dulbecco’s modified Eagle’s medium (DMEM) (319-006-CL, Wisent corporation, Nanjing, China) with 10% fetal bovine serum (FBS) (10099141, Gibco BRL, Grand Island, NY, USA), penicillin, and streptomycin (15140122, Thermo Fisher Scientific, Waltham, MA, USA). All cell culture dishes were placed in a humidified 5% CO2 incubator at 37 °C.
Cell viability assay
MTS assay (CellTiter 96 Aqueous One Solution Cell Proliferation Assay, G3581, Promega Madison, WI, USA) was performed to analyze the cytotoxicity of garcinone E in NPC cells. Cells were plated at 1000 cells/well in 96-well plates. Then, cells were treated with 2.5, 3.75, 5, 7.5, 10, 15, and 20 µmol/L of garcinone E for 24, 48, and 72 h or 10 µmol/L chloroquine (CQ; C6628, Sigma-Aldrich, Darmstadt, Germany) for 72 h. Assays were performed by adding 20 µL of MTS directly to each well and incubating for 2 h. The results were obtained by recording the absorbance at 490 nm with a microplate reader (Multiskan GO, Thermo Fisher Scientific, USA).
Colony formation assay
HK1 cells were seeded at 200 cells/well in 6-well plates and treated with 2.5, 3.75, and 5 µmol/L of garcinone E for 12 days. HONE1 cells were seeded at 300 cells/well in 6-well plates and treated with 2.5, 3.75, and 5 µmol/L of garcinone E for 11 days. S18 cells were seeded at 300 cells/well in 6-well plates and treated with 1.25, 2.5, and 3.75 µmol/L of garcinone E for 9 days. Old culture media was replaced every 3 days with fresh media containing different concentrations of garcinone E or DMSO. Subsequently, colonies were fixed with 4% paraformaldehyde (P1110, Solarbio, Beijing, China), stained with crystal violet (G1063, Solarbio), washed with deionized water, and dried. The plates were scanned using CanonScan 9000 F (Canon, Tokyo, Japan) to record the colony numbers.
Cell cycle analysis
Cell cycle distribution was detected by flow cytometry using CytoFLEX (Beckman Coulter Life Science, Miami, FL, USA). Cells were plated at 3.2 × 10⁵ cells/dish in 6 cm dishes. 7.5, 10, and 12.5 µmol/L of garcinone E or DMSO or 10 µmol/L CQ were used to treat HK1 and HONE1 cells for 24 h. Propidium iodide (PI; CCS012, Multi Sciences, Hangzhou, China) was used to stain the harvested cells. Data were analyzed using the ModFit LT software (Verity Software House Inc., Topsham, ME, USA).
Monodansylcadaverine staining
Monodansylcadaverine (MDC) staining (30423, Sigma-Aldrich) was used to label autophagosomes and other acidic compartments. HK1 and HONE1 cells were seeded at 7.5 × 10³ cells/well into 24-well plates for fluorescence microscope observation, or 6 × 10⁴ cells/dish into 6 cm plates for flow cytometry detection. Positive control groups were treated with two kinds of autophagosome inducers: 0.5 µmol/L of rapamycin (Rapa; V900930, Sigma-Aldrich) or 10 µmol/L of CQ. Treatment groups were incubated with 5 and 10 µmol/L of garcinone E for 48 h, followed by treatment with 50 µmol/L MDC for 30 min in the dark. Finally, the cells were collected and analyzed by flow cytometry or observed with a confocal microscope (TCS SP8, Leica, Wetzlar, Germany).
StubRFP-SensGFP-LC3 lentivirus transfection and autophagic flux detection
HK1, HONE1 and S18 cells were seeded into 48-well culture plates to 20–30% confluence and were transfected with lentiviruses expressing the StubRFP-sensGFP-LC3 fusion protein (POSE3829, Genechem, Shanghai, China). After 20 h of transfection, the virus-containing medium was replaced by DMEM with 10% FBS. To observe the autophagic flux, transfected cells were seeded at 7.5 × 10³ cells/well into 24-well plates and incubated with 0, 5, 7.5, and 10 µmol/L garcinone E and 10 µmol/L CQ or 0.5 µmol/L Rapa for 48 h. The cells were fixed in 4% polymethoxaldehyde for 20 min. Subsequently, the cells were stained by DAPI after washing with PBS. Fluorescent photos were photographed by a confocal microscope.
LysoBrite Blue staining
To analyze the co-localization of autophagosomes and lysosomes, HK1-stubRFP-sensGFP-LC3 and HONE1-stubRFP-sensGFP-LC3 cells were cultured at 7.5 × 10³ cells/well in 24-well plates. Cells were incubated with 0, 5, and 10 μmol/L garcinone E or 0.5 μmol/L Rapa for 48 h. To evaluate the lysosomes, the cells were stained with LysoBrite Blue (22642, AAT Bioquest, Sunnyvale, CA, USA) at 37 °C for 1.5 h and then analyzed under a fluorescence microscope (BX53, Olympus, Tokyo, Japan). While autophagosomes glowed green, lysosomes glowed blue.
Immunofluorescence
NPC cells were seeded on coverslips in 24-well plates at 7.5 × 10³ cells/well. After treatments, the cells were fixed in 4% paraformaldehyde for 20 min, permeabilized with 0.1% Triton X-100 (P0096, Beyotime) for 30 min and blocked with 5% BSA for 1 h at room temperature. Next, cells were incubated with primary antibody (1:1000), galectin-3 (sc-32790; Santa Cruz Biotechnology, CA, USA) or LC3B (#3868, CST) overnight at 4 °C and incubated with Alexa Fluor secondary antibody (1:1000, A-21422 or A-11008, Invitrogen, CA, USA) for 1 h and DAPI. The cells were observed with a confocal microscope.
Western blotting
NPC cells were seeded on coverslips in 10 cm dishes at 8 × 10⁵ cells/dish. The cells were incubated with 0, 5, 7.5, and 10 µmol/L garcinone E for 24 h, washed with DPBS, and lysed in RIPA lysis buffer (R0278, Sigma-Aldrich) supplemented with 1× Protease and Phosphatase Inhibitor Cocktail (P1045, Beyotime, Shanghai, China). The BCA protein assay kit (23227, Pierce, Rockford, IL, USA) was used to determine protein concentrations. Equal amounts of protein were separated by 12% SDS-PAGE gels (C520001, Sangon Biotech, Shanghai, China) for electroblotting and subsequently transferred onto polyvinylidene difluoride (PVDF, ISEQ00010, Merck, Millipore, Billerica, MA, USA) membranes. PVDF membranes were blocked with 5% non-fat milk at room temperature, incubated with primary antibody at 4 °C overnight, and subsequently incubated with secondary antibody at room temperature for 1 h. The following antibodies from Cell Signalling Technology, Beverly, MA, USA were used: p21 (#2947), p27 (#3686), CDK2 (#2546), CDK4 (#12790), CDK6 (#3136), CDK7 (#2916), Cyclin A2 (#4656), Cyclin D3 (#2936), Cyclin E1 (#4129), Cyclin E2 (#4132), Akt (#4691), p-GSK-3β (#5558), 4E-BP1 (#9644), p-4E-BP1 (Thr37/46) (#2855), p-4E-BP1 (Thr70) (#9455), Non-p-4E-BP1 (Thr46) (#4923), p70 S6K (#2708), p-p70 S6K (Thr421/Ser424) (#9204), DNA Polymerase γ (#13609), Met (#8198), Optineurin (#58981), MCM2 (#3619), MCM3 (#4003), Stat3 (#9139), DKK1 (#4687), SirT1 (#8469), IKKα (#2682), Rac1/2/3 (#2465), Rpb1 CTD (#2629), p38 MAPK (#8690), c-Jun (#9165), MEK1/2 (#4694), LC3B (#3868), SQSTM1/p62 (#5114), PIK3R4 (#14580), Beclin-1 (#3495), ULK1 (#8054), Atg3 (#3415), Atg5 (#8540), Atg7 (#8558), Atg12 (#4180), Atg16L1 (#8089), Anti-mouse IgG (#7076) and Anti-rabbit IgG (#7074). The dilution of primary antibody was 1:1000 and the dilution of secondary antibody was1:5000. GAPDH (1:10000) was used as an internal reference for protein loading and analysis. Thermo Scientific Pierce ECL solution (Rockford, NY, USA) and MiniChemiTM Chemiluminescence imager (Sage Creation, Beijing, China) were used to detect and analyze the protein bands.
RNA sequencing
HK1 and HONE1 cells were seeded at 1.92 × 10⁶ cells/flask into 175 cm2 culture flasks. Sixteen hours later, the culture media was replaced with 0, 5, and 10 µmol/L of garcinone E in fresh media, and the cells were incubated for another 24 h. RNA was extracted with 2 mL TRIzol (15596026, Thermo Fisher Scientific), and samples were sent to Novogene (https://www.novogene.com/) for further analysis. The experiment was performed in triplicate. mRNAs with polyA tail were amplified using Oligo(dT). NEBNext® Ultra™ RNA Library Prep Kit for Illumina® was used in library construction. The insert size of the library was identified using Agilent 2100 bioanalyzer. Illumine sequencing was carried out when the quality of the library was up to standard. Finally, analyses of RNA-seq profiles, GO functional enrichment analysis, and KEGG pathway enrichment analysis was performed.
Screening of the differentially expressed genes
Following the quantitative analysis of gene expression by RNA-seq, statistical analysis of the expression data was needed to screen significantly differentially expressed genes of samples in different states. DESeq2 (Love et al. Citation2014) was adopted to conduct the difference analysis. The criteria were set as |log2(Fold Change)| > 0 and adjusted p ≤ 0.05. Thereafter, Venn diagrams were drawn to show the overlapping up and downregulated genes.
GO functional enrichment and KEGG pathway enrichment analyses
Cluster Profile software was used for the GO functional enrichment analysis and KEGG pathway enrichment analyses. The GO analysis was composed of biological process (BP), cellular component (CC), and molecular function (MF). KEGG was a comprehensive database that consisted of genome chemistry and system function information. The functional enrichment and pathway enrichment results were to meet the criterion of adjusted p < 0.05.
Real-time quantitative polymerase chain reaction
Real-time quantitative polymerase chain reaction (RT-qPCR) was performed to detect the mRNA expression of AKT1, BECN1, SQSTM1, and MAP1LC3B in HK1 and HONE1 cells. HK1 and HONE1 cells were seeded at 8 × 10⁵ cells/dish into 10-cm dishes. Total RNA was extracted using TRIzol. Total cDNA was produced using PrimeScript RT Reagent Kit with gDNA Eraser (RR047A, Takara Biomedical Technology, Beijing, China). mRNA expression levels were quantified using PowerUp SYBR Green Master Mix (A25742, Thermo Fisher Scientific). All data were analyzed using GAPDH as the internal standard. The following primer pairs were used:
GAPDH forward 5′-CAGCCTCAAGATCATCAGCAAT-3′ and
GAPDH reverse 5′-AGTCCTTCCACGATACCAAAGT-3′;
AKT1 forward 5′-GTGACCATGAACGAGTTTGAGT-3′ and
AKT1 reverse 5′-TCTTGAGGATCTTCATGGCGTA-3′;
BECN1 forward 5′-AGATGCACAGTTGGATAATGTGG-3′ and
BECN1 reverse 5′-CAGTTTTCAGACTGCAGCAAATC-3′;
SQSTM1 forward 5′-GCAATGGGCCTGTGGTAG-3′ and
SQSTM1 reverse 5′-CCCGAAGTGTCCGTGTTT-3′;
MAP1LC3B forward 5′-GAACGATACAAGGGTGAGAAGC-3′ and
MAP1LC3B reverse 5′-TGAGCTGTAAGCGCCTTCTAAT-3′.
Xenograft experiment
Female BALB/c nude mice (4-week-old) were purchased from the Hunan SJA Laboratory Animal Co., Ltd. (Changsha, China). Animal welfare and experimental procedures were adhered to by the Animal Care and Use Committee of Guangxi Medical University (Approval code: SYXK20200004). 3 × 10⁵ S18 cells in 150 μL PBS with 50 μL Matrigengel (0827065, ABW) were injected subcutaneously into the back of nude mice. All nude mice formed tumours four days after injecting, then 18 mice were randomly divided into three groups (n = 6 mice per group): vehicle group (63% ddH2O with 3% DMSO, 30% absolute ethyl alcohol, and 4% Tween-80), Cisplatin (2.5 mg/kg, Nuoxin, Hansoh Pharmaceutical Co. Jiangsu), and Garcinone E (35 mg/kg). Drugs were injected intraperitoneally into mice every three days. Mouse body weight and tumour size of the mice were measured every 3 days. The tumour volume (mm3) was calculated using the formula V = Length × Width2 × π/6. After the 18 day experimental period, mice were euthanized by CO2 asphyxiation, and their tumours were separated and weighed.
Statistical analysis
Statistical analysis was done by SPSS 26.0 software (SPSS Inc., Chicago, IL, USA). The numeric data of the in vitro experiments are presented as mean ± standard deviation (SD) from triplicate independent experiments performed in a parallel manner. Statistical analysis of multiple group comparisons was performed by one-way analysis of variance (ANOVA) followed by LSD test. p < 0.05 was regarded as significant. p < 0.01 and p < 0.001 were also noted. The homogeneity of variances assumption for one-way ANOVA is acceptable when P-value >0.05. For in vivo experiments, the data are presented as mean ± standard error of the mean (SEM). One-way ANOVA and two-way ANOVA were used to analyze the possible differences among groups.
Results
Garcinone E significantly suppresses the viability of human NPC cells
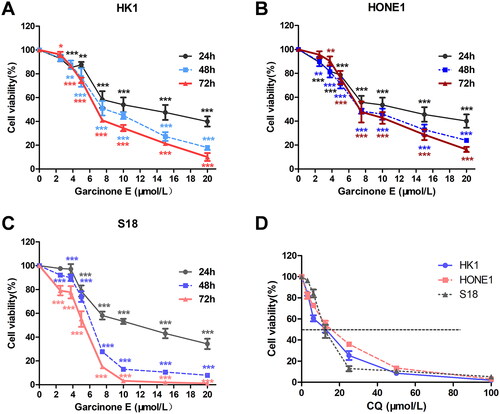
To demonstrate the effect of garcinone E on the viability of human NPC cells, the MTS assay was performed. The results indicated that garcinone E significantly inhibited the cell viability of HK1, HONE1 and S18 (). The cell viabilities of HK1, HONE1 and S18 reduced markedly after garcinone E treatment, and the IC50 (half‑maximal inhibitory concentration) values of 72 h of garcinone E were 7.64 ± 0.33 μmol/L, 8.83 ± 0.95 μmol/L, and 4.65 ± 0.95 μmol/L, respectively. CQ also significantly inhibited the proliferation of HK1, HONE1 and S18 cells (), and IC50 values of 72 h were 10.40 ± 0.68 μmol/L, 12.97 ± 0.59 μmol/L, and 13.28 ± 0.85 μmol/L, respectively.
Figure 2. Effect of garcinone E on the viability of human NPC cells. (A, B & C) HK1, HONE1 and S18 cells were incubated with gradient concentrations of garcinone E for 24, 48, and 72 h. (D) HK1, HONE1 and S18 cells were incubated with 10 μmol/L of chloroquine (CQ) for 72 h. Cell viability was assessed using MTS assays. *p < 0.05, **p < 0.01, and ***p < 0.001 vs. vehicle control, by one-way ANOVA and LSD test.
Garcinone E reduces the colony-forming capacity of human NPC cells
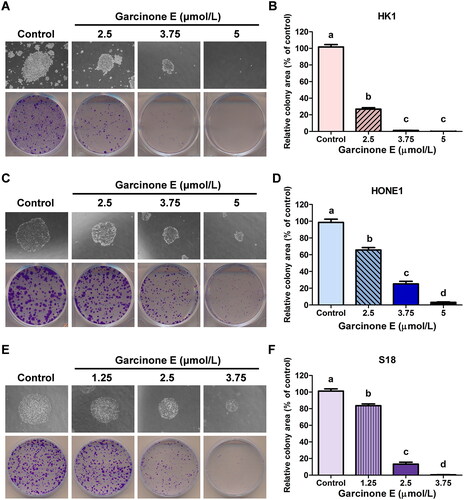
The role of garcinone E in the regulation of colony-forming capacity of human NPC cells was demonstrated, as shown in : the number and size of the forming colonies of HK1, HONE1 and S18 cells were markedly decreased with the increasing garcinone E concentrations. Statistical analysis confirmed that the relative colony areas of HK1 and HONE1 cells were accordingly decreased with increasing concentrations of garcinone E.
Figure 3. Effect of garcinone E on the colony-forming capacity of human NPC cells. (A, C & E) The colony formation of HK1, HONE1 and S18 cells treated with different concentrations of garcinone E. (B, D & F) Histogram of the relative colony area of HK1, HONE1 and S18 cells under different concentrations of garcinone E. The numeric data are shown as the mean ± SD from three independent experiments. Different lowercase letters above the columns indicate significant differences among groups (p < 0.05 by one-way ANOVA and LSD test).
Garcinone E induces cell cycle arrest in human NPC cells
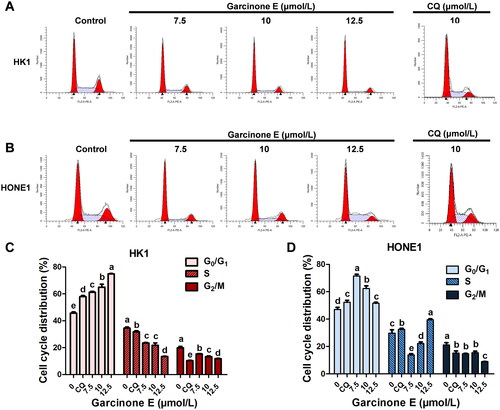
To confirm whether garcinone E affects the cell viability and colony-forming capacity by inducing cell cycle arrest in human NPC cells, HK1 and HONE1 cells were incubated with 0, 7.5, 10, and 12.5 μmol/L of garcinone E or 10 μmol/L of CQ for 24 h and then analyzed by flow cytometry. As shown in , garcinone E significantly induced HK1 cell cycle arrest at the G0/G1 phase. Garcinone E also induced HONE1 cell cycle arrest at the G0/G1 phase with 7.5 and 10 μmol/L treatments, while it induced arrest at the G0/G1 and S phases with 12.5 μmol/L treatment, compared with the DMSO-treated cells. CQ-induced HK1 cell cycle arrest at the G0/G1 phase. CQ also induced HONE1 cell cycle arrest at the G0/G1 phase and S phase.
Figure 4. Effect of garcinone E on the cell cycle progression of HK1 and HONE1. (A, B) HK1 and HONE1 cells were exposed to different concentrations (0, 7.5, 10, and 12.5 µmol/L) of garcinone E or 10 μmol/L of chloroquine (CQ) for 24 h. Cells were stained with PI, and the cell cycle distribution of HK1 and HONE1 cells was assessed using flow cytometry. (C, D) The bar chart showed the percentages of HK1 and HONE1 cells in the G0/G1, S, or G2/M phases of the cell cycle after exposure to garcinone E at a concentration of 0, 7.5, 10, and 12.5 μmol/L or 10 μmol/L of CQ for 24 h. The numeric data are shown as the mean ± SD from three independent experiments. Different lowercase letters above the columns indicate significant differences among groups (p < 0.05 by one-way ANOVA and LSD test).
Garcinone E increases the number of autophagosomes in human NPC cells
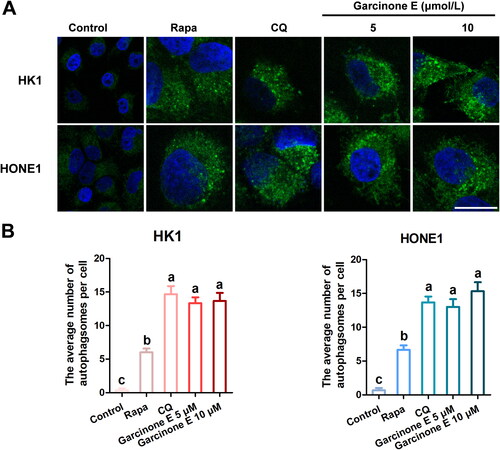
To explore the effect of garcinone E on the autophagy of human NPC cells, MDC staining was used to monitor the number of autophagosomes. HK1 and HONE1 cells were exposed to 5 and 10 μmol/L of garcinone E for 48 h. HONE1 and HK1 cells exposed to 0.5 μmol/L of Rapa or 10 μmol/L of CQ were used as positive controls. Flow cytometry results showed that the MDC fluorescence intensity of HK1 and HONE1 cells increased after garcinone E treatments in comparison with the DMSO-treated control group (). As shown in , there were a few autophagosomes in the DMSO-treated control group, while more autophagosomes were apparent in the positive control groups. With garcinone E treatment, the number of autophagosomes increased significantly, suggesting that garcinone E might be an autophagy modulator.
Figure 5. Effect of garcinone E on monodansylcadaverine (MDC) fluorescence intensity in HK1 and HONE1 cells. (A, B) HK1 and HONE1 cells were treated with DMSO or garcinone E (5 or 10 µmol/L) for 48 h. 10 µmol/L chloroquine (CQ)- and 0.5 µmol/L rapamycin (Rapa)-treated cells were used as positive controls. After MDC staining, the fluorescence intensity of 20 000 cells per sample was detected by flow cytometry. Right panel: fold changes of mean fluorescence intensity per cell (MFI) were calculated by dividing the MFI of treatment group by the MFI of vehicle control group. The numeric data are shown as the mean ± SD from three independent experiments. Different lowercase letters above the columns indicate significant differences among groups (p < 0.05 by one-way ANOVA and LSD test).
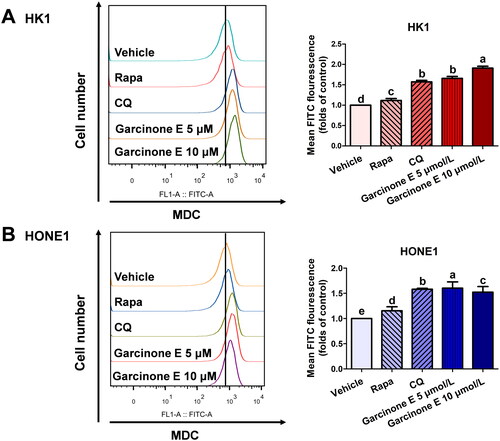
Figure 6. Effect of garcinone E on the number of autophagosomes in HK1 and HONE1 cells. (A) HK1 and HONE1 cells were treated with DMSO or garcinone E (5, 10 µmol/L) for 48 h. 10 µmol/L chloroquine (CQ)- and 0.5 µmol/L rapamycin (Rapa)-treated cells were used as positive controls. The autophagosomes appeared as green punctate pattern with MDC staining. Images were taken by a confocal microscope. Scale bar: 20 μm. (B) The average numbers of punctate autophagosomes per cell. The numeric data are shown as the mean ± SD from three independent experiments. Different lowercase letters above the columns indicate significant differences among groups (p < 0.05 by one-way ANOVA and LSD test).
StubRFP-SensGFP-LC3 lentivirus transfection and fluorescence detection suggests that garcinone E may block the autophagic flux in NPC cells
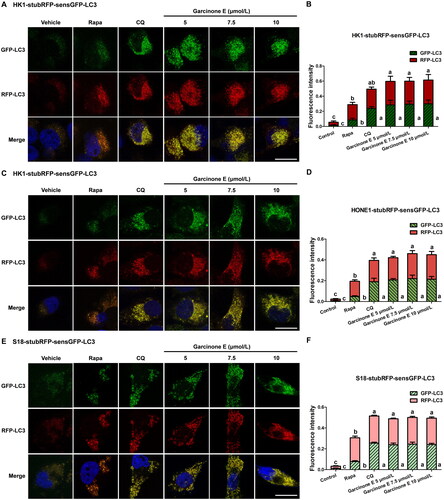
The MDC assay revealed that garcinone E increased the number of autophagosomes in NPC cells, which might be because of the upregulation of autophagy or the blockage of the autophagic flux in the late stage of autophagy. To explore the effect of garcinone E on the autophagic flux, the tandem StubRFP-SensGFP-LC3 plasmids were transfected into HK1, HONE1 and S18 cells. Confocal microscopy was used to monitor StubRFP (red fluorescence, indicated autophagosomes and autolysosomes) and SensGFP (green fluorescence, indicated only autophagosomes). The fusion of lysosomes with autophagosomes to form autolysosomes, reduced the environmental pH and lead to the quenching of the SensGFP fluorescence in the acidic environment. However, stable StubRFP is not affected by the acidic environment. Thus, red or green co-localized puncta aggregation can be used to evaluate the process of autophagy. When the autophagy process is normal and unobstructed, green autophagosomes are at a low level, and red puncta (autolysosomes + autophagosomes) can be detected. When the autophagy process is activated by promoting the formation of autophagosomes (for example, Rapa, an inducer of autophagosome formation theoretically), the green autophagosomes are increased; the red puncta (autolysosomes + autophagosomes) are more than green puncta; and the merged picture appeared as orange puncta. When the late-stage autophagy process is blocked by autophagosome-lysosome fusion blockage or the inhibition of autophagosome degradation (For example, CQ, an inhibitor of lysosome-autophagosome fusion), the green autophagosomes and red puncta are both observed and appeared as yellow puncta (illustrated autophagosomes). As can be seen in , compared with the vehicle control, Rapa treatment induced the number of green puncta, induced a larger number of red puncta than green puncta, and merged as orange puncta. Compared with the vehicle control and Rapa group, similar to the result of CQ treatment group, garcinone E significantly induced the appearance of more green puncta and red puncta; these puncta showed a large number of yellow puncta in HK1, HONE1 and S18 cells; the mean fluorescence intensity of the green puncta and red puncta was similar. These data suggested that garcinone E might impair the autophagic flux and inhibit the lysosomal degradation of autophagosomes.
Figure 7. Effect of garcinone E on the autophagic flux in NPC cells. (A, C & E) Fluorescence photographs of HK1, HONE1 and S18 cells transfected with the StubRFP-sensGFP-LC3 plasmid. Cells were treated with DMSO or garcinone E (5, 7.5, 10 µmol/L) in complete medium for 48 h. 0.5 µmol/L rapamycin (Rapa)-, 10 µmol/L chloroquine (CQ)- treated cells were used as positive controls. The microscopy photographs showed green autophagosomes (GFP-LC3), red autophagosomes and autolysosomes (RFP-LC3), blue nucleus (DAPI), or co-localized yellow autophagosomes (merge). Images were taken by a confocal microscope. Scale bar: 20 μm. (B, D & F) The average fluorescence intensity of green or red color in each group. The numeric data are shown as the mean ± SD from three independent experiments. Different lowercase letters above the columns indicate significant differences among groups (p < 0.05 by one-way ANOVA and LSD test).
Garcinone E induces lysosomes damage in NPC cells
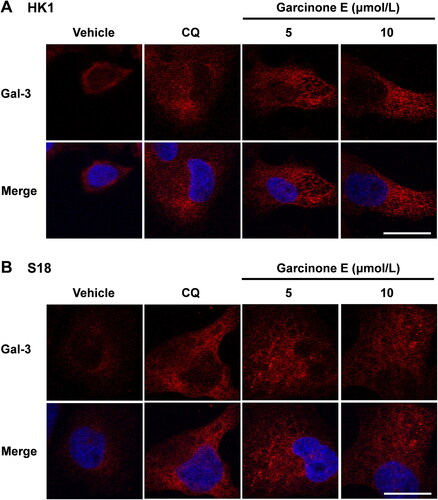
Galectin-3 (Gal-3), which can be found in both extracellular and intracellular, is recruited to damaged lysosomes and forms galectin-3 puncta (Hu et al. Citation2021). The damaged lysosomes as visualized by the translocation of cytosolic galectin-3 (Papadopoulos et al. Citation2017). To evaluate whether garcinone E impairs lysosomes, we monitored the damaged lysosomes by galectin-3 puncta. As shown in , the Gal-3-labeled damaged lysosomes were increased after CQ (positive control) or garcinone E treatments in HK1 and S18 cells. These results indicated that garcinone E induced lysosomes damage in NPC cells.
Figure 8. Effect of garcinone E on lysosome damage in HK1 and S18 cells. (A, B) Immunofluorescence images showed the fluorescence of galectin-3 antibody (red) in HK1 and S18 cells after treatment with DMSO, garcinone E (5 and 10 μmol/L), or 10 μmol/L chloroquine (CQ) for 48 h. Images were taken with a confocal microscope. Scale bar: 20 μm.
Garcinone E impairs the autophagic flux in NPC cells partially by blocking autophagosome-lysosome fusion
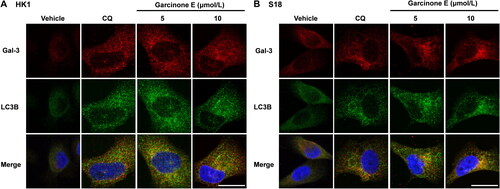
Detection of the autophagic flux with StubRFP-sensGFP-LC3 lentivirus transfection illustrated that garcinone E inhibited the lysosomal degradation of autophagosomes and blocked the autophagic flux. The fusion of autophagosomes and lysosomes plays a crucial role in the progress of the autophagic flux. To determine whether garcinone E affects the fusion of autophagosomes with lysosomes, we observed the co-localization of sensGFP-LC3 and LysoBrite Blue. LysoBrite Blue is a special blue fluorescent dye that can label lysosomes in living cells, while sensGFP-LC3 labels autophagosomes. In this study, as shown in , we found that the green and blue puncta in the Rapa group were completely co-localized. However, we can still see the green puncta in the merged picture of garcinone E treatment groups, suggesting that the autophagosomes (green puncta) and lysosomes (blue puncta) in the garcinone E treatment groups did not completely overlap. These results demonstrated that garcinone E blocked the autophagic flux partially by inhibiting the autophagosome-lysosome fusion in HK1 and HONE1 cells. Furthermore, as shown in , we also observed the co-localization of LC3B and galectin-3 by immunofluorescence assay. Immunofluorescence analysis showed that LC3-labeled green puncta and Gal-3-labeled red puncta were not completely co-localized in garcinone E treatment group, which was similar to the results in the CQ group (positive control), suggesting that garcinone E reduced the co-localization of LC3-labeled autophagosomes and Gal-3-labeled damaged lysosomes. These results indicated that garcinone E blocked autophagosome-lysosome fusion in NPC cells.
Figure 9. Effect of garcinone E on autophagosome-lysosome fusion in HK1 and HONE1 cells by co-localization analysis of sensGFP-LC3 and LysoBrite Blue. (A, B) Fluorescence photographs showed the co-localization of GFP-LC3 and LysoBrite Blue in human NPC cells. HK1-stubRFP-sensGFP-LC3 and HONE1-stubRFP-sensGFP-LC3 cells were treated with garcinone E (5 and 10 μmol/L) or 0.5 μmol/L rapamycin (Rapa) for 48 h and then stained with LysoBrite Blue. Autophagosomes present as green puncta, while lysosomes appear as blue puncta. The boxed regions in the left panels are enlarged in the right panel. Scale bar: 20 μm.

Figure 10. Effect of garcinone E on autophagosome-lysosome fusion in HK1 and S18 cells by immunofluorescence assay. (A, B) Immunofluorescence analysis of LC3B antibody (green) and galectin-3 (red) in HK1 and S18 cells treated with garcinone E (5 and 10 μmol/L) or chloroquine (CQ) (10 μmol/L) for 48 h. Images were taken with a confocal microscope. Scale bar: 20 μm.
Garcinone E modulates the expression of cell cycle-related and autophagy-associated proteins in human NPC cells
In view of the above changes in cell cycle and autophagy, the expression of cell cycle-related and autophagy-associated proteins in HK1 and HONE1 cells was detected with western blot. After 24 h of garcinone E exposure, the expression of cell cycle inhibitory proteins p21 and p27 were significantly higher compared with the vehicle control. Moreover, garcinone E significantly inhibited the expression of cell cycle regulatory proteins CDK2, CDK4, CDK6, CDK7, Cyclin A2, Cyclin D3, Cyclin E1, and Cyclin E2 (). This trend found for the effects of garcinone E on the expression levels of cell cycle-related proteins was consistent with the flow cytometry results that garcinone E arrested the cell cycle of NPC cells ().
Figure 11. Western blotting analysis of protein expression levels in HK1 and HONE1 cells treated with garcinone E. NPC cells were treated with garcinone E (5, 7.5, 10 µmol/L) for 24 h. The samples were analyzed by western blotting with the indicated antibodies. Representative blots were shown with GAPDH as a loading control. (A) Effect of garcinone E on cell cycle-related proteins in NPC cells. (B) Effect of garcinone E on autophagy-associated proteins in NPC cells. (C) Effect of garcinone E on some other key proteins of several key signalling pathways implicated in tumour progression. (D) No obvious trend was found for the effects of garcinone E on some other key proteins of several key signalling pathways implicated in tumour progression.
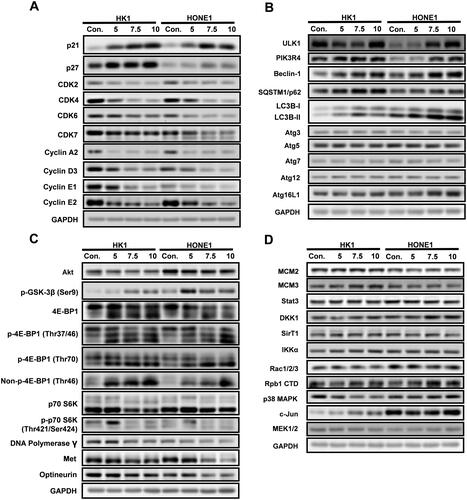
Meanwhile, as shown in , garcinone E significantly enhanced autophagy-associated proteins LC3B-I, LC3B-II, SQSTM1/p62, ULK1, PIK3R4, Beclin-1, and Atg16L1 in HK1 and HONE1 cells as the drug concentration increased. These results verified that garcinone E affected autophagy in NPC cells, which was consistent with the above results of autophagy detection. Additionally, we found that the expression levels of autophagy-associated proteins Atg3, Atg5, Atg7, and Atg12 were not affected by garcinone E.
We found that garcinone E affected some other key proteins of several key signalling pathways implicated in tumour progression. As shown in , our research implied that garcinone E treatment dramatically diminished the expression of Akt, p70 S6K, p-p70 S6K (Thr421/Ser424), DNA Polymerase, Met, and Optineurin, increased the expression of p-GSK-3β, and dysregulated the expression of 4E-BP1, p-4E-BP1(Thr37/46), p-4E-BP1(Thr70), and Non-p-4E-BP1(Thr46) in HK1 and HONE1 cells. No obvious trend was found for the effects of garcinone E on the protein levels of MCM2, MCM3, Stat3, DKK1, SirT1, IKKα, Rac1/2/3, Rpb1 CTD, p38 MAPK, c-Jun(60A8), and MEK1/2 (). The underlying molecular mechanisms of these dysregulated proteins remain to be further explored.
Garcinone E treatment changed the mRNA expression profiles of human NPC cells
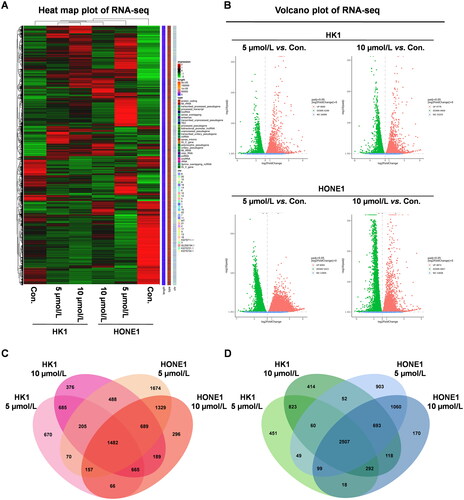
To further explore the anticancer mechanism of garcinone E in NPC cells, RNA sequencing (RNA-seq) was conducted. HK1 and HONE1 cells were exposed to 0, 5, and 10 μmol/L of garcinone E for 24 h, and RNA-seq was performed to screen the DEGs. As shown in , compared with the DMSO-treated HK1 and HONE1 cells, the mRNA expression of the cells treated with garcinone E was significantly altered. Heat maps and volcano plots are shown in . The overlapping genes of the two cell lines treated with 5 and 10 μmol/L of garcinone E were found, and a total of 3989 DEGs were identified (absolute fold change >1.0, p < 0.05), with 1482 upregulated genes () and 2507 downregulated genes ().
Figure 12. Filtering of differentially expressed genes (DEGs). HK1 and HONE1 cells were treated with 5 and 10 μmol/L garcinone E for 24 h. Heat maps (A) and Volcano plots (B) of DEGs. Venn diagrams of upregulated genes (C) and downregulated genes (D).
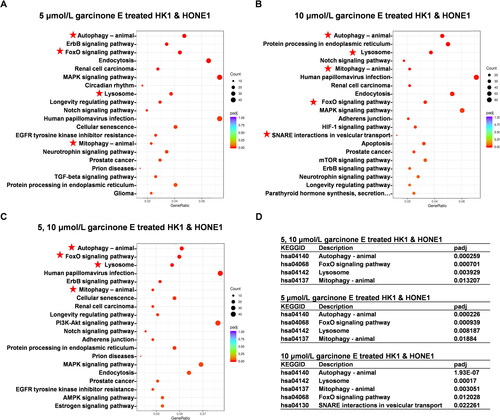
The GO and pathway enrichment analyses were carried out to reveal the overall roles of the altered gene expressions in response to garcinone E. The overlap of upregulated genes from HK1 and HONE1 cells treated with 5 μmol/L garcinone E was assigned as group 1, which included 1914 genes; 10 μmol/L as group 2, which included 3025 genes; and 5 and 10 μmol/L as group 3, which included 1482 genes, as mentioned above. Regarding the GO analysis, macroautophagy, autophagy, and processes utilizing the autophagic mechanism, which belonged to the biological process (BP), were significantly enriched in all three groups. Considering the cellular component (CC), the autophagosome and autophagosome membrane were annotated in all groups (). Pathway enrichment results indicated that the upregulated genes were mainly enriched in certain pathways such as mitophagy, lysosome, and autophagy in all groups (). Interestingly, independent of the pathway enrichments or GO terms, those related to autophagy were always enriched in each group.
Figure 13. Gene Ontology (GO) analysis of differentially expressed genes in HK1 and HONE1 cells. (A, B & C) The top 10 biological processes (BP), cellular component (CC), and molecular function (MF) of overlapped upregulated genes in each group were enriched.
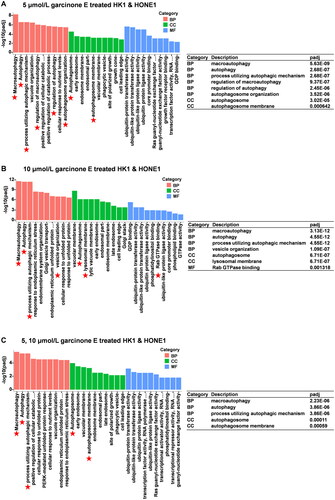
Figure 14. KEGG pathway enrichment of differentially expressed genes in HK1 and HONE1 cells. (A, B & C) The top 20 pathways of overlapped upregulated genes in each group were enriched. (D) The adjusted P value of partially significant KEGG pathways in each group.
Verification of DEGs in NPC cells by RT-qPCR
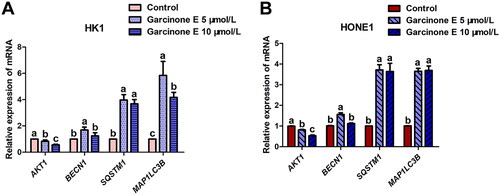
To confirm the RNA-seq data by RT-qPCR, we selected four DEGs associated with autophagy from the RNA-seq data, among which BECN1, SQSTM1, and MAP1LC3B were enhanced and AKT1 was diminished. The RT-qPCR verification result is shown in : the mRNA expression of Beclin-1, SQSTM1/p62 and LC3B was upregulated, and Akt was downregulated in HK1 and HONE1 cells, which was consistent with the results of RNA-seq and western blot.
Figure 15. Effect of garcinone E on mRNA expression of autophagy-associated genes in HK1 and HONE1 cells. (A, B) RT-qPCR analysis of AKT1, BECN1, SQSTM1, and MAP1LC3B mRNA levels in HK1 and HONE1 cells treated with garcinone E (0, 5, and 10 μmol/L) for 24 h. The numeric data are shown as the mean ± SD from three independent experiments. Different lowercase letters above the columns indicate significant differences among groups (p < 0.05 by one-way ANOVA and LSD test).
Garcinone E represses S18 nasopharyngeal carcinoma xenograft growth
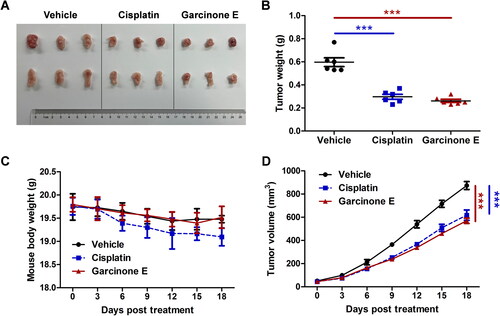
To verify the inhibitory effect of garcinone E on nasopharyngeal carcinoma cells in vivo, the nude mice were inoculated subcutaneously with S18 cells and injected garcinone E (35 mg/kg) or cisplatin (2.5 mg/kg) or vehicle every 3 days for up to 18 days. Compared to the vehicle group, the mouse body weight in the garcinone E-treated group was not significantly different, suggesting that garcinone E may not have severe side effects on nude mice (). As shown in , the weight and volume of tumours decreased significantly - similarly to cisplatin - in the garcinone E-treated group. These results indicated that garcinone E repressed S18 xenograft growth.
Figure 16. In vivo anti-cancer effects of garcinone E in S18 xenograft nude mice. The nude mice were inoculated subcutaneously with S18 cells and injected garcinone E (35 mg/kg) or cisplatin (2.5 mg/kg) or vehicle every 3 days. The treatment period lasted for 18 days. (A) The representative photo of S18 xenograft tumours at the end of treatment (n = 6). (B) Average tumour weight at the end of treatment. ***p < 0.001 by one-way ANOVA. (C) Average body weight of mice throughout the 18 days treatment. (D) Average tumour volume throughout the 18 days of treatment. ***p < 0.001 by two-way ANOVA. Data are expressed as mean ± SEM.
Discussion
In the present study, we extracted and isolated garcinone E, a xanthone, from the hull of G. mangostana. Xanthones as secondary metabolites are an important class of oxygenated heterocycles and have biological functions such as anticancer, antioxidant, hepatoprotective, antihypertensive, antithrombotic, antifungal, and monoamine oxidase inhibitor actions (Panda et al. Citation2013). Garcinone E exhibited cytotoxic effects against various cancer cell lines such as hepatocellular, ovarian, and cervical carcinoma cell lines (Ho et al. Citation2002; Xu et al. Citation2017; Yang et al. Citation2020), suggesting that garcinone E might be a potential chemotherapeutic agent for cancer treatment. Our previous study showed for the first time the anticancer function of garcinone E in NPC cells (Kong et al. Citation2018). This study demonstrated that garcinone E restrained the viability, colony-forming capacity, cell cycle, autophagic flux and lysosomal capacity of NPC cells in vitro and repressed NPC xenograft growth in vivo.
Autophagy is a dynamic process and plays a dual role in cells. In healthy cells, a high level of autophagy preserves the stability of the intracellular environment by phagocytosis and degradation of excess proteins and impaired organelles (Klionsky and Emr Citation2000) and inhibits cancer cell initiation. In the initial stage of tumour development, the level of autophagy is relatively low, and autophagy is generally considered a tumour suppressor mechanism. But later, during tumour progression, invasion, and metastasis, autophagy may play a protective role and be considered a tumour promoter by helping cancer cells fulfil their increased biosynthetic and metabolic needs (Farhan et al. Citation2020). Besides, autophagy may maintain and stimulate tumour growth later via providing energy substrates during a period of restricted nutrition or other stresses (Casimiro et al. Citation2017). Accumulating studies suggest that autophagy may be a target for cancer treatment, and autophagy inhibition may be an effective therapeutic strategy in cancer (Lao et al. Citation2014; Manic et al. Citation2014; Shao et al. Citation2014; Amaravadi et al. Citation2019; Dickson Citation2019; Zhang et al. Citation2019). There are many novel autophagy inhibitors developed to target cancer. Among them, HCQ, one of the chloroquine derivatives, is a promising anti-cancer autophagy inhibitor in clinical oncology trials (Amaravadi et al. Citation2019). Undoubtedly, more potent autophagy inhibitors are urgently needed both as tool compounds for autophagy-related research and as clinical chemotherapeutic candidates.
The process of autophagy involves several sequential steps: formation of phagocytic vesicles, formation of autophagosomes (Rapa: an allosteric inhibitor of mTOR and an inducer of autophagosome formation theoretically.), autophagosome-lysosome fusion to form autolysosomes (CQ: an inhibitor of lysosome-autophagosome fusion), and the lysosomal degradation of autolysosomes. Late-stage autophagy can be inhibited by blocking the fusion of autophagosomes to lysosomes or inhibiting the degradation of autolysosomes. Inhibition of late-stage autophagy is a key step in blocking autophagic flux (Yu et al. Citation2018; Amaravadi et al. Citation2019). The impairment of lysosome function or the incomplete co-localization of autophagosomes and lysosome may lead to the block of autophagy flux (Hu et al. Citation2021). In this study, we revealed for the first time that garcinone E inhibited the autophagic flux by partially blocking the autophagosome-lysosome fusion and inducing lysosomal damage resulting in an increase in the number of autophagosomes in NPC cells. This finding was further supported by molecular studies: GO results suggested that the DEGs determined by RNA-seq in garcinone E-treated cells were mainly annotated to autophagy and processes utilizing autophagic-related BP, CC, and MF, and pathway enrichment of these genes identified several autophagy-related signalling pathways such as autophagy, FoxO signalling pathway, lysosome, and mitophagy. Collectively, the results suggested that garcinone E may exert anticancer activity by modulating autophagy. Consistently, we further revealed that garcinone E could significantly enhance the protein expression of ULK1, PIK3R4, Beclin-1, LC3B-II/LC3B-I, and SQSTM1/p62, key proteins and regulators of autophagy. For example, ULK1 plays an essential role in autophagy by acting upstream of Beclin-1 and PIK3R4/PI3K class III complex to regulate the formation of the precursors of autophagosomes (Chan et al. Citation2007), and Beclin-1, a tumour suppressor (Liang et al. Citation1999), is one of the central proteins in autophagy (Margariti et al. Citation2013; Ashkenazi et al. Citation2017; Kaur and Changotra Citation2020) and acts as the core subunit of the PI3K complex that regulates the formation of phosphoinositide 3-phosphate. PIK3R4 is also a regulatory subunit of the PI3K complex that regulates the formation of phosphoinositide 3-phosphate. The PIK3R4/PI3K class III complex interacts with Beclin-1 and other proteins to stimulate the initiation of autophagosomes. Thus, the accumulation of ULK1, PIK3R4, and Beclin-1 induced by garcinone E might prepare intracellular membranes to promote the initiation of autophagosomes in the early stages of autophagy.
The expression levels of LC3B-II and LC3B-I were also induced by garcinone E treatment, as determined by RNA-seq, RT-qPCR, and western blot. LC3B plays a role as a ubiquitin-like modifier involved in the formation of autophagosomes. During the formation of autophagosomes, the cytosolic LC3-I is lipidated and translated into LC3-II, which is a critical process in the autophagy pathway (Sun et al. Citation2017; Zhang and Ma Citation2019). Given the ability of garcinone E to induce LC3B, this chemical was assumed to be capable of increasing the number of autophagosomes; as expected, the MDC assay verified that garcinone E enhanced the number of autophagosomes. Thus, we believe that, in response to garcinone E, the enhanced expression of LC3-II/LC3-I and the increase in autophagosomes may be due to the increase in autophagosome formation and/or the inhibition of the autophagic flux.
The expression levels of SQSTM1/p62, which is a crucial marker of the autophagic flux, were also elevated by garcinone E treatment. Lysosomal degradation of autophagosomes may lead to a decrease in the expression level of the SQSTM1/p62 protein in the late stage of autophagy; on the contrary, inhibition of the autophagy flux can increase the level of SQSTM1/p62 (Klionsky et al. Citation2016; Hu et al. Citation2021; Zhang et al. Citation2019). HK1 and HONE1 cells exhibited more SQSTM1/p62 in response to garcinone E, suggesting that the autophagic flux might be blocked, and therefore, the fluorescence microscope was used to visualize the changes from autophagosomes to autolysosomes in HK1-stubRFP-sensGFP-LC3 and HONE1-stubRFP-sensGFP-LC3 cells. Consistent with the western blot and RT-qPCR analyses of SQSTM1/p62 expression, the fluorescence microscope results confirmed that garcinone E blocked the autophagic flux in NPC cells. Further, we verified that garcinone E partially inhibited the fusion of autophagosomes and lysosomes by GFP-LC3 and LysoBrite Blue staining. Furthermore, we found that garcinone E increased the gal-3-labeled damaged lysosomes and reduced co-localization of LC3-labeled autophagosomes and Gal-3-labeled damaged lysosomes. Therefore, our research showed that garcinone E significantly blocked the autophagic flux by partially inhibiting the autophagosome-lysosome fusion in the late stage of autophagy in NPC cells. In our future studies, the mechanisms of garcinone E-induced regulation of the autophagosome-lysosome fusion and FoxO signalling pathway, a crucial pathway upstream of autophagy (Farhan et al. Citation2020), will be further explored.
Autophagic flux inhibition and cell cycle arrest are both very important physiological processes that can lead to the inhibition of cancer cell proliferation (Tilija Pun et al. Citation2020; Siri et al. Citation2021). Autophagy and cell cycle pathway may share several upstream signalling pathways such as MAPK signalling pathway and PI3K-Akt signalling pathway. During tumour progression, autophagy may play a protective role and promote tumour growth. Inhibition of autophagy can restrict cancer progression (Farhan et al. Citation2020). In this study, we performed the MTS cell viability assay, colony formation assay, cell cycle analysis and S18 xenograft experiments to verify the antitumour activity of garcinone E on NPC cells. Further high-throughput RNA sequencing data analysis revealed that garcinone E mainly affected autophagy-related biological processes and pathways. Then, we performed experiments to reveal the function of garcinone E as an autophagic flux inhibitor. Therefore, our results suggested that garcinone E could be deemed an autophagic flux inhibitor with an application potential as an NPC chemotherapeutic agent. Further research is needed to prove that garcinone E plays an anti-cancer activity via inhibiting autophagic flux in NPC cells.
Conclusions
Our present research revealed that garcinone E significantly suppressed cell viability, inhibited colony formation, arrested the cell cycle, caused the accumulation of autophagosomes, induced lysosome damage, and inhibited autophagic flux by partially blocking the fusion of autophagosomes and lysosomes in NPC cells. In an in vivo xenograft model, garcinone E reduced S18 xenograft growth. On the one hand, garcinone E could be deemed an effective chemotherapy agent for NPC treatment. On the other hand, garcinone E is expected to be used as an autophagic flux inhibitor with potential applications in basic research to discover the mechanisms of autophagy. The detailed antitumour mechanisms of garcinone E remain to be further investigated. In addition, it would be important to explore the synergistic effect of garcinone E combined with certain chemotherapeutic agents that induce autophagy.
Acknowledgments
We would like to express our sincere thanks to Dr. Shixiu Feng and Min Zhang from Shenzhen Fairy Lake Botanical Garden, Chinese Academy of Sciences for their assistance in the extraction of garcinone E. We further acknowledge the help and support of Yi Hong, Shanzhou Xie, and Meiting Cai at the Guangxi Medical University.
Disclosure statement
The authors declare that they have no conflict of interest.
Data availability statement
The data that support the findings of this study are available from the corresponding author, FY and XL, upon reasonable request.
Additional information
Funding
References
- Amaravadi RK, Kimmelman AC, Debnath J. 2019. Targeting autophagy in cancer: recent advances and future directions. Cancer Discov. 9(9):1167–1181.
- Araújo J, Fernandes C, Pinto M, Tiritan ME. 2019. Chiral derivatives of xanthones with antimicrobial activity. Molecules. 24(2):314.
- Ashkenazi A, Bento CF, Ricketts T, Vicinanza M, Siddiqi F, Pavel M, Squitieri F, Hardenberg MC, Imarisio S, Menzies FM, et al. 2017. Polyglutamine tracts regulate beclin 1-dependent autophagy. Nature. 545(7652):108–111.
- Blanchard P, Lee A, Marguet S, Leclercq J, Ng WT, Ma J, Chan ATC, Huang PY, Benhamou E, Zhu G, et al. 2015. Chemotherapy and radiotherapy in nasopharyngeal carcinoma: an update of the MAC-NPC meta-analysis. Lancet Oncol. 16(6):645–655.
- Casimiro MC, Di Sante G, Di Rocco A, Loro E, Pupo C, Pestell TG, Bisetto S, Velasco-Velazquez MA, Jiao X, Li Z, et al. 2017. Cyclin D1 restrains oncogene-induced autophagy by regulating the AMPK-LKB1 signalling axis. Cancer Res. 77(13):3391–3405.
- Chan EY, Kir S, Tooze SA. 2007. siRNA screening of the kinome identifies ULK1 as a multidomain modulator of autophagy. J Biol Chem. 282(35):25464–25474.
- Chen YP, Chan ATC, Le QT, Blanchard P, Sun Y, Ma J. 2019. Nasopharyngeal carcinoma. Lancet. 394(10192):64–80.
- Chen F, Zhang XH, Hu XD, Zhang W, Lou ZC, Xie LH, Liu PD, Zhang HQ. 2015. Enhancement of radiotherapy by ceria nanoparticles modified with neogambogic acid breast cancer cells. Int J Nanomedicine. 10:4957–4969.
- Chi Y, Zhan X, Yu H, Xie G, Wang Z, Xiao W, Wang Y, Xiong F, Hu J, Yang L. 2013. An open-labeled, randomized, multicenter phase IIa study of gambogic acid injection for advanced malignant tumours. Chin Med J. 126(9):1642–1646.
- Chin YW, Kinghorn AD. 2008. Structural characterization, biological effects, and synthetic studies on xanthones from mangosteen (Garcinia mangostana), a popular botanical dietary supplement. Mini Rev Org Chem. 5(4):355–364.
- Chukaew A, Saithong S, Chusri S, Limsuwan S, Watanapokasin R, Voravuthikunchai SP, Chakthong S. 2019. Cytotoxic xanthones from the roots of Mesua ferrea L. Phytochemistry. 157:64–70.
- Dickson I. 2019. Autophagy inhibitor combination strategies for pancreatic cancer. Nat Rev Gastroenterol Hepatol. 16(5):262–263.
- Farhan M, Silva M, Li S, Yan F, Fang J, Peng T, Hu J, Tsao MS, Little P, Zheng W. 2020. The role of FOXOs and autophagy in cancer and metastasis-implications in therapeutic development. Med Res Rev. 40(6):2089–2113.
- Ho CK, Huang YL, Chen CC. 2002. Garcinone E, a xanthone derivative, has potent cytotoxic effect against hepatocellular carcinoma cell lines. Planta Med. 68(11):975–979.
- Hu Y, Li J, Chang AK, Li Y, Tao X, Liu W, Wang Z, Su W, Li Z, Liang X. 2021. Screening and tissue distribution of protein tyrosine phosphatase 1B inhibitors in mice following oral administration of Garcinia mangostana L. ethanolic extract. Food Chem. 357:129759.
- Hu P, Li H, Sun W, Wang H, Yu X, Qing Y, Wang Z, Zhu M, Xu J, Guo Q, et al. 2021. Cholesterol-associated lysosomal disorder triggers cell death of hematological malignancy: dynamic analysis on cytotoxic effects of LW-218. Acta Pharm Sin B. 11(10):3178–3192.
- Ishaq M, Khan MA, Sharma K, Sharma G, Dutta RK, Majumdar S. 2014. Gambogic acid induced oxidative stress dependent caspase activation regulates both apoptosis and autophagy by targeting various key molecules (NF-kappaB, Beclin-1, p62 and NBR1) in human bladder cancer cells. Biochim Biophys Acta. 1840(12):3374–3384.
- Kaur S, Changotra H. 2020. The beclin 1 interactome: modification and roles in the pathology of autophagy-related disorders. Biochimie. 175:34–49.
- Kimmelman AC, White E. 2017. Autophagy and tumour metabolism. Cell Metab. 25(5):1037–1043.
- Klionsky DJ, Abdelmohsen K, Abe A, Abedin MJ, Abeliovich H, Acevedo Arozena A, Adachi H, Adams CM, Adams PD, Adeli K, et al. 2016. Guidelines for the use and interpretation of assays for monitoring autophagy (3rd edition). Autophagy. 12(1):1–222.
- Klionsky DJ, Emr SD. 2000. Autophagy as a regulated pathway of cellular degradation. Science. 290(5497):1717–1721.
- Kong X, Liu X, Dong C, Xia Y, Lu Y, Zhang J. 2018. Garcinone E inhibits proliferation, migration and invasion of human nasopharyngeal carcinoma HK1 and HONE1 Cells. Cancer Res Prev Treat. 45(9):617–622. Chinese.
- Lao Y, Wan G, Liu Z, Wang X, Ruan P, Xu W, Xu D, Xie W, Zhang Y, Xu H, et al. 2014. The natural compound oblongifolin C inhibits autophagic flux and enhances antitumour efficacy of nutrient deprivation. Autophagy. 10(5):736–749.
- Li X, Jiang Q, Chen B, Luo X, Chen D. 2018. Structure-activity relationship and prediction of the electron-transfer potential of the xanthones series. ChemistryOpen. 7(9):730–736.
- Liang XH, Jackson S, Seaman M, Brown K, Kempkes B, Hibshoosh H, Levine B. 1999. Induction of autophagy and inhibition of tumourigenesis by beclin 1. Nature. 402(6762):672–676.
- Lopez-Otin C, Kroemer G. 2019. Decelerating ageing and biological clocks by autophagy. Nat Rev Mol Cell Biol. 20(7):385–386.
- Love MI, Huber W, Anders S. 2014. Moderated estimation of fold change and dispersion for RNA-seq data with DESeq2. Genome Biol. 15(12):550.
- Luo W, Fang W, Li S, Yao K. 2012. Aberrant expression of nuclear vimentin and related epithelial-mesenchymal transition markers in nasopharyngeal carcinoma. Int J Cancer. 131(8):1863–1873.
- Manic G, Obrist F, Kroemer G, Vitale I, Galluzzi L. 2014. Chloroquine and hydroxychloroquine for cancer therapy. Mol Cell Oncol. 1(1):e29911.
- Margariti A, Li H, Chen T, Martin D, Vizcay-Barrena G, Alam S, Karamariti E, Xiao Q, Zampetaki A, Zhang Z, et al. 2013. XBP1 mRNA splicing triggers an autophagic response in endothelial cells through BECLIN-1 transcriptional activation. J Biol Chem. 288(2):859–872.
- Mohamed GA, Al-Abd AM, El-Halawany AM, Abdallah HM, Ibrahim SRM. 2017. New xanthones and cytotoxic constituents from Garcinia mangostana fruit hulls against human hepatocellular, breast, and colorectal cancer cell lines. J Ethnopharmacol. 198:302–312.
- Mohan S, Syam S, Abdelwahab SI, Thangavel N. 2018. An anti-inflammatory molecular mechanism of action of α-mangostin, the major xanthone from the pericarp of Garcinia mangostana: an in silico, in vitro and in vivo approach. Food Funct. 9(7):3860–3871.
- Panda SS, Chand M, Sakhuja R, Jain SC. 2013. Xanthones as potential antioxidants. Curr Med Chem. 20(36):4481–4507.
- Papadopoulos C, Kirchner P, Bug M, Grum D, Koerver L, Schulze N, Poehler R, Dressler A, Fengler S, Arhzaouy K, et al. 2017. VCP/p97 cooperates with YOD1, UBXD1 and PLAA to drive clearance of ruptured lysosomes by autophagy. Embo J. 36(2):135–150.
- Pedraza-Chaverri J, Cardenas-Rodriguez N, Orozco-Ibarra M, Perez-Rojas JM. 2008. Medicinal properties of mangosteen (Garcinia mangostana). Food Chem Toxicol. 46(10):3227–3239.
- Schneider JL, Cuervo AM. 2014. Autophagy and human disease: emerging themes. Curr Opin Genet Dev. 26:16–23.
- Shao S, Li S, Qin YW, Wang XR, Yang YN, Bai HT, Zhou LL, Zhao CX, Wang C. 2014. Spautin-1, a novel autophagy inhibitor, enhances imatinib-induced apoptosis in chronic myeloid leukemia. Int J Oncol. 44(5):1661–1668.
- Siri M, Behrouj H, Dastghaib S, Zamani M, Likus W, Rezaie S, Hudecki J, Khazayel S, Łos MJ, Mokarram P, et al. 2021. Casein kinase-1-alpha inhibitor (D4476) sensitizes microsatellite instable colorectal cancer cells to 5-fluorouracil via authophagy flux inhibition. Arch Immunol Ther Exp (Warsz). 69(1):26.
- Suksamrarn S, Suwannapoch N, Ratananukul P, Aroonlerk N, Suksamrarn A. 2002. Xanthones from the green fruit hulls of Garcinia mangostana. J Nat Prod. 65(5):761–763.
- Sun CY, Zhu Y, Li XF, Tang LP, Su ZQ, Wang XQ, Li CY, Yang HM, Zheng GJ, Feng B. 2017. Norcantharidin alone or in combination with crizotinib induces autophagic cell death in hepatocellular carcinoma by repressing c-Met-mTOR signalling. Oncotarget. 8(70):114945–114955.
- Taher M, Tg Zakaria TM, Susanti D, Zakaria ZA. 2016. Hypoglycaemic activity of ethanolic extract of Garcinia mangostana Linn. in normoglycaemic and streptozotocin-induced diabetic rats. BMC Complement Altern Med. 16:135.
- Thu HNT, Minh QP, Van CP, Van TN, Van KP, Thanh TN, Tu ALT, Litaudon M, The SN. 2021. Cytotoxic and alpha-glucosidase inhibitory xanthones from Garcinia mckeaniana leaves and molecular docking Study. Chem Biodivers. 18:e2100396.
- Tilija Pun N, Jang WJ, Jeong CH. 2020. Role of autophagy in regulation of cancer cell death/apoptosis during anti-cancer therapy: focus on autophagy flux blockade. Arch Pharm Res. 43(5):475–488.
- Tran TH, Nguyen VT, Le HT, Nguyen HM, Tran TH, Do Thi T, Nguyen XC, Ha MT. 2021. Garcinoxanthones SV, new xanthone derivatives from the pericarps of Garcinia mangostana together with their cytotoxic and antioxidant activities. Fitoterapia. 151:104880.
- Winter DK, Sloman DL, Porco JA. Jr. 2013. Polycyclic xanthone natural products: structure, biological activity and chemical synthesis. Nat Prod Rep. 30(3):382–391.
- Xia Y, Liu X, Zou C, Feng S, Guo H, Yang Y, Lei Y, Zhang J, Lu Y. 2018. Garcinone C exerts antitumour activity by modulating the expression of ATR/Stat3/4EBP1 in nasopharyngeal carcinoma cells. Oncol Rep. 39(3):1485–1493.
- Xu XH, Liu QY, Li T, Liu JL, Chen X, Huang L, Qiang WA, Chen X, Wang Y, Lin LG, et al. 2017. Garcinone E induces apoptosis and inhibits migration and invasion in ovarian cancer cells. Sci Rep. 7(1):10718.
- Yang L, Xu Z, Wang W. 2020. Garcinone-E exhibits anticancer effects in HeLa human cervical carcinoma cells mediated via programmed cell death, cell cycle arrest and suppression of cell migration and invasion. AMB Express. 10(1):126.
- Yu L, Chen Y, Tooze SA. 2018. Autophagy pathway: cellular and molecular mechanisms. Autophagy. 14(2):207–215.
- Zhang F, Ma C. 2019. Kaempferol suppresses human gastric cancer SNU-216 cell proliferation, promotes cell autophagy, but has no influence on cell apoptosis. Braz J Med Biol Res. 52(2):e7843.
- Zhang L, Qiang P, Yu J, Miao Y, Chen Z, Qu J, Zhao Q, Chen Z, Liu Y, Yao X, et al. 2019. Identification of compound CA-5f as a novel late-stage autophagy inhibitor with potent anti-tumour effect against non-small cell lung cancer. Autophagy. 15(3):391–406.
- Zhou X, Cao SM, Cai YL, Zhang X, Zhang S, Feng GF, Chen Y, Feng QS, Chen Y, Chang ET, et al. 2021. A comprehensive risk score for effective risk stratification and screening of nasopharyngeal carcinoma. Nat Commun. 12(1):5189.