
 ?Mathematical formulae have been encoded as MathML and are displayed in this HTML version using MathJax in order to improve their display. Uncheck the box to turn MathJax off. This feature requires Javascript. Click on a formula to zoom.
Abstract
This paper presents a novel method combining electrolaryngography and acoustic analysis to detect the onset and offset of phonation as well as the beginning and ending of notes within a sung legato phrase, through the application of a peak-picking algorithm, TIMEX. The evaluation of the method applied to a set of singing duo recordings shows an overall performance of 78% within a tolerance window of 50 ms compared with manual annotations performed by three experts. Results seem very promising in light of the state-of-the-art techniques presented at MIREX in 2016 yielding an overall performance of around 60%. The new method was applied to a pilot study with two duets to analyse synchronization between singers during ensemble performances. Results from this investigation demonstrate bidirectional temporal adaptations between performers, and suggest that the precision and consistency of synchronization, and the tendency to precede or lag a co-performer might be affected by visual contact between singers and leader–follower relationships. The outcomes of this paper promise to be beneficial for future investigations of synchronization in singing ensembles.
Introduction
Accurate analysis of sound, typically musical tones, as performed by an individual is fundamental to the investigation of performed musical characteristics such as tempo, rhythm and pitch structure. The analysis of singing ensemble recordings represents a major challenge in this respect, due to the difficulties of: (i) separating individual voices within polyphonic recordings to evaluate the contribution of each singer and (ii) identifying tone onsets and offsets. Whilst onsets and offsets are often clearly distinguishable for percussive sounds, in singing these vary according to vibrato, vocal fluctuations, timbral characteristics and onset envelopes, especially within a legato phrase where consonants are absent. Currently, there are no robust methods to identify onsets and offsets of individual voices, particularly in the context of ensemble singing. A protocol for onset–offset detection of singing ensemble recordings might be useful for a range of aspects of music performance analysis and audio signal processing, such as music information retrieval, transcription applications and to evaluate synchronization between musicians during singing ensemble performances.
The use of close proximity microphones, although capturing the data of the individual singers, does not eliminate bleed from other performers (Citation1), and makes isolation of individual notes and therefore onsets and offsets difficult. Recent studies conducted by David Howard analysed tuning in two different SATB ensembles: the complexities of polyphonic analysis associated with audio recordings (Citation2–4) were avoided by applying acoustic analysis in conjunction with electrolaryngography (Lx) to extract the fo estimates from vocal fold contact information. Electrolaryngography, coupled with electroglottography (EGG), two non-invasive techniques that assess vocal fold vibration in vivo through electrodes placed externally on either side of the neck at the level of the larynx, allow measurement of performance data in solo and ensemble performances and are often employed in singing research (for a recent review, see (Citation5)). However, the use of Lx/EGG for the temporal analysis of onsets and offsets to assess synchronization between singers during vocal ensemble performances has still to be evaluated.
Several approaches have been suggested for note-onset detection (for a review, see (Citation6)). A few studies have focused on spectral features of the signals (Citation7), combined phase and energy information (Citation8), analysed phase deviations across the frequency domain (Citation9), considered change of energy in frequency sub-bands (Citation10), or are based on probabilistic methods such as hidden Markov models (Citation11). Other approaches are based on the fundamental frequency contour and sound level envelope (Citation12), or on time and frequency domain features (Citation13). The selection and reliability of the algorithms mentioned above are strictly correlated to the type and quality of the audio signal; for example, time domain methods perform relatively well if the signal is very percussive as in piano or drum recordings.
It is noteworthy that existing algorithms perform less well in singing compared with other classes, such as solo brass, wind instruments and polyphonic pitched instruments. In Music Information Retrieval Evaluation eXchange (MIREX 2016), the best-performing algorithm for onset detection of solo singing voice achieved an F-measure, which is a metric of the overall performance, of 61.7%; whereas, the best-performing algorithms for drums, plucked strings, brass and wind instruments achieved an F-measure of 93%, 92%, 91% and 78%, respectively. Toh et al. (Citation14) implemented a system for the analysis of the solo singing voice that accurately identified 85% of onsets within 50 ms of the ground truth such as the manually annotated values of the same recordings. However, this is not precise enough for the analysis of the highly accurate coordination that is found in professional music ensembles, known to be in the order of tens of milliseconds (Citation15,Citation16). In summary, automated onset detection of non-percussive performances, such as singing ensemble performances, from audio recordings remains a challenge and is currently under development and evolving. A robust algorithm able to automatically extract timing information in such performances will be highly beneficial for the investigation of synchronization between members of a singing ensemble.
This paper addresses the complexities of analysing onset and offset timings in polyphonic singing recordings through a case study considering synchronisation in singing ensemble performances. A novel method to investigate temporal coordination in singing ensembles is developed and tested, based on the combined application of electrolaryngography and acoustic analysis, and on a new automated algorithm, termed TIMEX, that automatically extracts timing in monoaural singing performances. The effectiveness of this new method for the analysis of synchronization in singing ensembles was tested in a pilot study. A secondary aim of the pilot study was to investigate the importance of visual cues and leader–follower relationships in singers’ synchronization during vocal ensemble performances with the central question: Do the presence/absence of visual contact (VC) between musicians and the instruction to act as leader or follower affect synchronization between singers in vocal duos? Synchronization between musicians is maintained through iterative temporal adjustments which might relate to expressive interpretations or noise during cognitive-motor processes. Research suggests that synchronization in small ensembles (Citation17,Citation18) might be affected by VC between musicians when auditory feedback is limited or musical timing is irregular, and by leader–follower relationships between members of a musical ensemble. However, how synchronization evolves during vocal ensemble performances in relation to these factors still needs to be fully understood.
Based on previous evidence, it was hypothesized that the combination of electrolaryngography and acoustic analysis is a valuable tool for the analysis of synchronization in singing ensembles by tracking the fo profile, as this combination proved to be a successful method in studies analysing intonation in SATB quartets from fo estimates (Citation2–4). It was also conjectured that the leader’s onset might tend to precede those of the follower, as found by (Citation17) in piano duos. Finally, it was hypothesized that singers do not significantly rely on VC to temporally synchronize their actions with the co-performers’ actions during the ensemble performance of regular rhythms, as found by (Citation19) in piano duos.
The remainder of this paper is organized in four sections. First, an overview and evaluation of the novel onset/offset detection method is presented (see section ‘TIMEX’). A case study of synchronization between singers in two vocal duos, based on the application of the new protocol is then described (see section ‘Case study of synchronization in singing ensembles’). Finally, results of the algorithm’s evaluation and the case study are discussed and conclusions presented.
TIMEX: an algorithm for the automatic detection of note onsets and offsets
The purpose of this section is to first describe (see section ‘Algorithm specification’) and then test (see section ‘Algorithm evaluation’) a novel algorithm developed to automatically extract temporal information relating to the notes within a legato phrase sung on any vowel. The input for the algorithm is the fo profile extracted from monoaural audio recordings of a singing ensemble obtained using Lx and a head-mounted microphone.
Algorithm specification
When singers perform legato, there are no silences between the notes within a phrase: phonation continues until the next rest/breath, effectively creating a portamento between notes. In the development of the algorithm, it was therefore necessary to set criteria with which to analyse the beginning and ending of each note within the piece. This has resulted in four categories being defined to denote the true beginning and ending of the scored notes. These are shown in and defined as:
Figure 1. The fo profile of measures 1–3 of the raw Lx and audio signal from an upper voice performance of the two-part piece composed for this study (see section ‘Stimulus material’), showing: (i) on the top panel, the Lx recording with the four sets of categories identified for each note within a legato phrase (i.e. onset, note beginning, note ending and offset), a local peak and the phrases; (ii) on the bottom, the audio recording, with the ON and OF fluctuation ranges and the break range.
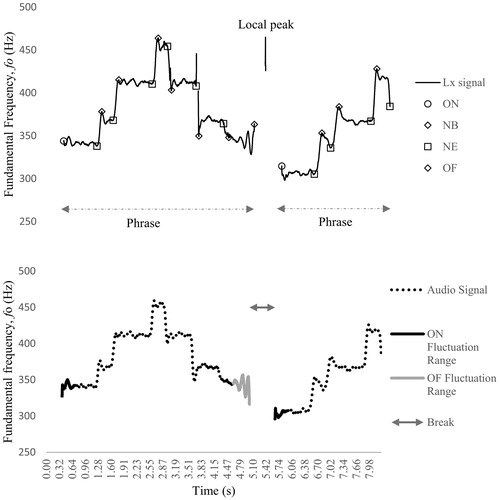
Onset (ON): beginning of phonation after a silence
Note ending (NE): peak/trough in fo during phonation within a legato phrase, that is atypical of a vibrato cycle’s characteristics for extent and frequency, calculated between 80 and 120 cents and between 2 and 9 Hz, respectively, and refined for each singer
Note beginning (NB): peak/trough in fo during phonation that exceeds the maximum vibrato extent and is less than the vibrato frequency following a note ending
Offset (OF): ending of phonation followed by a silence.
In order to automate the extraction of the above categories, the following definitions have been formulated and parameter values inputted. The values were manually determined by testing with several recordings and can be modified by the users.
Break: a sequence of one or more points where the Lx signal is null.
Rest: a sequence of a minimum number of consecutive points where the Lx signal is null. The number of minimum points required to classify a break as a rest is arbitrarily defined; for this specific set of recordings, it has been set to a corresponding time window of 300 ms representing a quaver rest at 100 beats per minute (BPM).
Phrase: a section of the Lx recording comprised between an onset and the following offset.
Fluctuation: the difference in frequency between two Lx or AUDIO points; the fluctuation can be linear or logarithmic, depending how it is measured. For these recordings, it was set to 80 cents.
Local max: a point where the Lx/AUDIO value is higher than the Lx/AUDIO values at the previous and at the following point.
Local min: a point where the Lx/AUDIO value is lower than the Lx/AUDIO values at the previous and at the following point.
Onset/offset fluctuation range: the range of points after an onset or before an offset, where the singer’s voice typically oscillates; local max/min points are ignored within this range, because they are not aligned with note changes, but are the result of the vibrato. Its duration is arbitrarily defined; a value of 300 ms has been used, as appropriate with this set of recordings.
Vibrato frequency threshold: the minimum frequency of oscillation of the Lx or audio signal that classifies the segment as vibrato, and therefore is not associated to a true note change from the score. For these recordings, it was set to 5 Hz.
Local peak: a point with a positive Lx value that falls in the middle of a range of a prescribed temporal window, where at least one point with null Lx frequency exists before and after such a point. The temporal window to conduct the check is arbitrarily defined; a time span of 500 ms centred around the point in question has been used with satisfactory results in this project.
Spiking range: a range of points immediately before an onset or after an offset, where the Lx signal artificially spikes relative to the corresponding AUDIO signal. The width of such a range is arbitrarily defined; given the steepness of the spikes, a value of just 10 ms has proven sufficient to isolate the spikes.
TIMEX detects and extracts ON, NB, NE and OF ensuring consistency of the analysis based on the following steps, as shown in .
Figure 2. Algorithm flowchart.
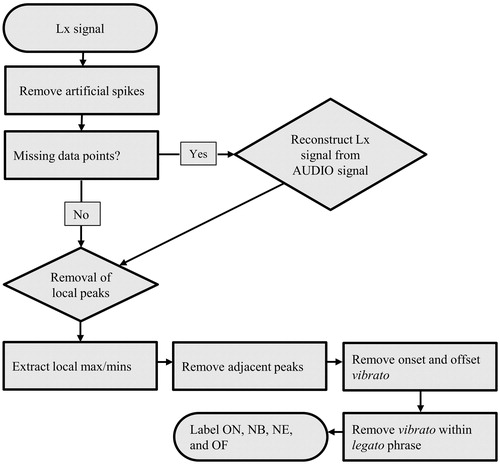
Step 1: removal of Lx readings in the spiking range. The first operation performed on the raw Lx data is to remove all the positive Lx readings within the spiking range (adjacent to the breaks), replacing them with null values. This step is executed to prevent the artificial spikes from leading to a skewed and distorted reconstruction of the Lx signal from the AUDIO signal (the reconstruction procedure is explained in Step 2).
Step 2: reconstruction of the missing Lx signal from the AUDIO signal. If the Lx signal is weak, the algorithm reconstructs the signal from the audio recording. This is achieved through a normalization procedure designed to reconstruct the Lx signal to follow the same shape as the AUDIO signal. The audio signal is scaled to match the original Lx values at the edges of the interval where the Lx signal is missing, therefore avoiding artificial max/min points being generated at the edges; from here on, the ‘original’ Lx signal refers to the signal after the Lx readings in the spiking range have been removed, as per Step 1.
Using the following nomenclature:
t0, t1: time intervals at the boundaries of the range where the original Lx signal is missing or weak, and the audio signal is at least partially available.
fo_Lx0, fo_Lx1: the values of the original Lx signal at t0 and t1; they are both positive by definition of how t0 and t1 are selected.
fo_AUDIO0, fo_AUDIO1: the values of the AUDIO signal at t0 and t1; if one of them is zero, it is calculated as the other one multiplied by the ratio between fo_Lx at that point and fo_Lx at the other end, while if both are zero reconstruction is not attempted for this interval.
fo_LxL(t), fo_AUDIOL(t): the values of the linearized Lx signal and the AUDIO signal respectively at time t, with t falling between t0 and t1; these are linearized as falling on a straight line connecting fo_Lx0 and fo_Lx1, and fo_AUDIO0 and fo_AUDIO1, respectively.
fo_Lx(t), fo_AUDIO(t): the values of the original Lx signal and the AUDIO signal respectively at time t, with t falling between t0 and t1.
The linearized Lx and AUDIO values are first computed as follows:
(1)
(1)
(2)
(2)
Then, if fo_AUDIO(t) = 0, fo_Lx(t) = 0 (reconstruction not possible at a point where even the microphone reading is not available), otherwise fo_Lx(t) is reconstructed as
(3)
(3)
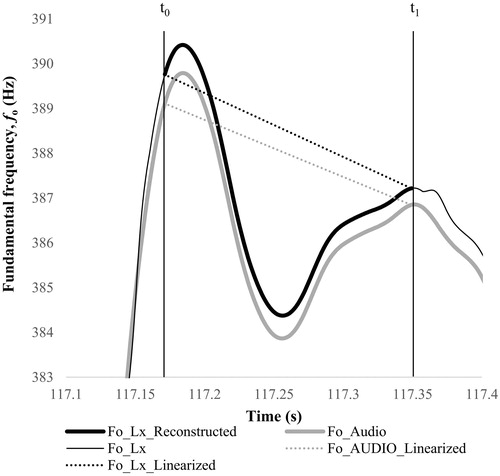
The result of this reconstruction is that the Lx signal follows the shape of the AUDIO signal in the areas where the raw signal is not available, remaining continuous with the original values where present, as shown in the example of .
Figure 3. Excerpt of the Lx and AUDIO signals from a recording of the upper voice performance, showing the reconstruction of the fo_Lx signal from fo_AUDIO signal in the temporal interval t0–t1, in which the Lx signal was missing. The Lx signal was reconstructed (see fo_Lx_Reconstructed) based on the linearized Lx and AUDIO signal (see fo_Lx_Linearized and fo_AUDIO_Linearized, respectively).
Step 3: removal of Lx local peaks. After the Lx signal has been reconstructed, any remaining local peaks are identified, based on the selected range (see definition above) and removed. The purpose is to eliminate spurious readings that are sometimes produced by the Lx sensor, which typically occur in a narrow time range, and can be identified via a proper selection of the local peak range. Removing the peaks after the signal has been reconstructed, from the AUDIO data where possible, allows the maximum amount of Lx data to be retained. The resulting Lx signal left after the removal of the local spikes is defined as the ‘reconstructed’ Lx signal.
Step 4: identification of onsets, offsets, note beginnings and note endings. Once the Lx signal has been reconstructed, it is processed to extract onsets and offsets of phonation and local max/min points during phonation. Then, local max/min points are retained if all the following conditions are satisfied:
1.1. The point is not too close to the adjacent local max/mins. Points that are too close to each other are removed, to avoid retaining small steps within a tone ascending or descending section as note beginnings or note endings, when they are just fluctuations of the singer’s voice that sometimes occur within a note change. A value of just 10 ms is sufficient to discriminate those points from the max/mins to be retained.
1.2. The point does not fall within the onset or the offset fluctuation range.
1.3. Any of the following two conditions are satisfied:
1.3.1. The logarithmic fluctuation, measured in cents, of the current point from the previous onset or max/min, or to the next max/min, is greater than a prescribed threshold. The distance in cents between two points at frequencies f1 and f2 is defined as in (Citation3)
(4)
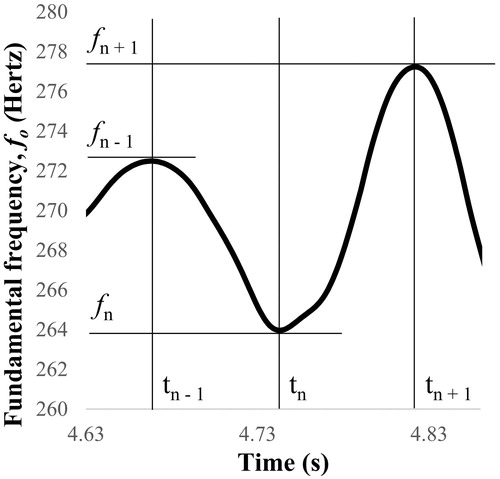
1.3.2. The frequency of oscillation of the point, relative to the previous and the next point, is lower than the vibrato frequency threshold; this condition is applied to disregard any max/mins that are the result of a vibrato of the singer’s voice, without having to set a threshold that is too high for the logarithmic fluctuation, which would lead to discarding valid note beginnings or endings for semitones. The vibration frequency (vfn) of the point is defined as the lowest of the oscillation frequencies relative to the previous and the next max/min, as shown in :
Figure 4. Example of the vibration frequency computed across a full cycle, extracted from an audio clip of the upper voice used for the study.
The ability to manually tweak the results after visual validation is set to ensure that all and only the relevant max/min points are retained as note beginnings/endings.
Algorithm evaluation
Testing TIMEX on a set of singing performances
The effectiveness of the algorithm was tested on 28 Lx recordings of a two-part piece composed by the first author for the following case study, as shown in , and performed by two singing duos (see section ‘Participants’ for more details). The data collected include 728 note beginnings, 728 note endings, 112 onsets and 112 offsets, with a total of 1680 timing extractions. Each audio file was approximately 25 s long, and the total length of the audio clips was about 10 minutes, which is much longer than the singing recordings used in the Music Information Retrieval Evaluation eXchange (MIREX 2016) onset detection task. Recordings were manually cross-annotated by three experts, external to this investigation, who marked the beginning and ending of each note using Praat software (Citation20,Citation21). Experts used the same software setup displaying a spectrogram and a waveform with a fixed time window, and a tier for hand annotations; this display setup also gave the experts the chance to listen to the recordings. Markings were applied to monoaural recordings of the two-part performances sampled at 48 kHz and post-processed with a time step of 1 ms. This time step setting was chosen to allow the detection of small asynchronies in the order of tens of milliseconds, such as those found in the literature of music ensemble performances.
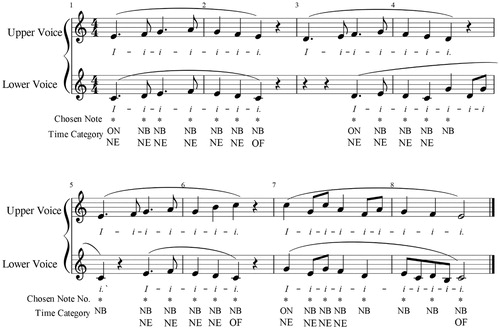
Figure 5. Duet exercise composed for the study, showing the notes chosen (see *) for the analysis of the synchronization and the four sets of time categories (e.g. ON: onset; NB: note beginning; NE: note ending; OF: offset). All notes were used for the evaluation of the reliability of TIMEX.
The evaluation procedure followed that described in MIREX 2016 for onset detection. A tolerance value was set to ±50 ms and the detected times were compared with ground-truth values manually detected by the experts. This is a standard procedure for the evaluation of onset detection algorithms, although the comparison of values detected by the algorithm with those manually detected by experts, and commonly referred to as ‘ground-truth’ values, remains ambiguous and subjective as there can be no true objective value. A large time displacement of 50ms is a well-known criterion in the field of onset detection that takes into account inaccuracy of the hand labelling process (Citation6). In addition, a small-time window of 10 ms was also chosen to detect small asynchronies in the synchronization during professional ensemble performances. The mean of the standard deviations for the manual annotations computed across the three experts was 59 ms.
For a given ground-truth onset time, any extracted value falling within the tolerance time window of 10 or 50 ms was considered correct detection (CD). If the algorithm detected no value within the time window, the detection of that ground-truth time was reported as a false negative (FN). Detections outside all the tolerance windows were counted as false positives (FPs). The performance of the detection method was evaluated based on the three measures commonly used in the field of onset detection: Precision (P), Recall (R) and F-measure (F). The Precision measures the probability that the detected value is a true value, thus calculating how much noise the algorithm provides. The Recall indicates the probability that a true value is identified, therefore, measuring how much of the ground truth the algorithm identifies. The F-measure represents the overall performance, calculating the harmonic mean of Precision and Recall. The measures are computed as follows:
(6)
(6)
(7)
(7)
(8)
(8)
Ncd is the number of correct values detected by the algorithm; Nfp is the number of false values detected; Nfn is the number of missed values. As files were cross-annotated by three experts, the mean Precision and Recall rates were defined by averaging Precision and Recall rates computed for each annotation. The overall results are reported in .
Table 1. Performance of TIMEX.
TIMEX achieved higher results in all measures than the best-performing algorithms for the singing voice from MIREX 2016 (Citation22) with the same threshold of 50 ms, although based on a different data set and extracting different timing categories, such as onsets in MIREX and onsets/offsets/beginnings/endings by TIMEX.
The full data set of detection errors was scrutinized to investigate how FP and FN errors were distributed across performers and over the duration of the pieces. As shown in , the detection errors, computed with a tolerance level set at 10 ms, varied across the four performers: the total number of FNs found for singer 2 performing the upper voice was approximately half that of singer 1 performing the same piece, and the total number of FPs for singer 4 performing the lower voice was less than those found for singer 3 performing the lower part. These results suggest that singers might have a particular technique that affects the performance of the algorithm. As shown in , the total number of FPs was distributed similarly across the course of the piece. However, FNs were more likely to occur when the note being analysed was a semitone from the previous note (as found regarding notes 1–2, 6–7, 20–21 and 29–30 of the upper voice, and 4–5, 16–18, 29–30 of the lower voice) or for intervals greater than a 3rd (as found regarding note 22–24 of the upper voice, and 11–14 and 26–27 of the lower voice).
Figure 6. Distribution of percentage detection errors computed at the beginning and ending of each note across the course of the piece.
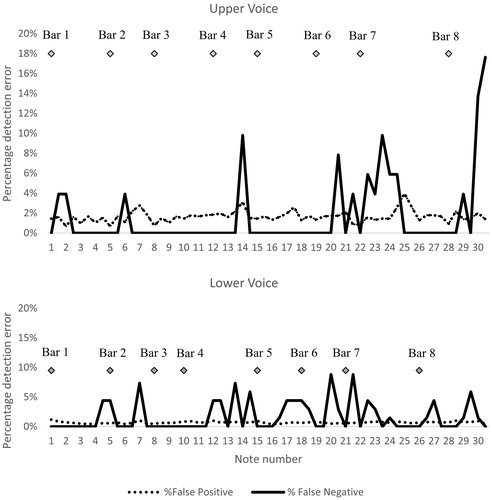
Table 2. Distribution of detection errors across performers.
Evaluating the algorithm’s reconstruction process
The algorithm’s reconstruction process was evaluated with respect to: (i) reliability of the Lx signal, as indexed by the measurement of the continuous/discontinuous parts of the Lx signal and (ii) performance of the reconstruction process. Onset/offset detection based on the AUDIO recording is not fully reliable in the case of singing ensemble recordings, therefore, the quantification of the percentage of times that this step was followed is important to test the reliability of the protocol. The analysis of the quality of the Lx signal analysis was conducted on the full set of recordings collected for the following case-study, including 96 recordings of the upper voice and 96 recordings of the lower voice part of a duet piece composed for the experiment. Sections of the Lx signal associated with rests in the music score were not scrutinized, as the Lx was supposed to be null in the absence of phonation. Results show that the Lx signal was unusable for 0.7% of the recordings and, therefore, the algorithm’s application of the AUDIO signal was limited to 0.7% of the full set of recordings. Analysis also shows that the discontinuous Lx segments were on average 31 ms long (SD 18 ms).
A subset of 40 discontinuous Lx segments averaging 30 ms in length was used to assess the precision of the reconstruction method, by comparing the reconstructed Lx signal with the corresponding Lx signal. The Lx values from the raw segments were initially deleted, then the reconstruction process was run based on the Lx and AUDIO signal, and eventually the raw values were compared with the reconstructed recordings. Results show an average margin of error of 0.034%; the margin of error (E) was first computed for each data point as follows,
(9)
(9)
and then averaged across the entire sample. Vraw represents the raw value extracted from the Lx signal, whilst the Vrec is the value reconstructed from the algorithm based on the shape of the AUDIO signal.
Case study of synchronization in singing ensembles
The following case study aims to test the overall protocol featuring the application of TIMEX to Lx and audio recordings, to analyse the effect of VC and the instruction to act as leader or follower on the synchronization between singers during singing duo performances. This study serves as a test for a subsequent experiment with a larger sample of duos.
Methods
Participants
Four undergraduate singing students (three females and one male) were recruited from the Department of Music at the University of York. Singers had at least 7 years’ experience performing in a singing ensemble (mean 9.3 years, SD 2.1), but they had not sung together prior to the experiment. They reported having normal hearing and not having absolute pitch.
Stimulus material
A vocal duet exercise was composed for this study, featuring mostly a homophonic texture to allow investigation of the synchronization per note, as shown in . The upper voice has a range of a 7th, whilst the lower voice a range of a 5th; the upper voice features a higher tessitura than the lower voice.
Apparatus
Participants were invited to sing in a recording studio at the University of York, treated with absorptive acoustic material. Singers wore head-mounted close proximity microphones (DPA 4065), placed on the cheek at approximately 2 cm from the lips, and electrolaryngograph electrodes (Lx, from Laryngograph Ldt www.laryngograph.com) placed on the neck positioned either side of the thyroid cartilage. One stereo condenser microphone (Rode NT4) was placed at equal distance in front of the singers at approximately 1.5 m from the lips. The five outputs (2 Lx, 2 head-mounted mics, one stereo mic) were connected to a multichannel hard disk recorder (Tascam DR680) and recorded at a sampling frequency of 48 kHz and 24-bit depth.
Design
The study consisted of a within subject design in which participants were asked to sing the piece in the following four conditions, applied in a randomised order:
VC_UpperVoiceL: with VC, and upper voice designated leader and lower voice (LowerVoice) follower
VC_UpperVoiceF: with VC, and upper voice designated follower and lower voice leader
NVC_UpperVoiceL: without VC, and upper voice designated leader and lower voice follower
NVC_UpperVoiceF: without VC, and upper voice designated follower and lower voice leader
Each condition was presented three times, resulting in 12 takes; each take consisted of four repeated performances of the piece, resulting in a 4 (conditions) × 3 (repeated performances of each condition), ×4 (repeated performances within each condition) design featuring a total of 48 repetitions of the piece per duet.
Procedure
Singers received the stimulus material prior to the experiment, to practise the piece. On the day of the experiment, first participants were asked to fill in a background questionnaire and consent form. Then, head mounted microphones and Lx electrodes were placed on each singer and adjusted. The correct placement of the Lx electrodes was verified by checking the signal on the visual display and listening over headphones. The microphones were adjusted for the sound pressure level of each participant to avoid clipping. Singers were invited to familiarize themselves with the piece for 10 minutes, singing together from the score to the vowel/i/, while listening for 10 seconds to a metronome set at 100 BPM before starting to rehearse. If singers were able to perform the piece without errors, the four conditions and associated 12 takes were then presented; otherwise, they were allowed to practise the piece for 10 more minutes and then the test was repeated. Once the musicians passed the performance test without errors with the score, each singer was assigned the role of leader or follower; these roles were then reversed according to UpperVoiceL and UpperVoiceF conditions. Signs labelled ‘leader’ and ‘follower’ were placed on the floor in front of the participants, to remind them of their roles. Each singer only had one assigned part/musical voice. Singers were invited to face each other at a distance of 1.5 m in the visual condition and to face away from each other at the same distance in the non-visual contact (NVC) condition. Singers were not aware of the purpose of the study. The 12 takes were recorded singing by heart with short breaks between each of them. The experiment lasted approximately one hour.
Ethical approval for the study was obtained from the Physical Sciences Ethics Committee (PSEC) at The University of York (UK).
Analysis
For each recorded performance, two sets of data including the audio waveform from the microphones and the Lx waveform were imported into Praat as .wav files and fo was extracted with a time step of 1 ms. These data were imported into Microsoft Excel 2016 in the form of a tabular list of data points, including the fo in Hertz and corresponding timestamp. Asynchronies were then calculated to measure the phase synchrony between singers for NB, NE, ON and OF of the selected notes, as shown in . Those notes were chosen as being relevant to synchronization. The phase asynchrony was computed subtracting the follower’s timestamp values from the leader’s (leader minus follower) related to NB, NE, ON and OF of the selected notes. Negative values show that the leader preceded the follower, while positive values indicate that the follower is ahead of the leader.
The detection of ON, NB, NE and OF was automated through the application of TIMEX and the resulting timestamp data obtained from the note detection algorithm were then analysed in SPSS (SPSS 24, IBM, Armonk, NY). This event detection method was visually validated for the entire data set by the first author (SD). In addition, occasional pitch errors due to the musician singing a wrong note were also investigated by comparing the fo values and the audio recording with the notated score. Takes in which a pitch error occurred were excluded from the analysis. The overall error rate was less than 1%.
Outliers were identified based on the MAD (median absolute deviation), and asynchronies that fell more than 2.5 absolute deviations from the median were excluded. This approach is the most robust method to detect outliers, when the distribution is not normal and outliers are present (Citation23), as in this case.
Results
The following sections present the results of four sets of analyses that were run to measure the effect of VC and leader–follower relationships on interpersonal synchronization. The first set measures the precision of interpersonal synchronization, as indexed by the mean of absolute asynchronies. The second and third set of analyses investigate the amount of variation of interpersonal synchronization, as indexed by the standard deviation (SD) and the coefficient of variation (CV) of the absolute asynchronies. The fourth set of analyses focuses on the tendency to precede or lag a co-performer, as indexed by the median (Mdn) of signed asynchronies. Each set of analyses was run on ON, NB, NE and OF across each duo/performance in VC, NVC, UpperVoiceL and UpperVoiceF. Each set includes descriptive analyses and paired tests, including dependent paired t-tests and Wilcoxon’s signed rank tests. t-Tests were chosen to analyse differences between means within the absolute asynchronies data sample, whilst Wilcoxon’s tests were selected to assess median differences across signed asynchronies. These statistical tests were run for each condition. Results, using Bonferroni’s correction for multiple comparisons, are summarized in .
Table 3. Summary of the mean and median values per condition showing the differences across conditions and the levels of p values for the significant effects (*p < .05; **p < .01).
Visual contact
Duo 1
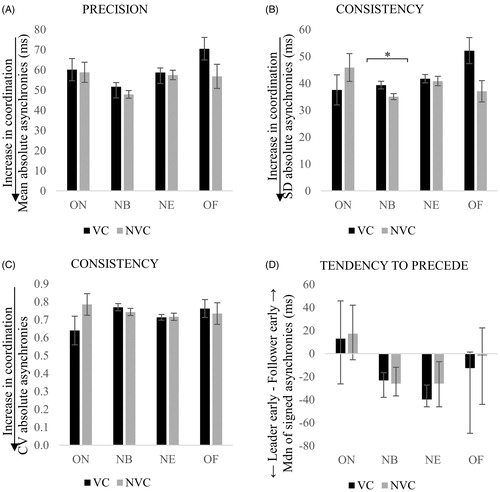
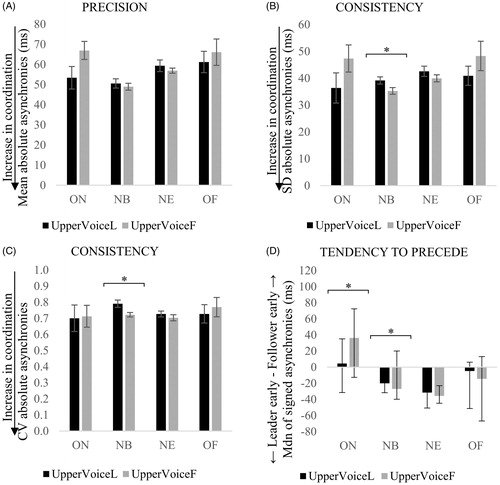
Mean, SD and CV of absolute asynchronies and median of signed asynchronies for duo 1, calculated for ON, NB, NE and OF during VC and NVC, are shown in . Results from the paired sample tests showed a significant effect of the presence of VC on the NB standard deviation asynchronies, t(23) = 2.43, p = .023, r = .45. As can be seen in , consistency of synchronization was found to significantly increase in the NVC condition for NB standard deviation asynchronies, compared with the VC condition. No significant effect was found for the remaining paired sample tests conducted across duo 1.
Figure 7. Interpersonal synchronization of duo 1 with visual contact (VC) and without visual contact (NVC) between singers, as indexed by the mean (A), standard deviation (B), coefficient of variation (CV) of absolute asynchronies (C) and median of signed asynchronies (D) calculated across ON, NB, NE and OF. Error bars represent the standard error of the mean for precision and consistency, and the interquartile range for tendency to precede. Smallest values in the precision and consistency of asynchronies indicate an increase in coordination, whilst negative values in the tendency to precede mean that the designated leader is ahead of the follower. *p < .05.
Duo 2
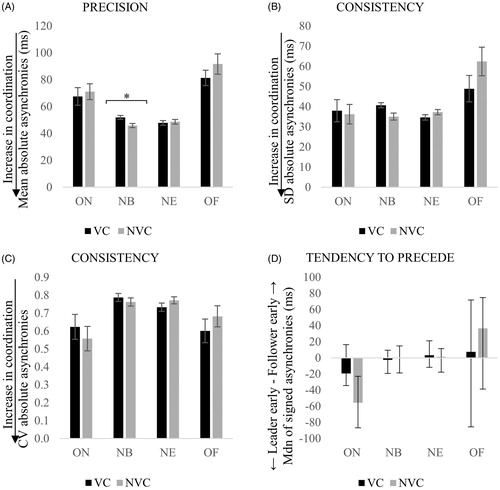
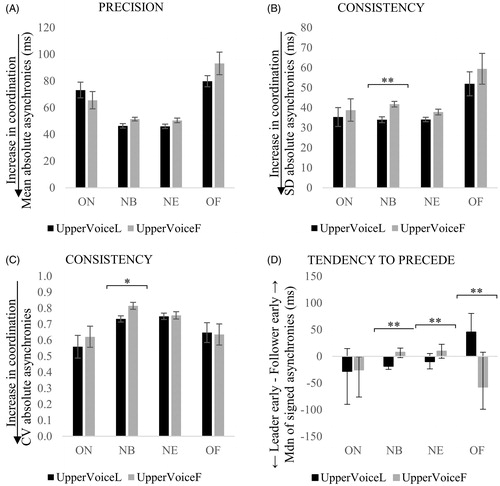
Median signed asynchronies, and mean, SD and CV of absolute asynchronies for duo 2 are shown in . Paired sample tests were run as for duo 1. The t-test on the mean NB asynchronies highlighted a significant effect of the presence/absence of VC, t(23) = 2.86, p = .018, r = .51, showing that precision improved in NVC. No significant effect was found for the remaining paired sample tests.
Figure 8. Interpersonal synchronization of duo 2 with visual contact (VC) and without visual contact (NVC) between singers, as indexed by the mean (A), standard deviation (B), coefficient of variation (CV) of absolute asynchronies (C) and median of signed asynchronies (D) calculated across ON, NB, NE and OF. Error bars represent the standard error of the mean for precision and consistency, and the interquartile range for tendency to precede. Smallest values in the precision and consistency of asynchronies indicate an increase in coordination, whilst negative values in the tendency to precede mean that the designated leader is ahead of the follower. *p < .05.
Leader–follower relationships
Duo 1
Mean, SD and CV of absolute asynchronies, and median signed asynchronies, averaged across the 48 performances in the UpperVoiceL and UpperVoiceF conditions for duo 1, are shown in . Paired sample t-tests yielded a significant effect of the instruction to act as leader or follower on both measures of consistency for NB: SD asynchronies, t(23) = 2.48, p = .0021, r = .46, and CV asynchronies, t(23) = 2.60, p = .016, r = .48. Consistency of NB synchronization was significantly better when the upper voice was instructed to follow, rather than to lead, as shown in .
Figure 9. Interpersonal synchronization for duo 1 with the upper voice as the designated leader (UpperVoiceL) or follower (UpperVoiceF), as indexed by the mean (A), standard deviation (B), coefficient of variation (CV) of absolute asynchronies (C) and median of signed asynchronies (D) calculated across ON, NB, NE and OF. Error bars indicate the standard error of the mean for precision and consistency, and the interquartile range for tendency to precede. Smallest values in the precision and consistency of asynchronies indicate an increase in coordination, whilst negative values in the tendency to precede mean that the designated leader is ahead of the follower. *p < .05.
Wilcoxon’s tests revealed a main significant effect of leader–follower instruction on the degree of preceding ON median asynchronies, T = 60, p = .010, and NB median asynchronies, T = 71, p = .024. One sample t-tests conducted on ON and NB for each condition showed that: (i) ON median asynchronies when the upper voice was instructed to follow were significantly different from 0, t(23) = 3.208, p = .004, r = .56; (ii) NB median values when the upper voice was instructed to lead were significantly different from 0, t(23)=–6.287, p = .000002, r = .80; and (iii) NB median data when the upper voice was instructed to follow were different from 0, t(23)=–11.578, p = 4.5028E–11, r = .92. These results demonstrate that when either voice was instructed to lead, the designated leader significantly tended to precede the designated follower at NB. However, when the upper voice was instructed to follow, the designated follower (i.e. the upper voice voice) significantly tended to precede at ON.
Duo 2
Median signed asynchronies, and mean, SD and CV of absolute asynchronies computed for duo 2 in UpperVoiceL and UpperVoiceF conditions are shown in . Paired sample tests were calculated as for duo 1. A significant effect of the leader–follower instruction was found on the consistency of NB synchronization, as indexed by: (i) SD asynchronies, t(23) = –4.40, p = .0002, r = .8; and (ii) CV asynchronies, t(23) = 2.65, p = .014, r = .48. Consistency of NB synchronization was better when the upper voice was instructed to lead and the lower voice to follow.
Figure 10. Interpersonal synchronization for duo 2 with the upper voice as the designated leader (UpperVoiceL) or follower (UpperVoiceF), as indexed by the mean (A), standard deviation (B), coefficient of variation (CV) of absolute asynchronies (C) and median of signed asynchronies (D) calculated across ON, NB, NE and OF. Error bars indicate the standard error of the mean for precision and consistency, and the interquartile range for tendency to precede. Smallest values in the precision and consistency of asynchronies indicate an increase in coordination, whilst negative values in the tendency to precede mean that the designated leader is ahead of the follower. *p < .05; **p < .01.
Finally, as shown in , Wilcoxon tests revealed a significant effect of leader–follower instruction on the degree of preceding/lagging: (i) median NB asynchronies, T = 38.5, p = .001; (ii) median NE asynchronies, T = 33, p = .001; and (iii) median OF asynchronies, T = 42, p = .002. One sample t-tests on median ON, NB, NE and OF were conducted as for duo 1 to observe whether the tendency to precede/lag was significant in each condition. Results showed that: (i) NB asynchronies were significantly different from 0 when the upper voice was instructed to lead, t(23) = –3.564, p = .002, r = .60, and to follow t(23) = –2.718, p = .012, r = .49; (ii) NE value were significantly different from 0 when the upper voice was instructed to lead, t(23)=–2.845, p = .009, r = .51, and also to follow, t(23) = –3.144, p = .005, r = .55; and (iii) OF asynchronies were significantly different from 0 when the upper voice was instructed to lead t(23) = 4.695, p = .00009, r = .70. These results demonstrate that when either voice was instructed to lead, the upper voice significantly tended to precede the lower voice at NB and NE. However, when the upper voice was instructed to lead, the designated leader tended to lag at OF. These results show a complex pattern of leader and follower relationships, rather than a clear separation of roles, which seems to be independent of the researcher’s instruction to lead or follow.
Piece learning effects
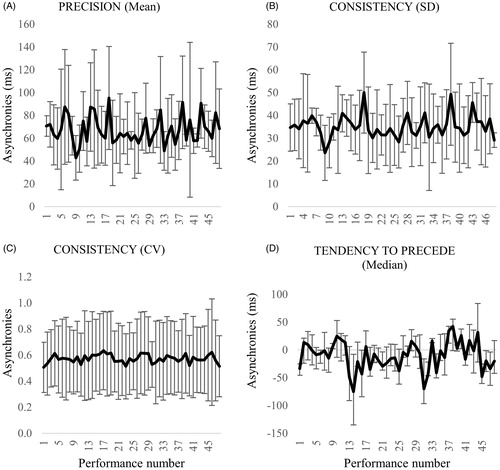
Prior to investigating the effect of VC and leader–follower relationships, data were examined for evidence of changes in interpersonal synchrony across the course of the 48 repeated performances. The learning effect was investigated averaging the asynchronies for each performance and for each synchronization measure (i.e. precision, consistency and tendency to precede). Results show that there were no discernible learning effects for duo 1 or duo 2, as shown in and .
Figure 11. Measures of interpersonal synchrony for duo 1 as precision, consistency and tendency to precede per performance. Error bars of precision and consistency represent standard error of the mean, whilst error bars of the tendency to precede indicate interquartile range of the median.
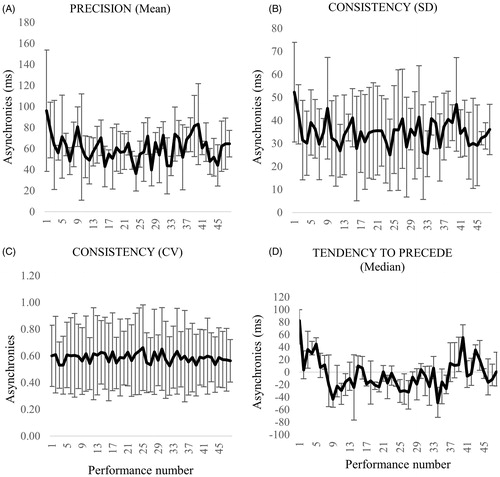
Figure 12. Measures of interpersonal synchrony for duo 2 as precision, consistency and tendency to precede per performance. Error bars of precision and consistency represent standard error of the mean, whilst error bars of the tendency to precede indicate interquartile range of the median.
Discussion
The aim of the study was to describe and test a novel algorithm, TIMEX, that extracts onsets and offsets of phonation and note beginnings and endings from monoaural recordings of ensemble singing.
The algorithm presented in this paper is based on the fundamental frequency profile. It has been developed on the basis of a purely mathematical definition of a local max/min, with the addition of a series of rules to ignore points that the definition would retain but would not represent a change of note in the score being performed. The rules have been conceived based on the issues encountered during the first processing attempts, such as local spikes, vibrato, Lx signal interruptions and onset/offset fluctuation range. Each of these rules is associated with the definition of a threshold parameter to enforce the rule, which has been tweaked by trial and error to provide the most accurate results, comparing the output of the algorithm for the selected recording to the score that was performed.
When testing the algorithm and in the case study presented, the same parameters were used for the four semi-professional performers involved, and for the upper and lower voice parts. The fluctuation threshold and the vibrato frequency threshold can be expected to be different for opera singers, who might exhibit a larger vibrato extent. Optimal values regarding rest, fluctuation and spiking range are expected to vary across pieces, especially if the tempo and duration of rests and notes at the beginning and ends of phrases (and therefore onset and offset of phonation) are very different from the two-part piece used for this set of recordings.
The evaluation of TIMEX in the present study showed an overall F-measure of 78% within a tolerance window of 50ms, which seems very promising in light of the state-of-the-art techniques presented at MIREX in 2016 yielding F-measures of around 60%. Direct comparisons with other methods cannot be made unless the same data set is used; comparative evaluations are planned in the future.
Other avenues of research should take into account issues relating to the small fluctuations within the onsets; TIMEX limits the detection to local max/min points, whilst the ground truth considers also the steepness of the fo profile, by detecting onsets based on the rate of change of the curve. This could be addressed by developing the algorithm further using the second derivative of the waveform in addition to the max/min points. A future direction of this research should also consider the analysis of the singing voice with lyrics. It is reasonable to expect that this algorithm will work well with percussive instruments, although they would probably require the use of different thresholds for the same rules. Whilst the issues of singing onset detection cannot be considered solved by this system, its potential is promising.
Furthermore, this study described and tested a new protocol for the analysis of synchronization in singing ensembles based on the combined application of electrolaryngography and acoustics analysis, and the TIMEX algorithm. The use of electrolaryngography allowed the identification of the contribution of individual voices, avoiding the complication of polyphonic recordings. This set-up was very successful: the signal failed on only 0.7% of the entire set of recordings, during which the analysis had to rely on the acoustic signal, which could potentially suffer from audio bleed from the other singers. In order to ensure accurate and reliable recordings of vocal fold vibration in the Lx signal, the proper placement of the electrodes is fundamental. The electrodes should be placed in the thyroid region behind the vocal folds in the middle of each thyroid lamina (Citation24). Furthermore, consideration should be given to the fact that the Lx signal may be too weak or noisy to be reliable for use on certain populations, including children (Citation25), sopranos (Citation26), and when a thick layer of subcutaneous tissue is present in the neck (Citation27,Citation24).
Finally, the role of VC and leader–follower relationships was investigated in the two singing duets. Synchronisation was assessed by analysing timings between singers in each duo, as indexed by ON, NB, NE and OF asynchronies calculated per note. The potential effect of VC and leadership was assessed through repeated performances of the same piece according to the researchers’ instruction to act as the leader or the follower of the performance, and to sing with or without VC between performers.
Surprisingly, consistency of NB synchronization as indexed by SD asynchronies was significantly better without VC in duo 1. Similarly, precision of NB asynchronies was better in duo 2. Greater consistency of NB synchronisation in the absence of VC corroborates previous investigations (Citation19) with piano duos analysing the effect of VC on CV asynchronies, and might be understood in light of the common requirement to practice with closed eyes and to perform with invisible musicians in recording studios. In addition, the regular rhythmical structure of the piece chosen for the study might have altered, or eliminated, any benefit arising from VC between singers. Previous research suggests eye cues are beneficial when irregular musical timings are being performed (Citation28). However, the fact that NB synchronization was significantly better without VC between singers remains surprising, since previous research (Citation19) has shown no effect of VC on median unsigned asynchronies, unlike an apparent benefit from performers not seeing each other. In this condition, another factor, such as audible breathing, might contribute to an extent by boosting interpersonal coordination when VC is removed. This study could therefore be extended to investigate the effects of VC based on the level of auditory feedback from the co-performer’s breathing.
Leader–follower relationships also had a significant effect on the consistency of synchronization between singers. When the upper voice led the performance, consistency of NB asynchronies, as indexed by SD and CV values, was significantly worse in duo 1, but better in duo 2, suggesting the need for further investigations.
Lastly, this study highlighted contrasting effects of the instruction to act as leader or follower on the tendency to precede a co-performer temporally at ON and NB in duo 1, and to precede temporally at NB, NE and OF in duo 2. The designated leader of duo 1 significantly tended to lag the designated follower at ON but precede at NB, when either voice was instructed to lead. But the trend in duo 2 was very different to duo 1. When the upper voice was the leader of duo 2, the leader tended to precede the follower at NB and NE; when the upper voice followed, the leader (i.e. the lower voice) tended to lag at NB and NE, but precede at OF. Furthermore, these contrasting patterns of leader–follower relationships show bidirectional adaptations between performers rather than a clear separation of roles, corroborating previous studies analysing the synchronization of onsets among string quartets (Citation29–32). This also suggests that the reciprocal and iterative adjustments are not limited to the attack of the note, but to the full performance of notes, including NB, NE and OF in addition to ON.
Finally, the fact that the researcher’s instruction to act as leader or follower of the performance was not associated with the leader showing a significant tendency to precede at note onsets contrasts with findings from piano duos (Citation17) whereby musicians assigned the role of leader and asked to play the melody preceded the onsets of those assigned the role of follower performing the accompaniment. These contrasting results might be understood in light of the different materials used in the current experiment, which lacked well-defined melody-accompaniment parts, suggesting that leaders might tend to precede at onsets only when the musical structure facilitates leadership roles.
The restricted data set collected from only two singing duets prohibits generalizable conclusions, however, the results suggest that the method being tested was successful and will be useful for future research in this area. It will also be necessary for subsequent research to investigate the consistency of behaviours across different musical excerpts, manipulating the musical characteristics of the piece being performed, and across different types of ensembles (such as trios, quintets and different instrumentals combinations) in order to verify whether the observed patterns typify the ensemble and/or the music. Future research should also examine whether those complex adjustment behaviours vary with increasing levels of musicals expertise.
Conclusions
This paper describes and tests a novel method for onset and offset detection of ensemble singing, which has been applied in a case study analysing synchronization between singers during vocal ensemble performance. The method proved to be a valuable and successful tool, recommendable for future investigations. The presented case study suggests that controlling VC and instructing singers to act as leader or follower might significantly affect synchronization between singers. Surprisingly, the consistency and precision of the synchronization of note beginnings increased when there was no VC between singers in the case of, respectively, duo 1 and duo 2. Results also revealed patterns of bidirectional adaptations between singers, which were different across duos. Although it is not possible to draw any general conclusions from this preliminary work, these findings illustrate the need for future studies in this area and demonstrate the success and potential value of this new method.
Acknowledgements
The authors thank the singers who took part in the experiments, Andrew Chadwick for the set-up of the apparatus, and Giorgio Mauri for the implementation of the algorithm.
Disclosure statement
The authors confirm they have not financial or other conflicts of interest in relation to the work reported herein.
Additional information
Funding
References
- Daffern H, Brereton J. Testing a new protocol to measure tuning response behaviour in solo voice ensemble singing. Proceedings of the Stockholm Music Acoustics Conference SMAC; 2013. p. 231–7.
- Howard DM. Intonation drift in a capella soprano, alto, tenor, cass quartet singing with key modulation. J Voice 2007;21:300–15.
- Howard DM. Equal or non-equal temperament in a capella SATB singing. Logoped Phoniatr Vocol 2007;32:87–94.
- Howard DM. Larynx closed quotient variation in quartet singing. 19th International Congress on Acoustics; 2007 Sep 2–7; Madrid.
- D’Amario S, Daffern H. Using electrolaryngography and electroglottography to assess the singing voice: a systematic review. Psychomusicol Music Mind Brain 2017;27:229–43.
- Bello JP, Daudet L, Abdallah S, et al. A tutorial on onset detection in music signals. IEEE Trans Speech Audio Process 2005;13:1035–46.
- Masri P. Computer modeling of sound for transformation and synthesis of musical signal [Ph.D. dissertation]. Bristol (UK): Univ. of Bristol; 1996.
- Bello JP, Duxbury C, Davies M, Sandler M. On the use of phase and energy for musical onset detection in the complex domain. IEEE Signal Process Lett 2004;11:553–6.
- Bello JP, Sandler M. Phase-based note onset detection for music signals. IEEE Int Conf Acoustics, Speech, and Signal Processing (ICASSP-03); 2003; Hong Kong.
- Klapuri A. Sound onset detection by applying psychoacoustic knowledge. 1999 IEEE Int Conf Acoust Speech, Signal Process Proceedings ICASSP99 (Cat No99CH36258) [Internet]; 1999, vol. 6. p. 3089–92. Available at: http://ieeexplore.ieee.org/lpdocs/epic03/wrapper.htm?arnumber=757494%5Cnhttp://ieeexplore.ieee.org/document/757494/.
- Abdallah S, Plumbley M. Unsupervised onset detection: a probabilistic approach using ICA and a hidden Markov classifier. Proceedings of Cambridge Music Processing Colloquium; 2003.
- Friberg A, Schoonderwaldt E, Juslin PN. CUEX: an algorithm for automatic extraction of expressive tone parameters in music performance from acoustic signals. Acta Acust United with Acust 2007;93:411–20.
- Dixon S. Learning to detect onsets of acoustic piano tones. In: Buyol CL, Loureiro R, eds. Proceedings of the MOSART Workshop on Current Directions in Computer Music Research. Barcelona, Spain: PompeuFabra University (UPF-IUA); 2001. p. 147–51.
- Toh CC, Zhang B, Wang Y. Multiple-feature fusion based onset detection for solo singing voice. In: Bello J, Chew E, Turnbull D, eds. International Symposium on Music Information Retrieval. Philadelphia (PA): Drexel University; 2008. p. 515–20.
- Rasch RA. Synchronization in performed ensemble music. Acta Acust United with Acust 1979;43:121–31.
- Rasch RA. Timing and synchronisation in ensemble performance. In: Sloboda JA, ed. Generative processes in music. Oxford (UK): Oxford University Press; 1998. p. 70–90.
- Goebl W, Palmer C. Synchronization of timing and motion among performing musicians. Music Percept 2009;26:427–38.
- Bishop L, Goebl W. When they listen and when they watch: pianists’ use of nonverbal audio and visual cues during duet performance. Music Sci 2015;19:84–110.
- Keller PE, Appel M. Individual differences, auditory imagery, and the coordination of body movements and sounds in musical ensembles. Music Percept 2010;28:695–701.
- Boersma P. PRAAT, a system for doing phonetics by computer. Glot Int 2001;5:341–7.
- Boersma P, Weenink D. Praat: doing phonetics by computer [Internet]; 2013. Available at: http://www.praat.org/.
- MIREX. Onset detection F-measure per class; 2016. Available at: http://nema.lis.illinois.edu/nema_out/mirex2016/results/aod/resultsperclass.html.
- Leys C, Ley C, Klein O, et al. Detecting outliers: do not use standard deviation around the mean, use absolute deviation around the median. J Exp Soc Psychol 2013;49:764–6.
- Colton RH, Conture EG. Problems and pitfalls of electroglottography. J Voice 1990;4:10–24.
- Howard DM. Electroglottography/electrolaryngography. In: Fried M, Ferlito A, eds. The larynx. 3rd ed. San Diego (CA): Plural Press; 2009. p. 227–43.
- Pabst F, Sundberg J. Tracking multi-channel electroglottograph measurement of larynx height in singers. Scand J Logop Phoniatr 1993;18:143–52.
- Askenfelt A, Gauffin J, Sundberg J. A comparison of contact microphone and electroglottograph for the measurement of vocal fundamental frequency. J Speech Hear Res 1980;23:258–73.
- Bishop L, Goebl W. When they listen and when they watch: Pianists' use of nonverbal audio and visual cues during duet performance. Music Sci 2015;19:84–110.
- Glowinski D, Mancini M, Rukavishnikova N, et al. Analysis of dominance in small music ensemble. Proc Second Work Affect Interact Nat Environ ACM ICMI 2012 (Santa Monica, CA) [Internet]; 2012. Available at: http://www.siempre.infomus.org/assets/Documents/Papers/AFFINE_Glowinski.pdf.
- Glowinski D, Mancini M, Cowie R, et al. The movements made by performers in a skilled quartet: a distinctive pattern, and the function that it serves. Front Psychol 2013;4:841.
- Timmers R, Endo S, Bradbury A, Wing AM. Synchronization and leadership in string quartet performance: a case study of auditory and visual cues. Front Psychol 2014;5. Article 645.
- Timmers R, Endo S, Wing AM. Temporal coordination in string quartet performance. In: International Symposium on Performance Science [Internet]; 2013. p. 569–74. Available at: http://mediatum.ub.tum.de/doc/1207051/1207051.pdf.