Abstract
Background. Assessment of the severity of mitral regurgitation by echocardiography can be technically demanding in certain patients and supplementary methods are therefore desirable. This study addressed the agreement between magnetic resonance imaging (MRI) and echocardiography, and their relations to natriuretic peptides (NT-proANP and NT-proBNP), in quantifying severe mitral regurgitation. Methods. Eighteen patients with severe mitral regurgitation scheduled for surgery underwent MRI, echocardiography and assay of natriuretic peptides preoperatively for clinical assessment. Results. MRI and echocardiography were comparable in measuring severity of regurgitation qualitatively but not quantitatively, mitral regurgitant fraction (mean difference 27.5 (11) ml). There was a correlation between increasing regurgitant fraction on MRI and increased levels of plasma NT-proANP and NT-proBNP. In echocardiography, increasing vena contracta width and increasing PISA correlated to increased levels of plasma NT-proANP and NT-proBNP. No other correlation was found between measures on MRI and echocardiography and natriuretic peptides. Conclusions. MRI and echocardiography were comparable grading the severity of mitral regurgitation with qualitative measures but not with quantitative measures. MRI might be a complement to echocardiography when a more distinct measure of the regurgitant volume is needed, as in paravalvular leakage.
In patients with mitral regurgitation (MR), echocardiography is the standard method used to quantify the severity of the disease Citation1. The current policy in patients with severe MR is to operate promptly after the onset of symptoms or in the presence of asymptomatic left ventricular (LV) dysfunction Citation2. This rationale underscores the need for accurate assessment of the severity of MR. To quantify the regurgitation with echocardiography can be difficult in certain patients and it would be of great clinical value if other methods were available to aid in this assessment Citation1. In earlier studies, both magnetic resonance imaging (MRI) and measurement of natriuretic peptides have been used separately in attempts to assist in the quantification of MR Citation3–9.
MRI has been used in clinical cardiology to measure transvalvular pressure gradients in stenotic valves and to estimate valvular regurgitant fractions Citation3–5, Citation7, Citation10–12. Despite the potential of MRI for routine assessment of valve disease, widespread clinical implementation of this method requires availability, ease of use, and agreement with the current standard namely echocardiography.
The natriuretic peptides, atrial natriuretic peptide (ANP) and brain natriuretic peptide (BNP), are synthesised and secreted in response to increased cardiac wall stress. Their circulating concentrations are elevated in the presence of LV dysfunction and have also been shown to increase with increasing severity of MR Citation8, Citation9, Citation13, Citation14. Since comparison of two diagnostic methods is a matter of some controversy, natriuretic peptides might serve as a reference with which the findings on MRI and echocardiography can be compared. No study has addressed the relation of natriuretic peptides to MRI and echocardiographic measures in patients with severe MR.
The primary aim of this study was to compare the agreement of MRI and echocardiography in quantifying mitral regurgitation in patients with severe MR, and to study the relation of these two methods to natriuretic peptides.
Material and methods
Patients
Patients referred to the Department of Cardiothoracic Surgery in Uppsala, Sweden, for mitral valve surgery between September 2004 and April 2005 were invited to participate. Eighteen consecutive patients who underwent elective, primary surgery for mitral regurgitation were enrolled in the study. There were four women and 14 men, with a mean age of 66 years (32–73). The cause of the MR was mitral valve prolapse in 12/18 (66%). The majority of the patients 11/18 (61%) were in NYHA class IIIB, and 7/18 were in NYHA class IIIA. One-third of the patients (6/18) had hypertension. Exclusion criteria were: patient rejection, patient withdrawal, aortic valve disease, primary right heart disease, atrial fibrillation, dominant concomitant ischaemic heart disease with symptoms, or unavailability of MRI. The study protocol was approved by the Ethics Committee of Uppsala University Hospital and all patients gave informed consent. All patients underwent MRI, echocardiography, and blood sampling at rest for measurement of NT-proANP and NT-proBNP one day prior to surgical intervention. Blood pressure and heart rate were measured before and after each examination to ensure that no major change in the haemodynamic status had occurred. Analyses were performed by one experienced echocardiographer and one experienced cardiac MRI radiologist, who were blinded to the patients’ symptoms, natriuretic peptide levels and the results from each others’ imaging examinations.
Echocardiographic data
All patients underwent echocardiographic and Doppler examination using a standard protocol on commercially available systems (Philips SONOS 5500, rev D). The LV dimensions at end-systole and end-diastole were measured from the M-mode according to the American Society of Echocardiography: Recommendations for evaluation of the severity of native valvular regurgitation with two-dimensional and Doppler echocardiography Citation1. The largest left atrial (LA) dimensions (antero-posterior dimension and antero-lateral dimension) were measured in the apical four-chamber projection. The LV end-systolic and end-diastolic volumes and ejection fraction (EF) were derived from the apical four-chamber view using the modified Simpson single plane method. The left ventricular outflow tract (LVOT) diameter was measured in the parasternal long-axis view and then converted to LVOT area (A LVOT) according to the formula A = Πr2. VTI LVOT, the velocity-time integral of flow at the left ventricular outflow tract, was calculated according to the continuity equation approach. The severity of MR was assessed from a subjective combination of LA and LV dimension coupled with the width /area of the vena contracta width Citation15 and the proximal isovelocity surface area (PISA) radius (measured as the PISA radius, r2, at the first aliasing semicircle) Citation16. Total stroke volume (TSV) was calculated as the difference between the end-diastolic and end-systolic volumes. The antegrade stroke volume (ASV) was calculated as the product of the LVOT diameter and the VTI LVOT. The mitral regurgitation volume (MRV) was calculated as the difference between total and antegrade stroke volume. The mitral regurgitation fraction (MRF) was calculated as the proportion of MRV relative to TSV (percentage).
Cardiac magnetic resonance imaging methods
All magnetic resonance imaging (MRI) was performed with a 1.5-T MRI system (Gyroscan Intera; Philips Medical Systems, Best, the Netherlands) with a 25 mT/m gradient system. Patients were examined in the standard SENSE-cardiac coil in the supine position. Vector-ECG (with retrospective gating) was used for cardiac triggering.
After initial surveys, the cardiac function was examined with steady-state free precession sequences (Balanced Turbo Field Echo sequences (bTFE)) in the short and long axes of the heart. The short axis (SA) sequence consisted of 8 mm thick slices with a slice gap of 2.5 mm. The number of slices was adjusted to cover the heart from the apex to the atria. Two slices were acquired per breath-hold (14 s) with an acquired in-plane resolution of 2.27×1.81 mm (reconstructed to 1.56×1.56 mm). The following parameters were used: TR = shortest (∼3.6 ms), TE = shortest (∼1.8 ms), flip angle = 70°, 18 phases/cardiac cycle, field of view (FOV) = 400 mm, matrix = 256, parallel imaging (SENSE) factor = 2.
The long axis bTFE sequence consisted of 8 mm thick slices with a slice gap of 1.5 mm covering the heart. One slice was acquired per breath-hold (12 s) with an acquired in-plane resolution of 2.5×1.67 mm (reconstructed to 1.56×1.55 mm). The following parameters were different from the SA sequence: TR = shortest (∼3.1 ms), TE = shortest (∼1.56 ms), 60 phases/cardiac cycle.
Blood flow through the aorta was measured by a velocity encoded (QF = quantitative flow) gradient echo sequence. One slice was acquired in the aorta during free breathing. The slice was planned in a frontal survey as a transverse slice perpendicular to the direction of the aorta, corrected in the sagittal survey. The following parameters were used: TR = shortest (∼9.5 ms), TE = shortest (∼6.1 ms), flip angle = 20°, 30 phases/cardiac cycle, FOV = 300 mm, matrix = 128, slice thickness = 6 mm, acquired in-plane resolution = 2.34×3.34 mm (reconstructed to 2.34×2.34 mm) and velocity encoding = 250 cm/s.
The image evaluation was performed on a separate workstation (ViewForum, Philips Medical Systems, Best, the Netherlands).
Left ventricular function was calculated semi-automatically by segmenting the epicardial and endocardial contours using the contour segmenting tool. When this resulted in errors, manual editing was used. The first phase was defined as end-diastole, and the visually smallest left ventricular volume was defined as end-systole. The left ventricular end-systolic diameter was measured in a short axis image. The slice basal to the papillary muscles (or of the papillary muscles) was used for this measurement. The parameters left ventricular end-diastolic volume, left ventricular end-systolic volume were supplied by the software
Aortic flow was measured by manually segmenting the lumen of the aorta in the available phases and the parameter aortic flow was supplied by the software.
The length and width of the left atrium were measured in the long axis 4-chamber images at end-systole. The time chosen was the time closest to the end-systolic time during the evaluation of the short axis images. The length and width were perpendicular to each other. The length was measured by following a line from the middle of the mitral valve or the beginning of the mitral regurgitation, passing through the centre of the atrium to the dorsolateral wall of the left atrium. The width was the longest length perpendicular to this line. The mid-atrial slice or one of the adjacent slices was chosen, whichever had the largest dimensions. When the largest measurement included the ostium of a pulmonary vein, the measurement was positioned in the ostium and not within the vein distal to the ostium.
Mitral regurgitation was calculated by the following formulas: Mitral regurgitation volume = stroke volume-aortic flow; Mitral regurgitation fraction = mitral regurgitation volume/stroke volume.
Measurement of natriuretic peptide levels
Venous blood samples were collected in the morning on the day before surgery with the patient still resting. The samples were drawn into chilled Vacutainers tubes, placed immediately on ice, and centrifuged within 20 min at +4°C. The plasma was stored at −80°C before being assayed for NT-proBNP (Modular, Roche diagnostics, Basel, Switzerland) and NT-proANP Citation17.
Statistical methods
Data are presented as mean ±SD. Each variable was checked for normality using probability plots and the Shapiro-Wilk normality test. Agreement of paired dependent variables is displayed as Bland-Altman plots with differences between paired observations plotted along the y axis, against mean values of the paired observations plotted on the x axis Citation18. In a case with good agreement, the difference is close to zero. The 95% confidence intervals calculated as 1.96×SD of the differences ware indicated by horizontal lines. Correlations of echocardiography and MRI measures with peptides were tested by Spearman's correlation coefficient rp. Differences in the strength of the correlations of NT-proANP and NT-proBNP to different parameters were tested with Steiger's test. A two-tailed probability value <0.05 was considered statistically significant.
Results
Left ventricular volumes and aortic flow
Overall, MRI showed larger volumes than echocardiography. With MRI the mean left ventricular end-diastolic (LVEDV) and end-systolic volumes (LVESV) were 225.6 (54.5) ml and 66.4 (22.2) ml, as compared to 149.1 (43.8) ml and 55.2 (17.2) ml respectively, with echocardiography (). The mean difference of LVEDV between the methods was 74.7 ml. For LVESV there was a mean difference of between the methods 10.1 ml. Mean aortic flow with echocardiography was 76.9 (28.4) ml and with MRI it was 75.3 (20.0) ml. The agreement in this parameter showed a mean difference of 1.4 ml.
Table I. Echocardiographic and magnetic resonance imaging (MRI) data of the study population (n = 18).
Left atrial size
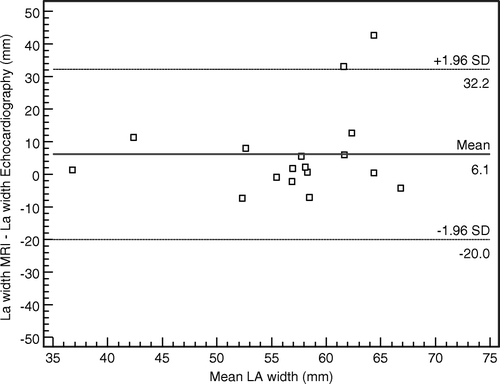
For atrial size, MRI yielded consistently somewhat larger measures than echocardiography as shown in . The agreement between the two methods showed a mean difference of 6.1 mm for atrial width, compared to a mean difference of 12.3 mm for atrial length ().
Figure 1. Bland-Altman analysis of agreement of methods in measuring left atrial width.
Regurgitant fraction
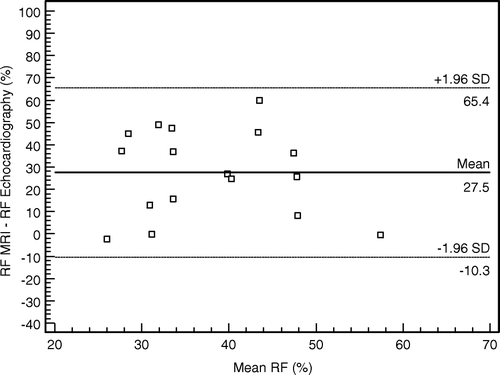
The two methods were not comparable in the measurement of the regurgitant fraction (). The mean regurgitant fraction was 51.6% (12.5) with MRI and 23.3% (13.8) with echocardiography (). A regurgitant fraction of over 40% was found in 2/18 patients with echocardiography, but in 16/18 patients with MRI.
Figure 2. Bland-Altman analysis of agreement of methods in measuring regurgitant fraction.
Natriuretric peptides
All 18 patients underwent preoperative blood sampling for natriuretic peptides at rest. The mean NT-proANP was 1033(160) pmol/L and the mean NT-proBNP was 368(121) pmol/L.
Echocardiography and natriuretic peptides
Correlation coefficients for the association between each of the natriuretic peptides and echocardiographic measures are presented in . No statistically significant correlation was found between LVEDV, LVESV, aortic flow, regurgitant fraction, atrial length or width as measured by echocardiography and either NT-proANP or NT-proBNP.
Table II. Correlations of natriuretic peptide levels to echocardiographic and magnetic resonance imaging measures of severity of mitral regurgitation and left ventricular function.
The mean PISA was 5.5 (1.0) mm (), and this correlated well to both NT-proANP (r = 0.72, p = 0.002) and NT-proBNP (r = 0.68, p = 0.003) () (a,b).
Figure 3. Correlation between PISA and NT-proANP (r = 0.72, p = 0.002). b. Correlation between PISA and NT-proBNP (r = 0.68, p = 0.003).
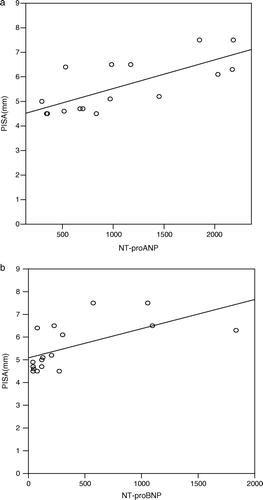
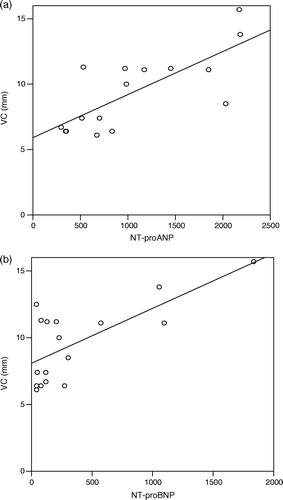
The mean vena contracta width was 9.6 (2.9) mm. There was a significant correlation between vena contracta width and both NT-proANP (r = 0.69, p = 0.0003) and NT-proBNP( r = 0.70, p = 0.002) ( a,b). There was no difference in strength between the correlation of NT-proANP or NT-proBNP to PISA (p = 0.77) or vena contracta width (p = 0.34).
Figure 4. Correlation between vena contracta width and NT-proANP (r = 0.67, p = 0.003). b. Correlation between vena contracta width and NT-proBNP (r = 0.70, p = 0.002).
Both PISA(r = 0.78, p < 0.0001) and vena contracta width (r = 0.62, p = 0.008) correlated well to regurgitant fraction as measured by MRI.
MRI and natriuretic peptides
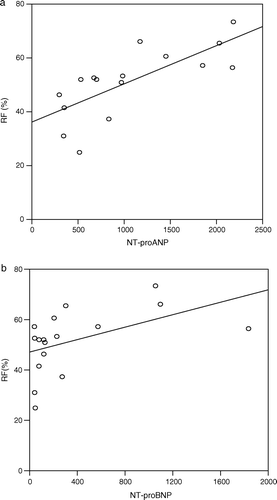
There was no significant correlation between LVEDV, LVESV, aortic flow, atrial length or atrial width as measured by MRI and NT-proANP or NT-proBNP (). The regurgitant fraction measured with MRI correlated well to both NT-proANP (r = 0.84, p = 0.0001) and NT-proBNP (r = 0.57, p = 0.01) (a,b) that is, NT-proANP and NT-proBNP rose with increasing regurgitant fraction. There was no difference in the strength of the correlations of NT-proANP or NT-proBNP to the regurgitant fraction (p = 0.11).
Figure 5. Correlation between regurgitant fraction on MRI and NT-proANP (r = 0.84, p = 0.0001). b. Correlation between regurgitant fraction on MRI and NT-proBNP (r = 0.57, p = 0.01).
Discussion
The principal findings in the present study were as follows:
MRI and echocardiography were comparable in measurement of the severity of regurgitation using qualitative measurements;
There was an agreement between the two methods regarding atrial width and aortic flow;
The regurgitant fraction as measured by MRI correlated well to both NT-proANP and NT-proBNP;
MRI and echocardiography did not compare in measuring LVEDV in patients with severe mitral regurgitation;
With echocardiography the PISA and vena contracta width, but not LVEDV, LVESV, regurgitant fraction, and atrial size, correlated well to NT-proANP and NT-proBNP.
An earlier study by Gelfand et al. Citation19 concluded that the two methods are comparable when using a grading not based on specific measures of volumes or measures, such as mild moderate and severe, this could also be confirmed in our study. However, in our study on patients with severe mitral regurgitation, MRI and echocardiography were not comparable in specific measures such as LVEDV which resulted in a non comparable regurgitant fraction since LVEDV forms the basis of the calculation of the regurgitant fraction. The same was found in the only other study comparing quantitative Doppler examination and MRI in MR patients Citation4. In that study, there was a greater difference between the methods in patients with severe MR than in those with only mild or moderate MR. It seems as if the patients with severe MR and therefore large regurgitant volumes are more difficult to assess properly than patients with less advanced disease.
MRI
With MRI, the regurgitant fraction can be calculated by two techniques; namely by subtracting the right from the left ventricular stroke volume or by subtracting the aortic flow volume from left ventricular stroke volume Citation3, Citation20, Citation21. In this study the latter was used, since it eliminates problems associated with right-sided regurgitation and the somewhat lower reproducibility of right ventricular measurements. Earlier studies have shown that cardiac output and regurgitant volume can be calculated with an error of 5–10% Citation12. Also, the MRI technique has been shown to be accurate and reliable for left ventricular volume assessment; which is not always as true for echocardiography Citation1, Citation3–6. In our study, the patients were accepted for surgery on the basis of severe mitral regurgitation. There is therefore reason to believe that the MRI results regarding the regurgitant fraction were more accurate; with 89% of the patients having a regurgitant fraction over 40%, i.e. severe regurgitation Citation22, as compared to only 11% of the patients when calculated with echocardiography. Thus, in clinical practice, MRI in patients with mitral regurgitation might be useful when a discrepancy arises between echocardiography and clinical assessment. This might be the case when the regurgitant jet is very eccentric, which can lead to significant underestimation of the severity of regurgitation by echocardiography Citation1.
Echocardiography
The echocardiographic measures of LVEDV were somewhat underestimated in this study and led to an underestimation of the calculated regurgitant volumes, with only 11% of the patients classified as having severe regurgitation. This is in contrast to findings in an earlier study in which quantitative Doppler examination was compared with LV volume measurements, where the latter measurements were shown to be reliable for calculating the regurgitant volume Citation23. However, it is known that measurements of LV volumes with echocardiography have the potential pitfall of underestimating the true left ventricular volume and hence the severity of regurgitation Citation1. The difference in end-diastolic volume might be due to a number of reasons. We believe that this is a result of that this measurement is performed manually with tracing of the endocardium done by the echocardiographist himself. This is particurlarly sensitive when considering that the end-diastolic heart is distinct in contures than the end-systolic heart.
In the MRI method, the contouring or tracing of the endocardium is done automatically by a program supplied by the software. This program is much more sensitive since it measures the difference in the border between the endocardium and the blood automatically based on the colour in the picture. Thus in our study, echocardiography and MRI could not compare in quantifying the regurgitant fraction, since this is based on a calculation of left ventricular volumes.
However, and most importantly, the PISA method and vena contracta width correlated well to both the regurgitant fraction on MRI and the plasma levels of natriuretic peptides. Thus, all patients were correctly classified with echocardiography as having severe MR quantitatively although the distinct measures of regurgitant volumes were underestimated.
Natriuretic peptides
Since comparing two diagnostic methods per se might be a matter of some controversy, the natriuretic peptides were used in our study to aid the comparison between MRI and echocardiography. Few studies have addressed the relation between cardiac peptides and different stages of mitral regurgitation. Brooks et al. measured BNP levels in patients with MR but they did not evaluate the relation between peptides and the severity of the MR Citation9. Moreover, Sutton et al. found in a recent study that the concentrations of natriuretic peptides increased with increasing severity of MR Citation8. Concerning the echocardiographic measures in our study, the natriuretic peptides correlated well to the width of the vena contracta and to the radius of PISA. By contrast, no association was found between peptides and LV volumes, which is consistent with findings in the recent study by Sutton et al. on cardiac peptides and mitral regurgitation Citation8.
However, we found that natriuretic peptides increased with an increasing regurgitant fraction on MRI; which strengthens the validity of MRI-measured regurgitant fraction.
In our study, NT-ANP was to a greater extent increased than NT-proBNP in patients with severe MR. A possible explanation for this is that the atrial wall stress is possibly more pronounced than the ventricle wall stress at this stage of the disease. This is reasonable, since all patients in the study had relatively well preserved left ventricular function. Hypothetically, the observation of a change in the relation between ANP and BNP, since BNP increases with the development of LV dysfunction; might be a possibility to detect early left ventricular dysfunction in patients with severe MR. The results of our study suggest that natriuretic peptides may add to the information obtained by imaging methods, although it might be premature to use them to guide the timing of surgery.
Comparing two methods
Difficulties are encountered when methods are evaluated in fields where yet one of the methods, in this case echocardiography, is considered the golden standard. When two methods are compared, the absolute values of the measured variables are mostly unknown; and it is therefore difficult to establish whether one method is superior to the other. One possible way to strengthen the validity of a comparison is to use a third method as in this study, namely measurement of natriuretic peptides, and to examine its relation to the other two, in our case echocardiography and MRI. Moreover, we used a statistical method suggested by Bland and Altman to assess the agreement of methods Citation18. They have shown that analyses of correlation might not be an optimal way of comparing methods since values obtained may correlate well but still not be in agreement. However, it must be kept in mind that the decision as to whether or not a difference between two methods is acceptable is a clinical decision and not a statistical one. Clinicians have to make the assessment as to whether a difference between two methods is acceptable or not.
Study limitations
A limitation of this study is that it was conducted on relatively few patients and only on patients with severe MR. On the other hand, these patients are more difficult to assess properly than patients with less advanced disease. However, it would be of interest to evaluate echocardiography and MRI and their relations to cardiac peptides in patients with MR of different degrees. Also, future studies should include patients with impaired left ventricular function.
The future and conclusions
The golden standard of grading a regurgitant valve today is echocardiography; and although this method might be somewhat difficult to use when a specific measure of volume is needed, it is easy to use and reliable. In our study, echocardiography and MRI were comparable regarding qualitative measures but not quantitative measures. Therefore, we suggest that MRI might be of great use when a more specific assessment of exact volume is needed, as for example in grading of a paravalvular leakage.
Acknowledgements
Johan Lindbäck, Uppsala Clinical Research Center, for advice regarding statistics.
References
- Zoghbi WA, Enriquez-Sarano M, Foster E, Grayburn PA, Kraft CD, Levine RA, et al. American Society of Echocardiography: Recommendations for evaluation of the severity of native valvular regurgitation with two-dimensional and Doppler echocardiography. Eur J Echocardiogr 2003; 4: 237–61
- Bonow RO, Carabello B, de Leon AC, Jr, et al. ACC/AHA guidelines for the management of patients with valvular heart disease. A report of the American College of Cardiology/American Heart Association Task Force on Practice Guidelines (Committee on Management of Patients with Valvular Heart Disease). J Am Coll Cardiol. 1998; 32: 1486–588
- Kon M, Meyerson S, Moat N, Pennell D. Quantification of regurgitant fraction in mitral regurgitation by cardiovascular magnetic resonance: Comparison of techniques. J Heart Valve Dis. 2004; 13: 600–7
- Kizilbash A, Hundley G, Willett D, Franco F, Peshock R, Grayburn P. Comparison of quantitative doppler with magnetic resonance imaging for assessment of the severity of mitral regurgitation. Am J Cardiol. 1998; 81: 792–4
- Westenberg J, Doornbos J, Versteegh M, Bax J, van der Geest R, de Roos A, et al. Accurate quantification of regurgitant volume with MRI in patients selected for mitral valve repair. Eur J Cardiothorac Surg. 2005; 27: 462–76
- Constantine G, Shan K, Flamm S, Siavananthan M. Role of MRI in clinical cardiology. Lancet. 2004; 363: 2162–71
- Lembcke A, Wiese T, Enzweiler C, Kivelitz D, Dushe S, Dohmen P, et al. Quantification of mitral valve regurgitation by left ventricular volume and flow measurements using electron beam computed tomography: Comparison with magnetic resonance imaging. J Comput Assist Tomogr 2003; 3: 385–91
- Sutton T, Stewart R, Gerber I, West T, Richards M, Yandle T, Kerr A. Plasma Natriuretic peptide levels increase with symptoms and severity of mitral regurgitation. J Am Coll Cardiol. 2003; 41: 2280–7
- Brookes C, Kemp M, Hooper J, Oldershaw P, Moat N. Plasma brain natriuretic peptide concentrations in patients with chronic mitral regurgitation. J Heart Valve Dis. 1997; 6: 608–12
- John A, Dill T, Brandt R, Rau M, Ricken W, Bachmann G, et al. Magnetic resonance imaging to assess the aortic valve area in aortic stenosis: How does it compare to current diagnostic standards?. J Am Coll Cardiol. 2003; 42: 519–26
- Caruthers S, Lin S, Brown P, Watkins M, Williams T, Lehr K, et al. Practical value of cardiac magnetic resonance imaging for clinical quantification of aortic valve stenosis: Comparison with echocardiography. Circulation. 2003; 108: 2236–43
- Sondergaard L, Lindvig K, Hildebrandt P, Thomsen C, Stahlberg F, Joen T, et al. Quantification of aortic regurgitation by magnetic resonance velocity mapping. Am Heart J. 1993; 125: 1081–90
- Richards AM, Nicholls MG, Yandle TG. Plasma N-terminal pro-brain natriuretic peptide and adrenomedullin-new neurohormone predictors of left ventricular function and prognosis after myocardial infarction. Circulation. 1998; 97: 1921–9
- Omland T, Aakvaag A, Bonarjee VV. Plasma brain natriuretic peptide as an indicator of left ventricular systolic function and long-term survival after acute myocardial infarction: Comparison with plasma atrial natriuretic peptide and N-terminal proatrial natriuretic peptide. Circulation. 1996; 93: 1963–9
- Hall SA, Brickner ME, Willett DL, Irani WN, Afridi I, Grayburn PA. Assessment of mitral regurgitation severity by Doppler color flow mapping of the vena contracta. Circulation. 1997; 95: 636–42
- Bargiggia GS, Tronconi L, Sahn DJ, et al. A new method for quantification of mitral regurgitation based on color flow Doppler imaging of flow convergence proximal to reguritant orifice. Circulation. 1991; 84: 1481–9
- Stridsberg M, Pettersson T, Pettersson K. A two-site Delfia immunoassay for measurements of the N-terminal peptide of pro-Atrial Natriuretic peptide (nANP). Upsala J Med. 1997; 102: 99–108
- Bland JM, Altman DG. Statistical methods for assessing agreement between two methods of clinical measurement. Lancet. 1986; 1: 307–10
- Gelfand EV, Hughes S, Hauser TH, et al. Severity of mitral and aortic regurgitation as assessed by cardiovascular magnetic resonance: Optimizing correlation with doppler echocardiography. J Cardiovasc Magn Res. 2006; 8: 503–7
- Sechtem U, Pflugfelder PW, Cassidy MM, et al. Mitral or aortic regurgitation: Quantification of regurgitant volumes with cine MR imaging. Radiology. 1988; 167: 425–30
- Hundley WG, Li HF, Willard JE, Landau C, Lange R, Meshack B, et al. Magnetic resonance imaging assessment of the severity of mitral regurgitation. Comparison with invasive techniques. Circulation. 1995; 92: 1151–8
- Fujita N, Chazouilleres AF, Hartiala JJ, O'Sullivan M, Heidenreich P, Kaplan J, et al. Quantification of mitral regurgitation by velocity-encoded cine nuclear magnetic resonance imaging. J Am Coll Cardiol. 1994; 23: 951–8
- Enriquez-Sarano M, Bailey K, Seward J, Tajik J, Krohn M, Mays J. Quantitative Doppler assessment of valvular regurgitation. Circulation. 1993; 87: 841–8