Abstract
Objectives. A high degree of variability has been reported regarding the ultrasound-based assessment of flow-mediated dilatation. We wanted to investigate the variability and find out how it might be reduced most efficiently. Design. Brachial artery flow-mediated dilatation was measured by high-resolution ultrasound in 22 healthy adults on two consecutive days. Two observers analysed all images twice. The total variance was split into variance components and estimated hierarchically using the method of restricted maximum likelihood. Results. The relative proportional contributions from intraobserver (residual), interobserver, interpatient and interday variance components, with percentage dilatation as outcome variable, were 0.41, 0.18, 0.25, and 0.15, respectively. Conclusions. The major source of variability when assessing flow-mediated dilatation was found to be intraobserver variability. The simplest way to reduce total variability is for the observer to average results from repeated image analyses. We suggest that three repetitions are sufficient. This will reduce the total variance by 30%.
Endothelial vasomotor function can be evaluated non-invasively by high-resolution ultrasound where the dilating capacity of a conduit artery is assessed. The brachial, radial and femoral arteries are the most common vessels examined. A sphygmanometer cuff occludes blood flow in the chosen artery for a few minutes. When the pressure of the cuff is released, a reactive hyperaemia is created, with increased flow through the vessel. This increased flow raises the shear stress against the vessel wall, acting as a stimulus for the endothelial cells to release vasoactive substances. In this way, a flow-mediated dilatation occurs. The vessel diameter is measured before and after the increase in shear stress. Impaired brachial artery flow-mediated dilatation detected by this method, has been shown to be an independent predictor of future cardiac events Citation1, Citation2.
Guidelines have been developed for evaluating flow-mediated dilatation of the brachial artery Citation3 to enable comparison of studies assessing endothelial function. Even so, the variability of the method has been inconsistently reported in the literature, and several earlier studies have suggested high variability of the method. The aim of this study was to investigate the variability of the ultrasound-based assessment of flow-mediated dilatation, and to determine the most efficient way of reducing this variability.
Material and methods
Subjects
Twenty-two healthy adults (seven females, 15 males) with a mean age of 27 years (range 23 to 54) were recruited among university students and staff. Exclusion criteria were smoking, diabetes, known cardiovascular disease and pregnancy. All participants provided a written informed consent. The study was conducted in accordance with the Helsinki Declaration and was approved by the Regional Committee for Medical Research Ethics.
Study design
The clinical protocol has been described elsewhere Citation3. In brief, the subjects rested in supine position for 15 minutes before a baseline status of the left brachial artery was recorded with high resolution ultrasound. After finding a satisfactory transducer position, we marked the position on the skin with a felt tip pen which was ultrasound-gel resistant. The arm remained in the same position throughout the study. To ensure placing the probe in the same position the following day, we measured the distance from the skin mark to the distal olecranon. We occluded the artery through the inflation of a pneumatic cuff to a pressure of 250 mmHg for 5 minutes and depicted the artery again 60 s after pressure release as recommended by the International Brachial Artery Reactivity Task force Citation3.
In each subject, the procedure was repeated on two consecutive days, at the same hour, to control for circadian variation Citation4. Avoidance of food intake, coffee, vitamin C/orange juice and exercise within the last 4 hours prior to examination was required. Two observers analysed all images twice. shows the study design.
Figure 1. Design of the study. With 22 subjects, a total of 22×2×2×2 = 176 measurements of the outcome variables were performed. No., number.
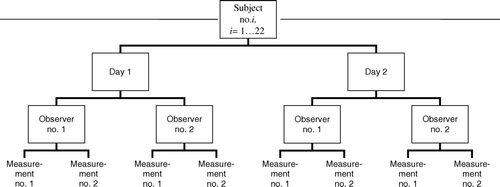
Image acquisition
The brachial artery was depicted in two dimensional mode with a Vivid 7 scanner (GE Vingmed Ultrasound AS, Horten, Norway). We used a handheld linear array transducer (M12L) with a frequency of 14 MHz, axial resolution of 0.1 mm and depth settings of three cm. Gain was set by visual assessment and five focus points were adjusted to cover the artery, optimising the resolution in the region of the vessel walls. We stored the images digitally as cine loops of five heart beats.
Data analysis
The images were analysed using the software analysis program EchoPAC PC (GE Vingmed Ultrasound AS, Horten, Norway) on a personal computer with a caliper resolution of 0.1 mm.
The vessel diameter was measured at baseline and 60 s after cuff release to evaluate flow-mediated dilatation. Prior to analysis, each cine loop was extracted from the examination file and saved given a random number as file name, so that the observers were unaware of subject identity, day of acquisition or whether it was a recording at baseline or in the dilated state. We measured the vessel from the anterior to the posterior media-adventitia interface (the m-lines) at the R-wave (end-diastole) of the QRS-complex of the electrocardiogram to avoid systolic variation due to compliance Citation5. The cine loops were scrolled to find the R-wave with the clearest view of the vessel walls. Three different measurements of the diameter were obtained along the vessel. The average of these three measurements was used in the subsequent analysis, corresponding to the lowest level of measurement in .
Measurements and statistical analysis
Dilatation is presented in two ways: as dilatation in millimetres (mm), i.e. the baseline diameter subtracted from the dilated diameter; and as percentage dilatation, i.e. the dilatation in millimetres divided by the baseline diameter and multiplied by 100%. The brachial artery diameters are given in millimetres.
The sources of variability were considered as follows. The experimental conditions (observer, day and subject) were considered to be independent random factors, contributing to the total variance of the outcome variables percentage dilatation, dilatation in millimetres, baseline diameter and dilated diameter. The resulting variance components model can be summarised aswhere y is the outcome variable of interest, subj denotes subject, day denotes day and obs denotes observer. The last component, res, denotes the residual, or intraobserver (i.e. within observer) variance, that cannot be accounted for otherwise. The variance components were estimated hierarchically, as observer within day within patient, by the method of restricted maximum likelihood (REML), using the nlme package of the statistical software R, version 2.5.0 Citation6. The coefficient of variation for each component was calculated as the standard deviation divided by the mean of all observations of the corresponding outcome variable, multiplied by 100.
Results
For percentage dilatation as outcome variable, the proportional contribution from the variance components intraobserver, interobserver, interday and interpatient were 0.41, 0.18, 0.25 and 0.15 respectively (). Note that these sum to 1.00 (or 100%). The proportional contributions from the variance components regarding dilatation in millimetres were similar: 0.43, 0.20, 0.29 and 0.08, respectively. For the baseline diameter, the corresponding figures were 0.03, 0.01, 0.05 and 0.92, and for the dilated diameter the figures were close to the latter; 0.03, 0.01, 0.05 and 0.91.
Table I. Variance components tabulated as proportions of total variance.
The coefficients of variation regarding intraobserver, interobserver, interday and interpatient percentage dilatation were 29.1%, 19.4%, 22.9% and 17.9%, respectively (). With respect to the baseline diameter, the coefficients of variation were 2.9%, 1.5%, 3.7% and 16.6%. Similar figures were obtained for the dilated diameter.
Table II. Coefficients of variation.
Overall mean percentage dilatation was 16.5% with a standard deviation of 6.8 percent points. The mean dilatation in millimetres was 0.6 mm with a standard deviation of 0.21 mm, based on a baseline diameter of 3.6 mm and a dilated diameter of 4.2 mm, both with standard deviations of 0.6 mm. The mean difference in dilatation in percentages between observers was 0.22 percent points with a standard deviation of the differences of 7.75 percent points.
We found no obvious bias, nor trend, in Bland-Altman plots of our data (figures not shown) Citation7. Graphically, the differences between the measurements were independent of their respective mean values.
Discussion
The largest source of variability of percentage flow-mediated dilatation was intraobserver variability, accounting for a proportion of 0.41 of the total variance (total variance defined as 1.00), ().
The coefficients of variation of the percentage dilatation in this study are in the middle range of earlier reported results (). We measured the diameter from the media-adventitia interfaces. In the studies presenting lower interday and intraobserver coefficients of variation, the diameter was measured from the intima-lumen interfaces. Lower variability when measuring from the intima-lumen interfaces has earlier been shown by Woodman et al. Citation9 (, intraobserver). When considering groups using manual placement of electronic calipers for analysis (), variability decreases as the number of diameter measurements per frame increases. We averaged three diameters per frame, fewer than the groups presenting lower variability than us.
Table III. Studies reporting the coefficient of variation of percentage dilatation, including our own results.
The studies presenting lower coefficients of variation are characterised by the use of probes with higher frequency (>10 MHz) (interday and intraobserver) and a younger study population (interday) (), both yielding better image quality. Lower variability by high frequency image acquisition has been shown by Herrington et al. (9) (, interday). In this study we both used high frequency image acquisition (14 MHz) and recruited a fairly young study population (mean age 27, range 23–54).
Automatic edge-detection software might render lower variability, due to consistency and lack of human interpretation. Woodman et al. Citation8 reported low intraobserver and interobserver variability by automatic analysis, whereas Herrington et al. (9), however, reported high values (). The discrepancy in these cases could be due to different software solutions or differences in image quality. For interday variability, the groups presenting lower variability used manual placement of electronic calipers ().
The most efficient way to reduce total variability is to reduce intraobserver variability, being the largest contributor to total variability. Intraobserver variability can be reduced by repeating the process of analysis and calculating the mean value of observations. Theoretically, the variance of a mean value approaches zero when the number of averaged observations tends towards infinity. However, for practical reasons, three repetitions of image analyses will suffice, as the intraobserver thereby will become less than interobserver variance (in our case, the intraobserver variance will be reduced from 23 to 7.7, compared to the interobserver variance of 10). The total variance will then be reduced by 30% which will make an important impact on study results.
The larger contribution of intraobserver variability relative to interobserver variability may seem surprising, as most conditions are held constant in the intraobserver setting. Note, however, that we have employed a hierarchical statistical model in which all variance components are accounted for in the same operation. As the intraobserver variability constitutes the lowest level of the study hierarchy (), it embraces all unknown variance components not accounted for elsewhere in the model (i.e. other than day, patient and observer). Hence, the intraobserver variance might be nominated the residual variance. Common practice has been to consider each variance component separately when assessing variability. When applying this approach on our data, intraobserver variability does indeed become less than interobserver variability (data not shown). However, such a model assumes that all variability arises from the variance component assessed, which is unreasonable; and makes it impossible to assess the relative contribution from the different variance components. Therefore we find our model more suitable. The confidence intervals for intra- and interobserver variance overlap (), suggesting that they are roughly of the same magnitude. If we had used more than two observers, precision of the interobserver estimate might have improved.
Our results show that the measurement accuracy highly depends on whether dilatation (i.e. percentage dilatation or dilatation in millimetres) or diameter (baseline diameter or dilated diameter) is analysed (). The method is quite accurate regarding diameter, with coefficients of variation ranging from 1.5–3.7% (). (The interpatient component is disregarded, as this component does not add information about the method's variability). Such figures of the coefficient of variation are rather low. With regard to dilatation the method is less satisfactory. This is shown by the higher coefficients of variation ranging from 19 to 29%. (The interpatient component is disregarded for reasons mentioned above.) Relative to the resolution of the measurement and analysis tools, the scale of dilatation is much smaller than the diameter (six times the resolution versus 42 times, respectively). It is therefore hardly surprising that dilatation holds more variation than diameter. DeRoos et al. Citation8 speculate whether some of the earlier reported lower coefficients of variation might refer to baseline or maximal diameters rather than percentage dilatation. Certainly, this would result in a higher apparent accuracy. As dilatation, not diameters, represents the physiology of interest, the variability of the method should also refer to dilatation.
In our study, the interday (intrapatient) coefficient of variation of the percentage dilatation was 22%, implying that the assessment of endothelial function by high resolution ultrasound is a tool of limited value in the clinical setting. Reducing the interday (intrapatient) variance would require averaging repeated measurements over a number of days, a rather time-consuming approach. However, the method performs better as a research tool applied to patient groups. In this setting, the total variability easily can be reduced by repeating the image analysis.
Limitations
Our results are based on a healthy population. The variability may differ when examining patient populations.
Conclusion
The major source of variability when assessing flow-mediated dilatation was found to be intraobserver variability. While interobserver variability was roughly of the same magnitude, the simplest way to reduce total variability is for the observer to average results from repeated image analyses. We suggest that three repetitions are sufficient. This will reduce the total variance by 30%.
Acknowledgements
The study was financially supported by the Co-operative Body of Central Norway Regional Health Authority and Norwegian University of Science and Technology.
References
- Gokce N, Keaney JF, Jr, Hunter LM, Watkins MT, Nedeljkovic ZS, Menzoian JO, et al. Predictive value of noninvasively determined endothelial dysfunction for long-term cardiovascular events in patients with peripheral vascular disease. J Am Coll Cardiol. 2003; 41: 1769–75
- Neunteufl T, Heher S, Katzenschlager R, Wölfl G, Kostner K, Maurer G, et al. Late prognostic value of flow-mediated dilation in the brachial artery of patients with chest pain. Am J Cardiol. 2000; 86: 207–10
- Corretti MC, Anderson TJ, Benjamin EJ, Celermajer D, Charbonneau F, Creager MA, et al. Guidelines for the ultrasound assessment of endothelial-dependent flow-mediated vasodilation of the brachial artery. J Am Coll Cardiol. 2002; 39: 257–65
- Otto ME, Svatikova A, Barretto RB, Santos S, Hoffmann M, Khandheria B, et al. Early morning attenuation of endothelial function in healthy humans. Circulation. 2004; 109: 2507–10
- Chuang ML, Douglas PS, Bisinov EA, Stein JH. Effect of cardiac cycle on ultrasound assessment of endothelial function. Vasc Med. 2002; 7: 103–8
- R Development Core Team (2006). R: A language and environment for statistical computing. R Foundation for Statistical Computing, Vienna, Austria. Available from: URL: http://www.R-project.org.
- Bland JM, Altman DG. Measuring agreement in method comparison studies. Stat Methods Med Res. 1999; 8: 135–60
- Woodman RJ, Playford DA, Watts GF, Cheetham C, Reed C, Taylor RR, et al. Improved analysis of brachial artery ultrasound using a novel edge-detection software system. J Appl Physiol. 2001; 91: 929–37
- Herrington DM, Fan L, Drum M, Riley WA, Pusser BE, Crouse JR, et al. Brachial flow-mediated vasodilator responses in population-based research: Methods, reproducibility and effects of age, gender and baseline diameter. J Cardiovasc Risk. 2001; 8: 319–28
- DeRoos NM, Bots ML, Schouten EG, Katan MB. Within-subject variability of flow-mediated vasodilation of the brachial artery in healthy men and women: Implications for experimental studies. Ultrasound Med Biol. 2003; 29: 401–6
- Uehata A, Lieberman EH, Gerhard MD, Anderson TJ, Ganz P, Polak JF, et al. Noninvasive assessment of endothelium-dependent flow-mediated dilation of the brachial artery. Vasc Med. 1997; 2: 87–92
- Liang YL, Teede H, Kotsopoulos D, Shiel L, Cameron JD, Dart AM, et al. Non-invasive measurements of arterial structure and function: Repeatability, interrelationships and trial sample size. Clin Sci (Lond) 1998; 95: 669–79
- Juonala M, Viikari JS, Laitinen T, Marniemi J, Helenius H, Rönnemaa T, et al. Interrelations between brachial endothelial function and carotid intima-media thickness in young adults: The cardiovascular risk in young Finns study. Circulation. 2004; 110: 2918–23
- Malik J, Wichterle D, Haas T, Melenovsky V, Simek J, Stulc T. Repeatability of noninvasive surrogates of endothelial function. Am J Cardiol. 2004; 94: 693–6
- Hijmering ML, Stroes ESG, Pasterkamp G, Sierevogel M, Banga JD, Rabelink TJ. Variability of flow mediated dilation: Consequences for clinical application. Atherosclerosis. 2001; 157: 369–73