
Abstract
Sudden cardiac death (SCD) causes a high burden of premature deaths in the population affecting subjects of all ages. The identification of subjects at high risk for SCD is of great importance as the prevention of many of these events would be possible with the treatment of underlying cardiac diseases and the use of implantable cardioverter-defibrillators (ICD). However, the current selection of patients for ICD therapy is based solely on left ventricular ejection fraction, and thus a substantial portion of patients at high risk does not qualify for the therapy. Role of the standard electrocardiogram (ECG) in SCD risk stratification has been under active research during the last decade and multiple abnormalities of depolarization and repolarization on the ECG associated with an increased risk of SCD have been identified. In this review, we describe the basic pathophysiological principles behind these changes. We also review the current knowledge of the prognostic significance of ECG predictors of SCD in the general population, and in patients with coronary heart disease (CHD), heart failure, cardiomyopathies, and in inheritable arrhythmia syndromes. Also, insights into the novel digital ECG signal processing techniques are provided.
Introduction
Sudden cardiac death (SCD) is a frequent cause of premature death throughout the world. Coronary heart disease (CHD) is the leading cause of SCDs in the general population explaining approximately 80% of SCDs, although in younger subjects a wide range of cardiac pathology including cardiomyopathies, inflammatory, and congenital cardiac disease and inherited arrhythmia syndromes are also important underlying etiologies. Despite the improvements in heart disease prevention and treatment during the recent decades, the reported annual incidence of SCD has been between 50–100 SCDs/100,000 persons in many Western countries.[Citation1] The left ventricular ejection fraction, which is currently used to identify candidates for primary prevention implantable cardioverter-defibrillator therapy, has severe limitations.[Citation1,Citation2] Thus, improved risk stratification methods are urgently needed to identify the subjects at high risk for SCD to target the preventive measures available. Since SCD is primarily the result of electrical disturbance of the normal cardiac rhythm, the 12-lead electrocardiogram (ECG) is an attractive noninvasive tool for SCD risk stratification given its wide availability and low cost. In this review, we summarize the current knowledge of the prognostic significance of abnormalities detectable in the standard resting 12-lead ECG with regard to SCD risk both in the general population and among subjects with cardiac disease.
Electrophysiological basis for electrocardiographic abnormalities indicating susceptibility to arrhythmias
Abnormalities of the depolarization and repolarization of the heart are reflected in the 12-lead ECG. These can be related to structural changes in the heart affecting electrical activity, or to purely electrical abnormalities. Myocardial scar may present as pathological Q-waves or QRS fragmentation.[Citation3] QRS complex duration and morphology reflect the impulse conduction properties in the His-Purkinje system and ventricular myocardium, which can be altered by pathological processes. Myocardial scarring and fibrosis, either diffuse or local such as an infarction scar, may form re-entry loops needed sustained ventricular tachycardia. Repolarization abnormalities such as changes in the ST-segment and inversions or other alterations in T-wave morphology are observed in ischemia, ventricular hypertrophy, and electrolyte disturbances, for example. QT interval demonstrated the time from the beginning of ventricular depolarization to the end of ventricular repolarization and is affected by multiple factors of which heart rate, calcium homeostasis, certain drugs, ion channel mutations causing the long QT syndrome, and a wide range of structural cardiac diseases are among the most important ones. However, diagnosing vulnerability to arrhythmias when the subject is seemingly healthy remains a continuing challenge as additional contributing factors such as ischemia, increased sympathetic activity, or electrolyte disturbances often play a crucial role in arrhythmia initiation.[Citation4]
Many of the ECG risk markers of SCD reviewed in detail in the following sections are related to or caused by CHD or other cardiac conditions. This is because SCD is not an independent entity but a terminal manifestation of multiple cardiac diseases of which CHD is the most common. The ECG abnormalities may be the first detectable signs of a subclinical cardiac disease or relate to a more overt cardiac pathology. An established cardiac disease is a well-documented risk factor of SCD,[Citation2] but some of the traditional cardiovascular risk factors may also create a substrate for arrhythmias. High lifetime burden of hypertension leads to left ventricular hypertrophy (LVH), which causes changes in the electrical activity of the heart and the ECG. Prolongation and heterogeneity of the action potential duration and refractoriness and increased amount of early afterdepolarizations have been documented in LVH.[Citation5] Also, cardiac autonomic neuropathy, a complication of diabetes, leading to parasympathetic and sympathetic denervation of the heart results in increased resting heart rate and QT interval prolongation.[Citation6] In addition, QT interval prolongation has also been documented among the obese.[Citation7]
Electrocardiographic changes associated with increased SCD risk in the general population
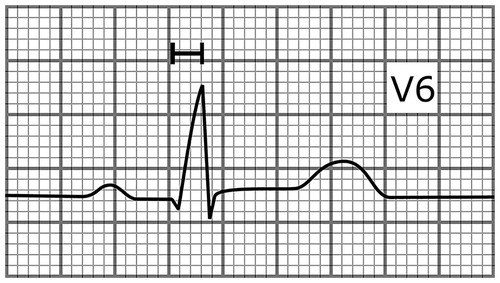
Most of the data of the associations of ECG abnormalities and SCD risk in the general population are derived from large prospective population-based cohort studies including the CHD Study of the Finnish Mobile Clinic survey.[Citation8] The depolarization abnormalities independently associated with increased SCD risk include intraventricular conduction delay (QRS duration prolongation to ≥100 ms and especially to ≥110 ms in the absence of bundle branch block) and left bundle branch block.[Citation8,Citation9] The fragmented QRS (presence of an additional R wave, or notching in the nadir of the R’ in two contiguous leads) has provided mixed results regarding prognostic significance in the general population. The fragmented QRS complex has shown to be a specific and sensitive marker of myocardial scar in cardiac patients and predictive of appropriate ICD therapy in subjects with ischemic cardiomyopathy.[Citation3] However, it is a common finding in the general population and it did not predict adverse outcomes in presumably healthy subjects in a large study.[Citation10] Delayed intrinsicoid deflection (time from QRS complex onset to R-wave peak ≥0.05s in lead V5 or V6) is a new marker of increased SCD risk which is caused by prolongation of the early phase of ventricular action potential ().[Citation11] Electrocardiographic LVH is also associated with increased SCD risk, and in a recent study this association was independent from increased left ventricular mass.[Citation12]
Figure 1. A schematic illustration presenting lead V6 of an ECG with delayed intrinsicoid deflection (time from the onset of the QRS complex to R-wave peak in lead V5 or V6 ≥ 0.05s). The paper speed is 50 mm/s.
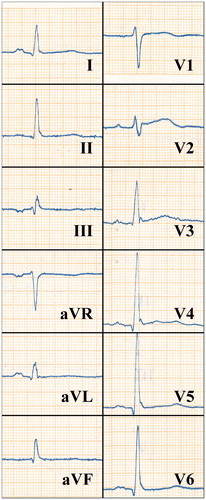
The well-established abnormalities of the repolarization phase of cardiac action potential predicting SCD include QT-interval prolongation, T-wave inversions in leads I, II, aVF, or V4–V6, and an abnormal frontal QRS/T angle.[Citation8,Citation13] In one study, prolonged QTc interval was associated with a threefold risk of SCD in a population of older adults.[Citation13] In another study, it was shown that gender, the use of QT prolonging drugs, and diabetes were determinants of prolonged QTc in CHD patients. In that study a fivefold risk of SCD was documented among subjects with QTc prolongation who didn’t have diabetes or QT prolonging drugs.[Citation14] In addition to SCD, QTc prolongation is a predictor of overall cardiac mortality, the association being stronger in those with cardiac disease.[Citation15] Different patterns of early repolarization (ER) have been under vigorous research after it was shown that J-point elevations in inferior or lateral leads are prevalent in subjects with idiopathic ventricular fibrillation. The presence of an ER pattern (J-point elevation [either slurred or notched] ≥0.1 mV in two contiguous inferior or lateral leads, ) has been shown to be associated with SCD in middle-aged general population. Characteristics of ER pattern associated with worse prognosis include its presence inferiorly or globally, horizontal or downsloping ST-segment, and high amplitude. Some studies assessing the prognostic significance of the ER pattern have been negative, but this may be due to wide heterogeneity of the criteria used in different studies in defining the ER pattern.[Citation16,Citation17]
Figure 2. An ECG of a 41-year-old male who hadn’t been diagnosed with cardiac disease showing an ER pattern in the inferior and lateral leads. The subject died of SCD after 25 years of follow-up. The paper speed is 50 mm/s.
In addition to the aforementioned multiple ECG risk markers of SCD related to abnormal depolarization and repolarization, alterations in cardiac rhythm may indicate an increased risk of SCD. Elevated resting heart rate may indicate an abnormal tone in the autonomous nervous system and has been shown to be associated with SCD.[Citation18] Also, atrial fibrillation is associated with increased risk of SCD, but additional research is needed to determine whether it specifically increases vulnerability to ventricular arrhythmias as this association may also be related to advanced cardiac pathology among subjects with atrial fibrillation.[Citation18,Citation19] A summary of ECG abnormalities associated with increased SCD risk is shown in .
Table 1. Examples of studies assessing the SCD risk associated with electrocardiographic abnormalities in the general population.
Overall, several ECG abnormalities have been identified that are associated with two to threefold risk of SCD in the general population, but in a population with low overall risk of SCD the positive predictive value of a single abnormality is low. However, the presence of one or more of these risk markers may serve as a sign of potential underlying cardiac disease for the astute clinician and warrants a closer clinical evaluation of the patient. Future studies are likely to further refine the role of ECG abnormalities as indicators of SCD risk and search for the optimal combination of risk markers.
ECG abnormalities and SCD risk in CHD
Changes in the electrical properties of the heart caused by myocardial ischemia, reperfusion, and infarct scar remodeling establish favorable conditions for arrhythmia initiation. Thus, greatest risk of SCD in CHD is during the acute ischemic event and in the weeks and months following myocardial infarction, but predicting ones risk of SCD during this period has proved to be challenging. This is because of multiple changes occurring in the cardiac electrical function as a response to ischemia, reperfusion, and remodeling are not predictable from measures recorded prior to the event.[Citation22] However, for example, the presence of an ER pattern, documented either prior to or during an acute coronary event, is associated with increased risk of ventricular tachyarrhythmias.[Citation23] It is also likely that the ECG risk markers of SCD derived from general population studies are associated with increased SCD risk in CHD as CHD is responsible for the most of SCDs in this population. However, in the general population studies in which these risk markers have been established, generally no echocardiographic measures or measures of ischemic burden have been available. Thus, the value of these ECG abnormalities in risk stratification may have been suppressed had these measures been available, and the final role of ECG risk markers of SCD in CHD remains to be established.
ECG abnormalities and SCD risk in severe heart failure
The emergence of ICDs in primary prevention of SCD in systolic heart failure patients has given rise to active research around markers predicting appropriate ICD therapy or sudden cardiac arrest in this high-risk population. The need for optimal patient selection to ICD therapy is obvious due to the possible device-related complications and the high cost of the therapy. Parameters derived from the standard ECG have been studied for this purpose in addition to multiple measures of autonomic nervous function, cardiac imaging, and repolarization analysis assessed during exercise stress testing or longer recording of cardiac electronic function. Most of these studies have been performed on patients participating in clinical ICD trials and thus the patients have been comprehensively studied prior the ICD implantation allowing for thorough multivariate adjustment for potential confounding factors in these studies. However, regarding multiple ECG parameters the results in studies conducted have been mixed. This might relate to differences in inclusion criteria in the studies, for example, ischemic cardiomyopathy vs. non-ischemic cardiomyopathy vs. both. Some of the markers can also depict a more severe underlying heart disease and thus predict overall mortality and not specifically ventricular arrhythmias or arrhythmic mortality. QRS duration >120 ms has predicted SCDs in most studies, but there is evidence that it can be associated with the severity of the underlying cardiac disease and may thus not be a specific indicator of the risk of ventricular tachyarrhythmias.[Citation24] The presence of an ER pattern is associated with an increased risk of ventricular tachyarrhythmias and SCD both in subjects with ischemic and nonischemic cardiomyopathy.[Citation25,Citation26] Fragmented QRS complex has generally been associated with arrhythmic end-points, but in one large study comprising of patients with either ischemic or nonischemic cardiomyopathy fragmented QRS did not predict arrhythmic events.[Citation3,Citation27] LVH assessed with the Cornell criteria predicts arrhythmic events and mortality in subjects with ischemic cardiomyopathy.[Citation28] QRS-T angle predicts appropriate ICD therapy as well as mortality in primary prevention ICD population.[Citation29] Of the repolarization-related parameters prolonged QTc, prolonged T-peak to T-end interval, and a positive T wave in lead aVR have predicted arrhythmic events in ischemic cardiomyopathy.[Citation30–32] The ultimate goal of these studies is to identify electrocardiographic patterns that can be used in refining the current left ventricular ejection fraction-based risk stratification.
ECG as a predictor of SCD or appropriate ICD shock in hypertrophic cardiomyopathy and arrhythmogenic right ventricular cardiomyopathy
Subjects with hypertrophic cardiomyopathy (HCM) are generally at risk for SCD, but there is substantial inter-individual variation in the risk. HCM patients with documented ventricular tachycardia, unexplained syncope, severe left ventricular wall thickening, family history of SCD, and increased left atrial diameter are generally considered as being at highest risk, the risk being also increased in subjects with young age at presentation.[Citation33] Some recent studies have shown that certain parameters derived from the standard ECG are also associated with increased risk. In one study, a risk score combining QTc, QRS axis deviation, T-wave inversions, ST-segment depressions, limb lead QRS amplitude sum, and 12-lead QRS amplitude-duration product predicted cardiac arrests.[Citation34] In another study, QTc ≥460 ms and fragmented QRS in ≥ three territories predicted SCD and appropriate ICD therapy.[Citation35] These findings remain to be replicated in other cohorts.
Arrhythmogenic right ventricular cardiomyopathy (ARVC) is a predominantly inheritable cardiomyopathy characterized by fibrofatty replacement of the heart muscle. It often initially manifests in the right ventricular inflow tract, outflow tract, or apex but in more advanced stages may also affect the left ventricle. The affected areas may serve as a substrate for ventricular arrhythmias. The course of the disease is variable. ECG is a central tool in the diagnosis and also provides prognostic information.[Citation36] The SCD risk factors in ARVC in addition to young age at presentation are related to more advanced disease and include marked right ventricular enlargement, left ventricular involvement, and history of ventricular arrhythmias or syncope. ECG risk factors include JT interval prolongation, T-wave inversion beyond V3, increased QRS duration and prolonged S-wave upstroke in the right precordial leads, and increased QRS dispersion.[Citation37] Also, inferior T-wave inversions have been shown to be associated with arrhythmic events in ARVC and in one study an ER pattern was shown to be associated with arrhythmic events and a more advanced disease.[Citation38,Citation39]
ECG in SCD risk stratification in inheritable arrhythmia syndromes
The long QT syndrome (LQTS) is the most common inherited arrhythmia syndrome characterized by prolonged corrected QT interval (generally to over 480 ms).[Citation40] The most important issue related to LQTS diagnosis is the correct measurement and correction formula of QT interval. Tangent method for QT interval should be used and measured from leads II or V5 or from lead where the QT interval is the longest. Generally QT interval should be measured only from ECGs with heart rate between 60–100bpm. Majority of LQTS diagnosis fall into three different subcategories of the disease entity. In LQTS type 1, ECG presents broadened T waves. In LQTS type 2, ECG illustrates biphasic T waves especially in precordial leads. Type 3 LQTS is the least common form of these three subtypes and its associated ECG characteristic is a small and pointy T-wave far away from the QRS complex.[Citation41]
In general the most important ECG risk marker of SCD in LQTS is the length of the QT interval. Corrected QT interval over 500 ms is a major risk factor in all three subtypes. Additionally, subtype 3 has been thought to be associated with the highest risk for SCD followed by type 2 and type 1. Another significant marker of imminent arrhythmias in LQTS is the macroscopic T-wave alternans.[Citation41]
Short QT syndrome (SQTS) is a rare syndrome characterized by increased risk for ventricular fibrillation and very short-QT interval (QTc under 350 ms) with high T waves in precordial leads.[Citation42] The difference in ECG with short-QT interval and SQTS can be seen in the shortened J-point to T-peak interval in SQTS. In otherwise short QT interval, the T-peak to T-end interval is short but the upstroke of T wave is longer than that in SQTS ().[Citation43]
Figure 3. A schematic illustration showing a heartbeat with different JT intervals. The J-point to T peak interval is short in SQTS (red curve, 110 ms) but close to normal in subjects with short-QT interval without the syndrome (black curve, 180 ms).
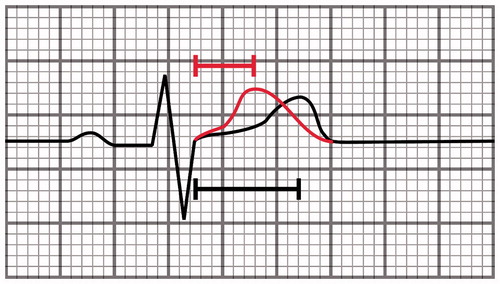
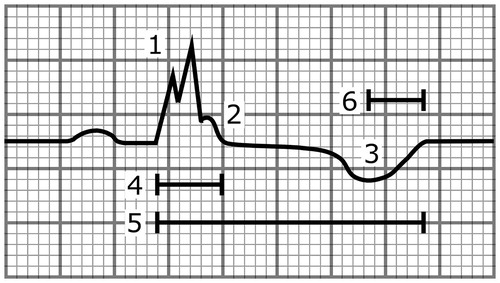
Figure 4. A schematic illustration showing a heartbeat with multiple abnormalities that are associated with increased SCD risk. These include (1) the fragmentation of the QRS complex, (2) the notched ER pattern with a downsloping ST segment, (3) the T-wave inversion directed to the opposite direction from the QRS complex, (4) the wide QRS complex (110 ms), (5) the long-QT interval (500 ms), and (6) the long T-peak to T-end interval (105 ms). The paper speed is 50 mm/s.
Brugada’s syndrome (BrS) is characterized by the so-called type 1 BrS ECG i.e. J-point elevation with inverted T waves in more than one right precordial lead (V1–V3).[Citation44] In some patients, baseline ECG presents type 2 or 3 BrS ECG with J-point elevation without T-wave inversions, but conversion to type 1 ECG is needed for diagnosis of the syndrome during a class 1c drug challenge or, for example, during fever. Increased risk for SCD is associated with spontaneous type 1 ECG and extended intraventricular conduction defect related to type 1 BrS ECG either with prolonged QRS complex or fragmentation of the S-wave upstroke in right precordial leads.[Citation45,Citation46] Subsequent ER pattern in inferolateral leads has been associated with increased risk for SCD in some reports.
The characteristics of ER pattern have been presented elsewhere in this article. Isolated ER pattern is to be distinguished the ER syndrome, which is associated with a very high risk of ventricular arrhythmias. The diagnosis of ER syndrome basically requires the history of ventricular arrhythmias or family history of ER syndrome. Diagnostic criteria have been recently proposed. The ECG risk markers are ER pattern followed by horizontal ST segment. The risk increases concomitantly with the J-point amplitude and visible fluctuation of the J-point is an imminent risk marker for arrhythmias. The behavior of J-point elevation in ER syndrome during exercise has been thought to be useful in risk assessment, but this issue remains debated.[Citation47]
The role of ECG signal processing
Advances in computer technology and widespread use of digital EDGs have enabled application of digital signal processing methods for the analysis of ECGs, which could potentially aid the noninvasive identification of patients at risk for SCD. Currently, several novel electrocardiographic features are able to identify patients with increased risk of SCD and predict adverse outcome in various patient populations. Majority of these novel methods assess the heterogeneity of repolarization period as increased repolarization heterogeneity has been associated with electrical instability and propensity for lethal ventricular arrhythmias.
One of the first heterogeneity measures proposed was the QT dispersion (QTd), which is defined as the difference between the maximum and minimum QTc intervals within a single beat of 12-lead ECG. Increased QTd has been associated with an increased risk of ventricular arrhythmias and SCD.[Citation48] However, as significant controversy rose about the validity of the concept and the methodology of the measurement,[Citation49] research focus shifted toward spatial and morphological features of the ECG as they were expected to capture more clinically relevant information than simple interval or amplitude measurements. Among the first morphological methods used was the principal component analysis (PCA) of ST-T segment, which measures the complexity of the repolarization in 12-lead ECG. Increased complexity, indicative of more heterogeneous repolarization, has been associated with congenital heart diseases and with increased risk for cardiovascular mortality.[Citation49] However, in a recent general population-based study, PCA ratio was only univariately predictive of SCD.[Citation50]
Spatial measures, such as T-wave axis and spatial QRS/T angle (not to be confused with the frontal QRS/T angle), calculated through axis transformation or decomposition of the original 12-lead ECG, have been found predictive of SCD in various populations. In the Rotterdam Study, subjects with an abnormal T-wave axis had a 4.6-fold age- and sex-adjusted risk for SCD.[Citation51] Similarly, abnormal spatial QRS/T angle showed a 5.6-fold risk for SCD in the same study population.[Citation52] Measures of interlead T-wave heterogeneity have also shown promising results. T-wave morphology dispersion and T-wave heterogeneity measured with the second central moment technique, assess the morphological variability between different leads of the 12-lead ECG. Both of these variables have been associated with SCD in the general population with adjusted risk ratios ranging from two to threefold.[Citation50,Citation53] The breakthrough of these measures to clinical practice may take place soon as it was shown in a recent study combining two large general population cohorts that a risk score consisting of multiple measures of electric heterogeneity is independently associated with SCD and also improves risk prediction based on reclassification measures.[Citation54]
Conclusions
The ECG has been a central diagnostic tool providing a vast amount of prognostic information in the field of cardiology for over a century. During the last decade, a plethora of knowledge on the prognostic significance of various ECG abnormalities regarding SCD risk has been accumulated. Currently, the presence of these risk markers serves as an indicator of more advanced disease for the conversant clinician and warrants a close clinical evaluation of the patient. Some of these risk markers are presented in . It is likely that future studies refine the utility of the established markers in SCD risk stratification. Also, the prognostic significance of combinations of ECG risk markers, possibly together with other risk markers such as abnormalities detected by autonomous nervous system testing or imaging, may increase predictive power in SCD risk assessment. The progress in digital ECG signal processing will allow for automatic screening of individuals with high-risk ECG phenotypes from digital ECG archives.
Acknowledgements
We thank MSc Harri Rissanen and Professor Paul Knekt from The National Institute for Health and Welfare, Helsinki, Finland for providing us with the ECG presented in .
Disclosure statement
The authors report no conflicts of interest. The authors alone are responsible for the content and writing of this article.
References
- Chugh SS, Reinier K, Teodorescu C, et al. Epidemiology of sudden cardiac death: clinical and research implications. Prog Cardiovasc Dis. 2008;51:213–228.
- Deo R, Albert CM. Epidemiology and genetics of sudden cardiac death. Circulation. 2012;125:620–637.
- Jain R, Singh R, Yamini S, et al. Fragmented ECG as a risk marker in cardiovascular diseases. Curr Cardiol Rev. 2014;10:277–286.
- Rubart M, Zipes DP. Genesis of cardiac arrhythmias: electrophysiologic considerations. In: Bonow R, Braunwald E, editors. Braunwald's heart disease: a textbook of cardiovascular medicine. 9th ed. Philadelphia: Elsevier; 2012. pp. 653–686.
- Wolk R. Arrhythmogenic mechanisms in left ventricular hypertrophy. Europace. 2000;2:216–223.
- Bergner DW, Goldberger JJ. Diabetes mellitus and sudden cardiac death: what are the data. Cardiol J. 2010;17:117–129.
- Plourde B, Sarrazin J-F, Nault I, et al. Sudden cardiac death and obesity. Expert Rev Cardiovasc Ther. 2014;12:1099–1110.
- Aro AL, Huikuri HV. Electrocardiographic predictors of sudden cardiac death from a large Finnish general population cohort. J Electrocardiol. 2013;46:434–438.
- Kurl S, Mäkikallio TH, Rautaharju P, et al. The duration of QRS complex in resting electrocardiogram is a predictor of sudden cardiac death in men. Circulation. 2012;125:2588–2594.
- Terho HK, Tikkanen JT, Junttila JM, et al. Prevalence and prognostic significance of fragmented QRS complex in middle-aged subjects with and without clinical or electrocardiographic evidence of cardiac disease. Am J Cardiol. 2014;114:141–147.
- Darouian N, Narayanan K, Aro AL, et al. Delayed intrinsicoid deflection of the QRS complex is associated with sudden cardiac arrest. Heart Rhythm. 2016;13:927–932.
- Narayanan K, Reinier K, Teodorescu C, et al. Electrocardiographic versus echocardiographic left ventricular hypertrophy and sudden cardiac arrest in the community. Heart Rhythm. 2014;11:1040–1046.
- Straus SMJM, Kors JA, De Bruin ML, et al. Prolonged QTc interval and risk of sudden cardiac death in a population of older adults. J Am Coll Cardiol. 2006;47:362–367.
- Chugh SS, Reinier K, Singh T, et al. Determinants of prolonged QT interval and their contribution to sudden death risk in coronary artery disease: the Oregon sudden unexpected death study. Circulation. 2009;119:663–670.
- Nielsen JB, Graff C, Rasmussen PV, et al. Risk prediction of cardiovascular death based on the QTc interval: evaluating age and gender differences in a large primary care population. Eur Heart J. 2014;35:1335–1344.
- Wu S-H, Lin X-X, Cheng Y-J, et al. Early repolarization pattern and risk for arrhythmia death: a meta-analysis. J Am Coll Cardiol. 2013;61:645–650.
- Tikkanen JT, Huikuri HV. Characteristics of "malignant" vs "benign" electrocardiographic patterns of early repolarization. J Electrocardiol. 2015;48:390–394.
- Jouven X, Desnos M, Guerot C, et al. Predicting sudden death in the population: the Paris prospective study I. Circulation. 1999;99:1978–1983.
- Chen LY, Benditt DG, Alonso A. Atrial fibrillation and its association with sudden cardiac death. Circ J. 2014;78:2588–2593.
- Jouven X, Empana J-P, Schwartz PJ, et al. Heart-rate profile during exercise as a predictor of sudden death. N Engl J Med. 2005;352:1951–1958.
- Aro AL, Eranti A, Anttonen O, et al. Delayed QRS transition in the precordial leads of an electrocardiogram as a predictor of sudden cardiac death in the general population. Heart Rhythm. 2014;11:2254–2260.
- Myerburg RJ, Junttila MJ. Sudden cardiac death caused by coronary heart disease. Circulation. 2012;125:1043–1052.
- Zhang Z, Letsas KP, Yang Y, et al. Notching early repolarization pattern in inferior leads increases risk of ventricular tachyarrhythmias in patients with acute myocardial infarction: a meta-analysis. Sci Rep. 2015;5:15845.
- Dhar R, Alsheikh-Ali AA, Estes NAM, et al. Association of prolonged QRS duration with ventricular tachyarrhythmias and sudden cardiac death in the multicenter automatic defibrillator implantation trial II (MADIT-II). Heart Rhythm. 2008;5:807–813.
- Patel RB, Ng J, Reddy V, et al. Early repolarization associated with ventricular arrhythmias in patients with chronic coronary artery disease. Circ Arrhythm Electrophysiol. 2010;3:489–495.
- Furukawa Y, Yamada T, Morita T, et al. Early repolarization pattern associated with sudden cardiac death: long-term follow-up in patients with chronic heart failure. J Cardiovasc Electrophysiol. 2013;24:632–639.
- Cheema A, Khalid A, Wimmer A, et al. Fragmented QRS and mortality risk in patients with left ventricular dysfunction. Circ Arrhythm Electrophysiol. 2010;3:339–344.
- Bender SR, Friedman DJ, Markowitz SM, et al. Electrocardiographic left ventricular hypertrophy predicts arrhythmia and mortality in patients with ischemic cardiomyopathy. J Interv Card Electrophysiol. 2012;34:237–245.
- Oehler A, Feldman T, Henrikson CA, et al. QRS-T angle: a review. Ann Noninvasive Electrocardiol. 2014;19:534–542.
- Al-Zaiti SS, Fallavollita JA, Canty JM, et al. Electrocardiographic predictors of sudden and non-sudden cardiac death in patients with ischemic cardiomyopathy. Heart Lung. 2014;43:527–533.
- Al-Zaiti SS, Fallavollita JA, Canty JM, et al. The prognostic value of discordant T waves in lead aVR: a simple risk marker of sudden cardiac arrest in ischemic cardiomyopathy. J Electrocardiol. 2015;48:887–892.
- Hetland M, Haugaa KH, Sarvari SI, et al. A novel ECG-index for prediction of ventricular arrhythmias in patients after myocardial infarction. Ann Noninvasive Electrocardiol. 2014;19:330–337.
- Elliott PM, Anastasakis A, Borger MA, et al. 2014 ESC guidelines on diagnosis and management of hypertrophic cardiomyopathy: the task force for the diagnosis and management of hypertrophic cardiomyopathy of the European Society of Cardiology (ESC). Eur Heart J. 2014;35:2733–2779.
- Ostman-Smith I, Wisten A, Nylander E, et al. Electrocardiographic amplitudes: a new risk factor for sudden death in hypertrophic cardiomyopathy. Eur Heart J. 2009;31:439–449.
- Debonnaire P, Katsanos S, Joyce E, et al. QRS fragmentation and QTc duration relate to malignant ventricular tachyarrhythmias and sudden cardiac death in patients with hypertrophic cardiomyopathy. J Cardiovasc Electrophysiol. 2015;26:547–555.
- Marcus FI, McKenna WJ, Sherrill D, et al. Diagnosis of arrhythmogenic right ventricular cardiomyopathy/dysplasia: proposed modification of the task force criteria. Circulation. 2010;121:1533–1541.
- Buja G, Estes NAM, Wichter T, et al. Arrhythmogenic right ventricular cardiomyopathy/dysplasia: risk stratification and therapy. Prog Cardiovasc Dis. 2007;50:282–293.
- Chan C-S, Lin Y-J, Chang S-L, et al. Early repolarization of surface ECG predicts fatal ventricular arrhythmias in patients with arrhythmogenic right ventricular dysplasia/cardiomyopathy and symptomatic ventricular arrhythmias. Int J Cardiol. 2015;197:300–305.
- Link MS, Laidlaw D, Polonsky B, et al. Ventricular arrhythmias in the North American multidisciplinary study of ARVC: predictors, characteristics, and treatment. J Am Coll Cardiol. 2014;64:119–125.
- Priori SG, Blomström-Lundqvist C, Mazzanti A, et al. 2015 ESC Guidelines for the management of patients with ventricular arrhythmias and the prevention of sudden cardiac death. Eur Heart J. 2015;36:2793–2867.
- Zareba W, Moss AJ, Schwartz PJ, et al. Influence of genotype on the clinical course of the long-QT syndrome. International Long-QT syndrome registry research group. N Engl J Med. 1998;339:960–965.
- Gollob MH, Redpath CJ, Roberts JD. The short QT syndrome: proposed diagnostic criteria. J Am Coll Cardiol. 2011;57:802–812.
- Anttonen O, Junttila MJ, Maury P, et al. Differences in twelve-lead electrocardiogram between symptomatic and asymptomatic subjects with short QT interval. Heart Rhythm. 2008;6:267–271.
- Antzelevitch C, Brugada P, Borggrefe M, et al. Brugada syndrome: report of the second consensus conference: endorsed by the Heart Rhythm Society and the European Heart Rhythm Association. Circulation. 2005;111:659–670.
- Priori SG, Gasparini M, Napolitano C, et al. Risk stratification in Brugada syndrome: results of the PRELUDE (PRogrammed ELectrical stimUlation preDictive valuE) registry. J Am Coll Cardiol. 2011;59:37–45.
- Junttila MJ, Brugada P, Hong K, et al. Differences in 12-lead electrocardiogram between symptomatic and asymptomatic Brugada syndrome patients. J Cardiovasc Electrophysiol. 2007;19:380–383.
- Priori SG, Wilde AA, Horie M, et al. HRS/EHRA/APHRS expert consensus statement on the diagnosis and management of patients with inherited primary arrhythmia syndromes: document endorsed by HRS, EHRA, and APHRS in May 2013 and by ACCF, AHA, PACES, and AEPC in June 2013. Heart Rhythm. 2013;10:1932–1963.
- Somberg JC, Molnar J. Usefulness of QT dispersion as an electrocardiographically derived index. Am J Cardiol 2002;89:291–294.
- Okin PM, Xue Q, Reddy S, et al. Electrocardiographic quantitation of heterogeneity of ventricular repolarization. Ann Noninvasive Electrocardiol. 2000;5:79–87.
- Porthan K, Viitasalo M, Toivonen L, et al. Predictive value of electrocardiographic T-wave morphology parameters and T-wave peak to T-wave end interval for sudden cardiac death in the general population. Circ Arrhythm Electrophysiol. 2013;6:690–696.
- Kors JA, de Bruyne MC, Hoes AW, et al. T-loop morphology as a marker of cardiac events in the elderly. J Electrocardiol. 1999;31:54–59.
- Kardys I, Kors JA, van der Meer IM, et al. Spatial QRS-T angle predicts cardiac death in a general population. Eur Heart J. 2003;24:1357–1364.
- Kenttä TV, Nearing BD, Porthan K, et al. Prediction of sudden cardiac death with automated high-throughput analysis of heterogeneity in standard resting 12-lead electrocardiograms. Heart Rhythm. 2015;13:713–720.
- Waks JW, Sitlani CM, Soliman EZ, et al. Global electric heterogeneity risk score for prediction of sudden cardiac death in the general population: the Atherosclerosis Risk in Communities (ARIC) and Cardiovascular Health (CHS) studies. Circulation. 2016;133:2222–2234.