
Abstract
Objectives. Frontal plane QRS-T angle is a novel marker of myocardial repolarization, and an increased frontal plane QRS-T angle is associated with adverse cardiac outcomes. Slow coronary flow may cause fatal cardiac arrhythmias by causing electrical abnormalities and altering ventricular repolarization. We aimed to evaluate the frontal plane QRS-T angle in patients with slow coronary flow. Design. A total of 60 consecutive patients with slow coronary flow and 60 consecutive patients with normal coronary flow were enrolled into the study. Laboratory and some electrocardiography parameters including frontal plane QRS-T angle were compared between the two groups. Results. We have found that the angle of frontal QRS-T was higher in the group with slow coronary flow (p < .001). In addition, there was a negative correlation between thrombolysis in myocardial infarction frame count and frontal QRS-T angle (r = −0.496, p < .001). Conclusions. In conclusion, increased frontal plane QRS-T angle might be an important indicator of slow coronary flow.
Introduction
Slow coronary flow (SCF) is an important coronary angiographic phenomenon characterized by delayed progression of angiographic contrast media in the coronary arteries despite the absence of obstructive coronary artery disease (CAD) [Citation1]. The incidence of SCF has a range between 1% and 7% among patients undergoing coronary angiography [Citation1]. It is evidently known that SCF is associated with angina pectoris, myocardial infarction, sudden cardiac death and life-threatening arrhythmias [Citation2,Citation3]. Impaired myocardial blood flow in SCF may provoke fatal cardiac arrhythmias by causing electrical abnormalities and altering ventricular repolarization [Citation4].
Frontal plane QRS‐T [f(QRS‐T)] angle defined as the angle between the directions of ventricular depolarization (QRS axis) and repolarization (T axis), was described as a novel marker of ventricular repolarization heterogeneity [Citation5]. Its measurement can easily be performed from surface electrocardiography (ECG) by subtracting the QRS axis from the T axis, because QRS and T‐wave axes are mostly available in the automatic reports of many 12‐lead ECG devices [Citation5]. Previously performed studies have shown the prognostic value of the f(QRS‐T) angle in the different populations [Citation6,Citation7]. In addition to these studies, a previous study [Citation8] indicated that a wide f(QRS‐T) angle (>90°) is a good discriminator of long‐term mortality in patients having left ventricular systolic dysfunction after an acute myocardial infarction.
SCF may cause fatal cardiac arrhythmias by causing electrical abnormalities and altering ventricular repolarization. This situation leads to the need for investigation for new risk stratification parameters of SCF. In patients with SCF, ventricular repolarization has been evaluated by using T wave, QT interval Tpe interval and Tpe/QT measurements until now. However, f(QRS‐T) angle which is a novel repolarization index, has not been studied in these patients. In this study, we aimed to investigate ventricular repolarization in patients with SCF by using the ECG parameters including f(QRS‐T) angle.
Material and methods
Study population
Between October 2016 and March 2017, 2568 patients who underwent coronary angiography due to clinical suspicion or myocardial ischemia demonstrated by exercise stress testing or myocardial perfusion scintigraphy were evaluated at Turkiye Yuksek Ihtisas Training and Research Hospital. Two groups were constituted. Sixty consecutive patients showing SCF with normal coronary artery anatomy and without atherosclerotic CAD were selected as the patient group (SCF group) and a control group was formed from randomly selected 60 patients who had undergone coronary angiography and was not detected CAD in; and with a normal coronary flow (NCF) pattern showing normal myocardial blushing and clearing.
We obtained a detailed medical history from all patients and performed a complete physical examination. The patients were evaluated by means of 12-lead electrocardiography. The detailed transthoracic echocardiography of all the patients were performed by two experienced specialists . Patients with hypertension was diagnosed by a systolic blood pressure of 140 mm Hg or higher, or a diastolic blood pressure of 90 mm Hg or higher by at least three different measurements, or the use of anti-hypertensive medication. The diagnosis of diabetes mellitus was established by a fasting blood glucose of 7.0 mmol/L or higher, or the use of anti-diabetic medication. Hyperlipidemia was defined as total cholesterol levels of 5.2 mmol/L or higher, or a history of statin use except in the last 3 months. Patients smoking before hospitalization were accepted as smokers.
Patients with known coronary artery disease, acute coronary syndrome, peripheral arterial disease, congestive heart failure with an ejection fraction <55%, history of surgical or interventional cardiovascular procedure, stroke, pulmonary hypertension, valvular heart disease, cardiomyopathies, myocarditis, pericarditis, hepatic or renal dysfunction, chronic inflammatory diseases, malignancies, active infections, and endocrine or metabolic disorders except diabetes mellitus were excluded from the study to make a homogeneous study group. Patients taking antiaggregants, anticoagulants, corticosteroids, statins in the last 3 months, anti-oxidant vitamins and alcohol were also excluded from the study.
The study protocol was approved by the local ethics committee and written informed consent was taken from all patients. The study was conducted in accordance with the Declaration of Helsinki, Good Clinical Practice and International Conference on Harmonization guidelines.
Electrocardiography
The 12-lead ECG was recorded at a paper speed of 50 mm/s in the supine position (Nihon Kohden, Tokyo, Japan). All of the ECGs were scanned and transferred to a personal computer to decrease the error measurements and then used for ×400% magnification by Adobe Photoshop software. ECG measurements of QT and Tp-e intervals were performed by two cardiologists blinded to the patient data. Subjects with U waves on their ECGs were excluded from the study. An average value of three readings was calculated for each lead. The QT interval was measured from the beginning of the QRS complex to the end of the T wave and corrected for heart rate using the Bazett formula: cQT = QT√(R-R interval). The Tp-e interval was defined as the interval from the peak of T wave to the end of T wave. The Tp-e interval were measured from precordial leads [Citation9]. Frontal QRS and T‐wave axes were present in the automatic reports of the ECG machine. The calculation of f(QRS‐T) angle was made from these axes as absolute difference between frontal plane QRS axis and frontal plane T axis. In case the angle exceeds 180°, it was calculated by subtracting from 360° [Citation5,Citation6,Citation10]. The subjective component of the individual measurements have been ruled out by calculating f(QRS‐T) angle based on automatic report of ECG machine.
Coronary angiography
Two experienced interventional cardiologists blinded to the clinical characteristics of the patients performed coronary angiography by using the standard Judkins technique. We used Iohexol as a nonionic contrast agent during coronary angiography in all patients and control subjects. During coronary angiography, the contrast agent was manually injected as approximately 6 to 10 ml as at each position. The coronary arteries were visualized in the standard planes. Coronary flow rates of all patients were documented using the Thrombolysis in Myocardial Infarction frame count (TIMI) method described by Gibson et al. [Citation11]. The TFCs of the left anterior descending (LAD) and circumflex (Cx) arteries were assessed in either the right anterior oblique projection with caudal angulations or the left anterior oblique projection with cranial angulations and that of the right coronary artery [Citation12] usually in straight left anterior oblique projection. The initial frame is defined as the frame in which concentrated dye occupies the full width of the proximal coronary artery lumen, touching both borders of the lumen, and forward motion down the artery. The final frame is defined as the frame when the leading edge of the contrast column initially arrives at the distal end. The last frames used for the LAD, Cx and RCA were those in which the dye first entered the mustache segment, the distal bifurcation segment, and the first branch of the posterolateral artery, respectively. The final count was then subtracted from the initial count and the exact TFC was calculated for the given artery. The TFC of the LAD artery was corrected by dividing the final count by 1.7. Due to different durations required for normal visualization of coronary arteries, the corrected cutoff values were 36.2 ± 2.6 frames for LAD, 22.2 ± 4.1 frames for Cx, and 20.4 ± 3.0 frames for the RCA as reported previously in the literature [Citation11]. Patients with a TFC greater than two standard deviations from the normal published range for any one of the three vessels were assigned as SCF. The mean TFC for each patient and control subject was calculated by adding the TFCs for LAD, Cx and RCA and then dividing the obtained value by three.
Laboratory measurements
Samples were taken from the antecubital vein when the patients were admitted to the hospital. Basal creatinine level, white blood cell count (WBC), platelet count and hemoglobin concentration were measured.The following morning after admission to the hospital, lipid profile and other biochemical parameters were measured using standard techniques.
Statistical analysis
All statistical analyses were performed using SPSS for Windows version 19.0 (SPSS, Chicago, IL). Number of each group was adjusted as 60 patients. Because we calculated the minimum number of individuals that should be sampled with 90% power and 0.05 Type-I error as at least 46 (R 3.0.1. open source program). The primary effect variable was determined as the QRS angle. 1% change in total f(QRS‐T) angle [3.6 degrees on f(QRS‐T) plane] was accepted as clinically relevant. Standard deviation of the primary effect variable was calculated as ±0.18. For the descriptive statistics of the data, mean, standard deviation, rate, and frequency values were used. The Kolmogorov–Smirnov test was used to evaluate whether the distribution of continuous variables was normal. For the analysis of parametric data, Student’s t-test was used. For the analysis of nonparametric data, the Mann–Whitney U-test was used. The χ2 test was used to compare the categorical variables between groups. For correlation analysis, Pearson correlation analysis was used. Logistic regression analysis was used to determine the impact of variables. Standardized β coefficients and 95% confidence intervals (CI) were calculated. Statistical significance was defined as p < .05.
Results
Baseline clinical and demographic characteristics of the study population are shown in . There was no difference between groups in terms of age, body mass index, gender, diabetes mellitus, hypertension, dyslipidemia and family history status. Number of smokers were higher in the SCF group than the NCF group (p = .306). The laboratory findings of the patients and controls are shown in . High-sensitivity C-reactive protein levels were higher in the SCF group than the NCF group (p = .030).
Table 1. Baseline characteristics of the study groups (n = 120).
Table 2. Comparisons of laboratory findings, TIMI frame counts and ECG parameters.
The electrocardiographic parameters of the groups are presented in . Although QT and QTc intervals were not different between groups, Tpe interval was prolonged in the SCF group compared to the control group (p < .001). Tpe/QT ratio and Tpe/QTc ratio were higher in SCF patients compared to the control group (p < .001). We also found that f (QRS-T) angle was higher in the SCF group than the control group (p < .001). There was a negative correlation between TIMI frame count and f (QRS-T) angle (r = −0.496, p < .001), ().
Figure 1. The correlation between f(QRS)‐T angle and timi frame count.
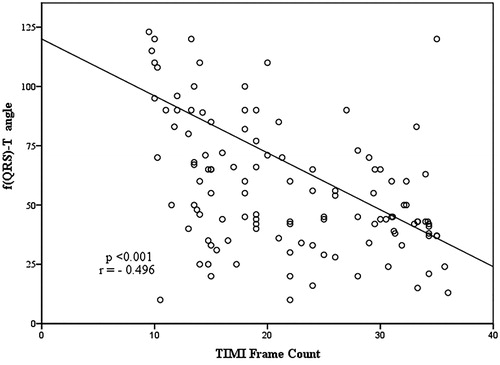
Table 3. Comparisons of ECG parameters.
Discussion
The results of our study revealed that Tpe interval, Tpe/QT, and Tpe/QTc ratios were considerably prolonged in patients with SCF compared to patients with normal coronary flow. And it was observed that f (QRS-T) angle increased in patients with SCF. Also, we detected a positive correlation between the presence of coronary slow flow and these novel indicators.
f(QRS‐T) angle is a novel marker of myocardial depolarization and repolarization heterogeneity. It is defined as the angle between electrical directions of ventricular depolarization and repolarization [Citation5,Citation10]. Previous studies demonstrated that the QRS‐T angle was more reliable and reproducible, and less susceptible to noise and problems of definition than other traditional electrocardiographic myocardial repolarization parameters [Citation10,Citation13]. There are two different methods to calculate it: first one is three‐dimensional space, spatial QRS‐T angle and second one is a projection on the frontal plane in a standard 12‐lead ECG, frontal QRS‐T angle [Citation5,Citation6]. The calculation of spatial angle is so complicated that it necessitates software programs and cannot be routinely calculated with daily used ECG devices [Citation5,Citation6]. In contrary, f(QRS‐T) angle can be easily calculated from surface ECG by subtracting the QRS axis from T axis, because most of the ECG devices report automatically QRS and T axes [Citation14]. In addition, a previous study reported that f(QRS‐T) angle is an appropriate clinical substitute for the spatial QRS‐T angle in risk prediction [Citation15]. So, we used frontal QRS‐T angle in this study. In general, the directions of the myocardial depolarization axis and repolarization axis have the similar orientation. Therefore, f(QRS‐T) angle has a tendency to be narrow (<45°) [Citation16]. A wider f(QRS‐T) angle indicates discordance between ventricular depolarization phase and repolarization phase and poor outcomes in patients with ST elevation miyocardial infarction (STEMI) [Citation8]. In our study, we found a increment in QRS-T angle and detected that it raised above 45° in SCF patients, which is accepted as normal [Citation16].
Increasing of ventricular repolarization dispersion is related with malign arrhythmias and has a prognostic importance for mortality and sudden cardiac death [Citation17]. QT dispersion was noted as a sign of increased dispersion of repolarization but finally lost its significance due to being a defective term [Citation18]. Nowadays, the Tp-e interval and Tp-e/QT ratio have been perceived as actual markers of increased dispersion of ventricular repolarization [Citation19]. Prolongation of Tp-e interval has an association with increased mortality in Brugada syndrome, long QT syndrome and in patients with acute STEMI [Citation19]. Nonetheless, changes in body weight and heart rate affect Tp-e interval [Citation20]. In recent studies, the Tp-e/QT ratio was reported to be a more accurate measure of the dispersion of ventricular repolarization than QT dispersion, QTc dispersion and Tp-e intervals, and to be independent of variations in heart rate [Citation20]. Also, Tp-e/QT ratio has an evident potential as a significant indicator of arrhythmogenesis under the conditions of short, normal and long QT interval [Citation19]. In our study, Tp-e/QT ratio and Tp-e interval in SCF patients were determined to be prolonged.
The underlying pathophysiological mechanisms of primary SCF have not been evidently demonstrated by now. Mosseri et al. have shown that medial hypertrophy, myointimal proliferation, endothelial degeneration with changes of myofibrillar degenerative foci and lipofuscin deposits at the electron microscopic level, can lead to endothelial dysfunction in patients with SCF [Citation21,Citation22]. Many studies have found that inflammation is one of the main factors leading to SCF [Citation23,Citation24]. Increased sympathetic activity leading to coronary adrenergic hyperactivity may be the cause of reduction in coronary blood flow and angina. Higher adrenalin and noradrenalin levels have been shown in SCF patients compared to individuals with normal coronary flow. Therefore, adrenergic hyperactivity may play a role in the pathogenesis of SCF with the recommendation of this finding [Citation12]. An improvement in microvascular tone and coronary flow with microvascular vasodilators indicating a functional increased microvascular resistance in patients with SCF was also reported by Kurtoglu et al. [Citation25]. Variations in cardiac autonomic neural tone and elevated sympathetic activity on the ventricular myocardium had a relation with total dispersion of repolarization and an increased risk of arrhythmia [Citation26]. Total dispersion of repolarization, reflects the heterogeneity like f (QRS-T) angle [Citation20]. Kosus et al. [Citation27] reported that increased adrenergic activity might be the manifestation of slow increase in sympathetic tonus and a decrease in vagal tonus by analyzing 24-hour Holter records in patients with SCF. Also, Yazıcı et al. [Citation12] found higher noradrenaline and adrenaline levels in patients with coronary flow. Therefore, alterations in autonomic neural tone may be another reason for the increment of f(QRS‐T) angle in patients with SCF.
Several studies showed that SCF results in myocardial ischemia, and vasodilator agents effective in coronary microcirculation can relieve ischemia by normalizing coronary flow. Zhang et al. [Citation10] detected that the increase in f (QRS-T) angle was associated with myocardial ischemia and found normalization of f (QRS-T) angle after successful revascularization therapy. Ischemia caused by microvascular dysfunction may be responsible for the heterogeneity of ventricular repolarization in SCF.
There may be another possible reason for the heterogeneity of ventricular repolarization in SCF. Acar et al. [Citation28] recently showed that indexes of electrocardiographic ventricular repolarization are correlated with systemic inflammation. Also, increased inflammatory activity is accused of the pathogenesis of arrhythmia either by direct arrhythmogenic effects by locally activating complement or by induction of oxidative stress and apoptosis [Citation29]. Li et al. [Citation30] detected that the plasma concentration of inflammation markers, such as high-sensitivity C-reactive protein and interleukin-6, were elevated and positively correlated with TIMI frame count in patients with SCF. Inflammation may also be an explanation of the heterogeneity of ventricular repolarization in patients with SCF but needs to be investigated further.
Frontal QRS-T angle is a simple and easily available parameter which does not necessitate an additional expense. This costless and useful parameter may provide the clinicians to predict patients with SCF, which may cause fatal cardiac arrhythmias by causing electrical abnormalities and altering ventricular repolarization [Citation4]. Widened QRS-T angle may help physicians to predict adverse cardiac events in this patient population [Citation31]. This novel parameter, which is more reliable, consistent and less susceptible to false calculation and definition than other traditional electrocardiographic myocardial repolarization parameters, more precisely make us to predict fatal cardiac arrhythmias [Citation10,Citation13]. That is why, this ECG parameter may provide the physicians to take more strict precautions and precedingly modify risk factors regarding widened QRS-T angle. The data obtained from this study shows that frontal QRS-T angle has the potential to use in risk stratification slow coronary flow.
Disclosure statement
The authors declared no potential conflicts of interest with respect to the research, authorship, and/or publication of this article.
References
- Wang X, Nie S-P. The coronary slow flow phenomenon: characteristics, mechanisms and implications. Cardiovasc Diagn Ther. 2011;1(1):37–43.
- Beltrame JF, Limaye SB, Horowitz JD. The coronary slow flow phenomenon–a new coronary microvascular disorder. Cardiology. 2002;97(4):197–202.
- Mangieri E, Macchiarelli G, Ciavolella M, et al. Slow coronary flow: clinical and histopathological features in patients with otherwise normal epicardial coronary arteries. Cathet Cardiovasc Diagn. 1996;37(4):375–381.
- Saya S, Hennebry TA, Lozano P, et al. Coronary slow flow phenomenon and risk for sudden cardiac death due to ventricular arrhythmias: a case report and review of literature. Clin Cardiol. 2008;31(8):352–355.
- Macfarlane PW. The frontal plane QRS-T angle. Europace. 2012;14(6):773–775.
- Oehler A, Feldman T, Henrikson CA, et al. QRS‐T angle: a review. Ann Noninvasive Electrocardiol. 2014;19(6):534–542.
- Aro AL, Huikuri HV, Tikkanen JT, et al. QRS-T angle as a predictor of sudden cardiac death in a middle-aged general population. Europace. 2012;14(6):872–876.
- Raposeiras-Roubin S, Virgos-Lamela A, Bouzas-Cruz N, et al. Usefulness of the QRS-T angle to improve long-term risk stratification of patients with acute myocardial infarction and depressed left ventricular ejection fraction. Am J Cardiol. 2014;113(8):1312–1319.
- Hevia JC, Antzelevitch C, Bárzaga FT, et al. Tpeak-Tend and Tpeak-Tend dispersion as risk factors for ventricular tachycardia/ventricular fibrillation in patients with the Brugada syndrome. J Am Coll Cardiol. 2006;47(9):1828–1834.
- Zhang ZM, Rautaharju PM, Prineas RJ, et al. Electrocardiographic QRS-T angle and the risk of incident silent myocardial infarction in the Atherosclerosis Risk in Communities study. J Electrocardiol. 2017;50(5):661–666.
- Gibson CM, Cannon CP, Daley WL, et al. TIMI frame count: a quantitative method of assessing coronary artery flow. Circulation. 1996;93(5):879–888.
- Yazici M, Demircan S, Durna K, et al. The role of adrenergic activity in slow coronary flow and its relationship to TIMI frame count. Angiology. 2007;58(4):393–400.
- Dilaveris P, Antoniou CK, Gatzoulis K, et al. T wave axis deviation and QRS-T angle - Controversial indicators of incident coronary heart events. J Electrocardiol. 2017;50(4):466–475.
- Li YH, Ren XJ, Han ZH, et al. Value of the frontal planar QRS-T angle on cardiac dysfunction in patients with old myocardial infarction. Int J Clin Exp Med. 2013;6(8):688–692.
- Zhang ZM, Prineas RJ, Case D, et al. Comparison of the prognostic significance of the electrocardiographic QRS/T angles in predicting incident coronary heart disease and total mortality (from the atherosclerosis risk in communities study). Am J Cardiol. 2007;100(5):844–849.
- Gungor M, Celik M, Yalcinkaya E, et al. The value of frontal planar QRS-T angle in patients without angiographically apparent atherosclerosis. Med Princ Pract. 2017;26(2):125–131.
- de Bruyne MC, Hoes AW, Kors JA, et al. QTc dispersion predicts cardiac mortality in the elderly: the Rotterdam Study. Circulation. 1998;97(5):467–472.
- Kors JA, Ritsema van Eck HJ, van Herpen G. The meaning of the Tp-Te interval and its diagnostic value. J Electrocardiol. 2008;41(6):575–580.
- Gupta P, Patel C, Patel H, et al. T(p-e)/QT ratio as an index of arrhythmogenesis. J Electrocardiol. 2008;41(6):567–574.
- Antzelevitch C, Sicouri S, Di Diego JM, et al. Does Tpeak-Tend provide an index of transmural dispersion of repolarization?. Heart Rhythm. 2007;4(8):1114–1116. Author reply 6–9.
- Mosseri M, Yarom R, Gotsman MS, et al. Histologic evidence for small-vessel coronary artery disease in patients with angina pectoris and patent large coronary arteries. Circulation. 1986;74(5):964–972.
- Yucel H, Ozaydin M, Dogan A, et al. Evaluation of plasma oxidative status in patients with slow coronary flow. Kardiol Pol. 2013;71(6):588–594.
- Gasparyan AY, Ayvazyan L, Mikhailidis DP, et al. Mean platelet volume: a link between thrombosis and inflammation?. Curr Pharm Des. 2011;17(1):47–58.
- Yayla Ç, Akboğa MK, Gayretli Yayla K, et al. A novel marker of inflammation in patients with slow coronary flow: lymphocyte-to-monocyte ratio. Biomarkers Med. 2016;10(5):485–493.
- Kurtoglu N, Akcay A, Dindar I. Usefulness of oral dipyridamole therapy for angiographic slow coronary artery flow. Am J Cardiol. 2001;87(6):777–779.
- Cappato R, Alboni P, Pedroni P, et al. Sympathetic and vagal influences on rate-dependent changes of QT interval in healthy subjects. Am J Cardiol. 1991;68(11):1188–1193.
- Koşuş A, Sağkan O, Dursun I, et al. Heart rate variability and QT dispersion in patients with slow coronary flow. Turk Kardiyol Dern Ars. 2004;32(1):10–15.
- Acar G, Yorgun H, Inci MF, et al. Evaluation of Tp-e interval and Tp-e/QT ratio in patients with ankylosing spondylitis. Mod Rheumatol. 2014;24(2):327–330.
- Mountantonakis S, Deo R. Biomarkers in atrial fibrillation, ventricular arrhythmias, and sudden cardiac death. Cardiovasc Ther. 2012;30(2):e74–80.
- Li JJ, Qin XW, Li ZC, et al. Increased plasma C-reactive protein and interleukin-6 concentrations in patients with slow coronary flow. Clin Chim Acta. 2007;385(1-2):43–47.
- Rautaharju PM, Kooperberg C, Larson JC, et al. Electrocardiographic abnormalities that predict coronary heart disease events and mortality in postmenopausal women: the Women’s Health Initiative. Circulation. 2006;113(4):473–480.