
Abstract
Objectives. In grading of aortic stenosis, two-dimensional transthoracic echocardiography (2D TTE) routinely results in underestimation of the left ventricular outflow tract (LVOT) area, and hence the aortic valve area (AVA). We investigated whether three-dimensional (3D) TTE measurements of the LVOT would be more accurate. We evaluated the feasibility, agreement and inter-observer variability of 3D TTE LVOT measurements with computed tomography (CT) and Haegar sizers as reference. Design. Sixty-one patients with severe aortic stenosis were examined with 2D and 3D TTE. 41 had CT and 13 also had perioperative Haegar sizing. Pearson’s correlation and Bland-Altman plots were used to compare methods. Inter-observer variability was tested for 2D and 3D TTE. Trial registration: Current research information system in Norway (CRISTIN). Id: 555249. Results. Feasibility was 67% with 3D TTE and 100% with 2D TTE and CT. Mean LVOT area for 2D, 3D, CT and Haegar sizers were 3.7 ± 0.6 cm2, 4.0 ± 0.9 cm2, 5.2 ± 0.8 cm2 and 4.4 ± 1.0 cm2 respectively. Bias and limits of agreements for 2D TTE was 1.5 ± 1.3 cm2, compared with CT and 0.4 ± 1.5 cm2 with Haegar sizers. Corresponding results for 3D TTE were 1.2 ± 1.6 cm2 and 0.2 ± 1.8 cm2. Intraclass correlation coefficients for LVOT area were 0.62 for 3D and 0.86 for 2D. Conclusions. 2D TTE showed better feasibility and inter-observer variability in measurements of LVOT than 3D TTE. Both echocardiographic methods underestimated LVOT area compared to CT and Haegar sizers. These observations suggest that 2D TTE is still preferable to 3D TTE in the assessment of aortic stenosis.
Introduction
Current guidelines for the management of aortic stenosis from the European Society of Cardiology state that echocardiography is the key imaging tool for the grading of aortic stenosis, and theoretically, evaluation of the aortic valve area (AVA) is the most important [Citation1]. However, guidelines recognize echocardiographic limitations for the calculation of the AVA. Careful consideration is required in the approximately 30% of patients who have symptoms that might be caused by aortic stenosis, but echocardiographically with a discordant grading, where the AVA is classified as severe (<1cm2), whilst the mean gradient is not (<40 mmHg) [Citation2,Citation3]. Differentiating patients with pseudo-severe from those with truly severe aortic stenosis can be challenging, yet important, because the latter will benefit from intervention.
Calculating the AVA from two-dimensional transthoracic echocardiography (2D TTE) depends on measurements of the left ventricular outflow tract (LVOT) diameter, which is associated with several pitfalls. Important challenges are calcification, an incorrect angle of the ultrasonographic beam, that the diameter measured in 2D is the shortest diameter in the often elliptically shaped LVOT [Citation4], and that the measurement error of the diameter is squared for AVA calculations leading to an underestimation of the AVA [Citation5,Citation6].
These challenges have initiated the search for other modalities in the evaluation of aortic stenosis including three-dimensional (3D) echocardiography, computed tomography (CT) and magnetic resonance imaging. CT is currently recognized as the reference method for LVOT area measurement prior to transcatheter aortic valve implantation (TAVI), with excellent inter- and intraobserver variability [Citation7]. Theoretically, LVOT area derived from CT could be used in the continuity equation and provide a more accurate calculation of AVA and hence provide useful information for clinical decision-making in the situation of discordant grading [Citation8]. Unfortunately, many patients cannot undergo CT due to various contraindications i.e. allergies and reduced renal function. In serial follow-up radiation becomes a concern. 3D transoesophageal echocardiography has shown promising results [Citation9,Citation10], but due to patient discomfort and small, but significant risk of the procedure it is not suited for serial follow-up.
We hypothesised that measuring LVOT dimensions with 3D TTE would be more accurate than with 2D TTE and that 3D derived LVOT measurements could be used in the continuity equation for calculating the AVA and thereby be more helpful in the situation of discordant grading. 3D TTE may be the preferred method for serial follow-up in aortic stenosis in the future, and could also be useful in the planning of TAVI. In this context, we also wanted to investigate the feasibility and inter-observer variability of 3D TTE compared to 2D TTE. We used CT and perioperative measurement by Haegar sizers as references for the echocardiographic measurements.
Materials and method
Study population and flow
Between February 2013 and January 2016 we enrolled 61 patients with severe aortic stenosis as evaluated by 2D TTE. These patients had been referred to a tertiary hospital to evaluate whether they should be treated with conventional surgery or TAVI. Before evaluation at the tertiary hospital all patients had an additional echocardiographic examination at Vestfold Hospital Trust, a primary hospital, using both 2D TTE and 3D TTE according to a standardized protocol.
After a full preoperative assessment at the tertiary hospital, including clinical evaluation, 2D TTE and coronary angiography, all patients were evaluated by a multidisciplinary heart team and offered open heart surgery, TAVI or no intervention. The heart team was blinded to the echocardiographic examination performed as part of the study protocol, and these recordings had no influence on their decision. Patients were referred to a CT as part of the study protocol. Where possible, the surgeon was asked to do a perioperative measurement of the LVOT area with Haegar sizers of the patients who underwent open heart surgery. The radiologist, surgeon and echocardiographer were blinded to the other modality results.
We excluded patients <18 years of age, patients with atrial fibrillation with a frequency of >100 beats/minute and patients who could not undergo CT because of contrast allergy or renal impairment. CT was performed within six months of echocardiography. The study was approved by the Regional Ethics committee and informed consent forms were signed by all participants on inclusion.
Transthoracic echocardiography
2D and 3D TTE were obtained subsequently with patients in the left lateral decubitus position using General Electric scanner Vivid E9 (Vingmed Ultrasound, Horten, Norway). Offline analyses were performed using Echopac software version 13.0.
2D TTE
Left ventricular (LV) end-diastolic and end-systolic volume index and LV ejection fraction (EF) were calculated with the Simpson’s biplane method. The degree of calcification of the aortic valve was scored according to the following grading: none (no calcification), mild (isolated small spots), moderate (multiple bigger spots) and severe (extensive calcification of all cusps) [Citation11]. Standard 2D TTE evaluation of aortic stenosis was done according to current European Society of Cardiology guidelines [Citation1]. The antegrade systolic velocity across the narrowed aortic valve was measured with continuous wave Doppler both from the apical window and the right-sided parasternal views. The recording with the highest velocity on the average of three beats in sinus rhythm was selected for the continuity equation. For patients in atrial fibrillation an average of five beats was used. LV mass was measured in the parasternal long axis view as recommended by European Association of Cardiovascular imaging/American Society of Echocardiography (EACVI/ASE) [Citation12]. For LVOT velocity time integral, a pulsed wave recording from the apical window was applied, with the sample volume moved approximately 0.5 cm from the valve. Other valvular pathologies were reported if categorized as more than moderate according to guidelines [Citation1].
LVOT diameter was measured in the parasternal view at the base of the aortic leaflets and at the maximum opening of the aortic valve in systole, as recommended by EACVI/ASE [Citation13].
3D TTE
Real-time, multibeat and zoomed images of the LVOT were obtained from the parasternal long axis view. Measurements of LVOT dimensions were performed by the commercially available software application Flexislice, (GE Healthcare, Horten, Norway), which provides three moveable guidelines representing three orthogonal cut planes. The optimal transverse plane of the LVOT was found and the minimum and maximum diameters were measured. The LVOT area was measured directly with planimetry at the maximum opening of the valve in systole (). Elliptical area was calculated from the maximum and minimum diameter.
Figure 1. Illustration of left ventricular outflow tract in three-dimensional echocardiography and with computer tomography. (a) Example of measurement of LVOT in 3D TTE from the parasternal long-axis view. The 3D images were analysed through three different orthogonal cut planes: The white is a short axis plane of the LVOT and the green and yellow are sagittal views of the ascending aorta. The yellow and green lines were moved to the hinges of the aortic valve to measure the LVOT. (b) Example of CT images and software used to obtain the optimal view of the aortic annulus using three lines representing three orthogonal cut planes.

The quality of the images was graded by the two investigators by consensus, classifying them into “sufficient” (sufficient quality to perform relevant measurements) and “inadequate” (excluded due to poor image quality and not being able to find traceable borders of the LVOT).
To investigate inter-observer variability, both echocardiographers performed consecutively, repeated measurements offline of the LVOT area in 20 patients, with 2D TTE and 3D TTE using the Flexislice application method. They were blinded to the measurements of each other.
Computed tomography
The contrast enhanced CT examinations were acquired with a 320-detector row CT scanner (Aquilion ONE, Toshiba Medical Systems, Otawara, Japan) using either retrospective electrocardiographic gating or prospective electrocardiographic-triggering. CT datasets were reconstructed in systole (20, 25, 30, and 35% of the RR cycle) and diastole (RR 75%). The systolic phase with the best image quality was used for further analysis. The diastolic phase was only used if none of the systolic datasets were of adequate image quality.
Image analysis was performed on a dedicated workstation (Vitrea fX, Vital Images, Minnetonka, MN, USA). An orthogonal plan of the aortic annulus was reconstructed using a double oblique multiplanar view, which was used to measure the area, maximum and minimum diameter of the annulus (). As for 3D TTE, elliptic area was calculated from the maximum and minimum diameter.
Haegar sizers
As an alternative reference method potentially closer to the true anatomical area of the LVOT area, Haegar sizers were used as applied by Kempfert et al. [Citation10] in the comparison of both CT and TTE prior to aortic valve replacement. For open heart surgery, cardiopulmonary bypass was established. After cross clamping and cardioplegia, transverse opening of aorta ascendens was performed followed by the removal of aortic cusps and decalcification. The Haegar sizers were fitted into the aortic annulus. If the sizer passed through easily then the next larger sizer was tried. An oval decalcified annulus would adapt to the circular shape of the sizer. The definitive size was concluded when the sizer barely passed through.
Hybrid methods for calculating AVA using the continuity equation
The AVA was calculated with standard use of the continuity equation in 2D TTE. The AVA was also calculated using the continuity equation with the LVOT area measured with 3D TTE, CT and Haegar sizers respectively, using the Doppler recordings from the 2D TTE.
Statistical analysis
Statistical analysis was carried out with SPSS 21.0. (SPSS, Inc., Chicago, IL, USA). Data are presented as mean and standard deviations for continuous variables and as frequencies and relevant percentages for categorical variables. Normality of distributions for continuous variables was tested with the Shapiro–Wilk test. Means of variables in different groups were compared with the independent-sample t-test, Fischers Exact test or Chi Square test as appropriate. A Pearson’s correlation coefficient was calculated to evaluate the association between 2D TTE and 3D TTE values compared to the CT and Haegar sizer values. One-sample t-tests were used to test the difference of the 2D and 3D area versus the CT and Haegar sizer area. Bland-Altman plots were created for the LVOT areas from 2D and 3D TTE compared with both CT and Haegar sizers. For inter-observer variability of the 2D diameter and 3D LVOT area measurements, test-retest reliability was calculated by comparing the values obtained from the two examinations using intra-class correlation coefficient (ICC).
Results
Patient characteristics and feasibility
Sixty-one patients were included. Four patients were not offered any intervention: One was evaluated at the tertiary hospital to have only moderate aortic stenosis, two were considered to have too high perioperative risk, and one died before intervention. Of the remaining patients, 42 (74%) underwent open valve surgery and 15 (26%) TAVI. All patients had 2D and 3D TTE recordings, and 41 had a CT per study protocol at the tertiary hospital. The most frequent reasons for not having a CT were logistic challenges (Additional file 1). A flow chart of the 61 patients included and the different measurement modalities is provided in Additional File 2. LVOT measurements was possible in all available images by 2D TTE (n = 61) and CT (n = 41). One patient was measured in the diastolic phase on CT images. Feasibility of 3D TTE LVOT measurement was 67% (n = 61) of the total study participants. In the CT group, 30 patients (73%) had sufficient quality 3D recordings for measurement of LVOT dimensions. Additionally, of these 30 patients, 13 had measurements by Haegar sizers during open valve surgery, allowing comparisons of all four methods in only a small subset of patients. The reason for no Haegar sizing was purely of a logistical nature. Characteristics of all patients (n = 61) are presented in , including a comparison between patients with adequate (n = 41) versus inadequate (n = 20) 3D recordings for LVOT measurements. The 20 patients whose 3D TTE measurements of the annulus were of inadequate quality had significantly higher max velocity and mean gradients than those with sufficient quality. There was a high prevalence of extensive calcification in both groups.
Table 1. Clinical and echocardiographic characteristics of the study population.
LVOT dimensions and AVA calculations
lists the mean values ± SD for LVOT area, elliptical area, minimum and maximum diameter for the 30 patients examined with both echocardiographic methods and CT, and minimum diameter and LVOT area of the 13 patients measured with Haegar sizers. With CT as reference, LVOT area was underestimated with all three alternative methods, being most pronounced by 2D followed by 3D and Haegar sizing. The t-tests comparing the difference of the 2D area and 3D area versus the CT and Haegar sizer area were statistically significant (p < .001), indicating systematic bias.
Table 2. Mean ± SD values of LVOT measurements in the 30 patients who were examined with 2D, 3D and CT (left) and in the 13 who had intraoperatiove Hegar sizer measurements.
The correlations between LVOT dimensions of 2D and 3D TTE versus CT and Haegar sizers are presented in . For 2D measurements, the best correlation was found between 2D area and Haegar sizer area (r = 0.72). For 3D measurements, the highest correlation was found for minimum diameter of 3D and Haegar sizer diameter (r = 0.64). The highest correlation of all was between CT area and Haegar sizer area (r = 0.86).
Table 3. Correlations of LVOT measurements.
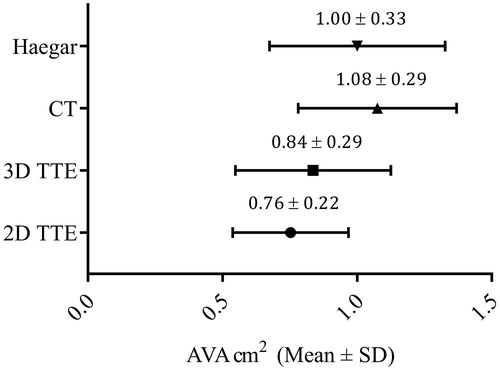
presents the correlation and Bland-Altman plots for LVOT measured by 2D and 3D vs. CT and Haegar sizers. Bland-Altman plots showing bias (± limits of agreement) illustrate the highest bias for 2D vs CT of 1.5 ± 1.3 cm2 and 1.2 ± 0.1.6 cm2 for 3D vs CT. Using Haegar sizers as reference (n = 13) the bias was lower; 0.4 ± 1.5 cm2 for 2D and 0.2 ± 1.8 cm2 for 3D. Calculating the AVA with the continuity equation using the different methods for measuring LVOT combined with the Doppler recordings from 2D TTE, the highest value for AVA was found for CT with 1.08 ± 0.29 cm2 followed by Haegar sizers 1.00 ± 0.33 cm2, 3D 0.84 ± 0.29 cm2 and 2D 0.76 ± 0.22 cm2, as illustrated in .
Figure 2. Correlation and Bland-Altman plots of LVOT area measurements. Correlations and Bland-Altman plots of 2D TTE LVOT area compared to CT (A) and Haegar sizers (C). The same plots for 3D TTE LVOT area compared to CT (B) and Haegar sizers (D). The dashed line of the scatter plots represents the line of equality. The dashed lines of the Bland-Altman plots represent bias and the dotted lines ± 1.96 standard deviations, Limits of Agreement (LoA).
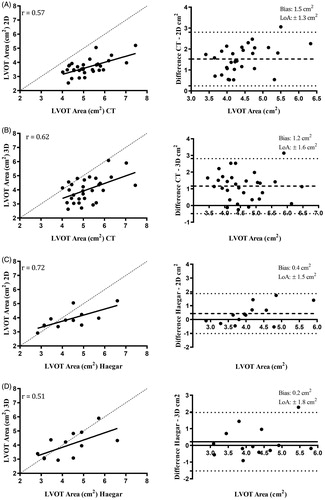
Figure 3. Aortic valve area calculated from LVOT area of the different imaging modalities and Doppler recordings. Mean AVA ± SD calculated by the continuity equation using LVOT area from Haegar sizers, CT and 2D TTE, 3D TTE and Doppler recordings.
Interobserver variability
The best value was found for the 2D LVOT minimum diameter with ICC 0.86 (p < .001). All three LVOT variables measured with 3D TTE had only a moderate reproducibility, with ICC values ranging from 0.50 to 0.62 (Additional File 3).
Discussion
In all patients included, measurements of LVOT were clinically feasible with 2D, as they were in the subset of 41 patients who had CT recordings, but only two thirds of the 3D recordings. 79% of all patients had extensive calcifications. There were no significant difference in calcification between the feasible and non-feasible recordings, but the group of patients with inadequate 3D image quality for measurements had higher Doppler velocities and mean gradients. The largest LVOT areas were derived from CT, followed by Haegar sizers, 3D and 2D. Neither for 2D nor 3D did we find clinically acceptable levels of agreement when using CT as reference. The use of Haegar sizers as reference for the echocardiographic methods in a small subset of patients resulted in lower bias, but the limits of agreement were wide. The inter-observer reproducibility for 2D was acceptable whereas 3D was less precise. When LVOT area obtained with the four methods included in the continuity equation, the AVA was greater with both CT and Haegar sizers than with the two echocardiographic methods.
All echocardiographic and radiological measurements have been carefully conducted by dedicated and experienced investigators. [Citation14,Citation15]. The measurements performed are greatly influenced by echocardiographic gain settings, and there exists no standardization on how to set gain. Smoothing is also prominent in 3D echocardiography, and a high frame-rate will in this setting enhance the problem. In retrospect, our frame-rate settings might have influenced the measurements, and may have been optimized with lower levels. The differences between echocardiographic and CT LVOT areas were quite large. This is in keeping with previous studies [Citation16,Citation17].
Only a few studies have to our knowledge measured LVOT using 3D TTE compared to a reference method. Gaspar et al. [Citation18] examined 25 patients with and 25 patients without aortic stenosis. LVOT area and AVA were estimated using 2D TTE, and subsequently measured with computed tomographic angiography (CCTA) and 3D TTE. They also found, that 2D TTE underestimated AVA compared to CT and as much as 38% of the patients had reduced 3D image quality. The correlation between CCTA and 3D LVOT area was only moderate (r = 0.63) and 3D overestimated LVOT area by 0.51 ± 0.88 cm2. They concluded that the image quality in 3D TTE was inadequate for LVOT measurements.
Tamborini et al reported that the feasibility of LVOT (termed aortic annulus) evaluation was 91% with 3D TTE and 90% with CT in 100 consecutive patients referred for TAVI [Citation19]. The correlation of LVOT area was higher between CT and 3D TTE (r = 0.93, p < .001), than for 2D TTE versus CT (r = 0.78). A possible explanation for the differences in feasibility between their study and ours might be that their population had larger indexed AVA than in our study (0.7 cm2/m2 vs 0.4 cm2/m2) suggesting that the patients in our study had a more progressive disease with a high calcium load which would in turn influence image quality, feasibility and accuracy. They did not report the degree of aortic calcification. In addition, the participants in their study had a lower BSA (1.75 m2 vs 1.90 cm2 among ours), rendering them potentially more echogenic.
A recent study by Cavallaro et al. [Citation20] evaluated patients with a recent diagnosis of aortic stenosis (peak flow velocity > 2.6 m/s and LVEF > 50%). AVA was calculated with the continuity equation using measurements of the LVOT obtained from 2D and 3D TTE. Of 64 patients, 14 (22%) were excluded because of inadequate image quality. Mean AVA was 1.03 ± 0.33 cm2 with 3D versus 0.78 ± 026 cm2 with 2D (p < .001). This difference was greater than in our study, but no reference method was used.
With some reservation for the relatively small number of patients in our study, the observed differences in LVOT dimensions measured with CT versus the two echocardiographic methods may have consequences for the AVA calculated by the continuity equation if hybrid methods were to be implemented. This in turn requires a new set of reference limits for the grading of severe aortic stenosis and of subsequent outcome according to which method is applied.
Limitations of study
These results are exclusively based upon patients with aortic stenosis of such a severity that invasive management was indicated in the vast majority of those included. It is possible that 3D may be preferable to 2D in patients with less severe aortic stenosis. Another and important limitation is the small number of patients that could be compared with the different methods applied. This pitfall may represent an unavoidable problem when conducting a study in which the patient population is examined and treated in different hospitals, as is reflected from the limited number of patients who had CT and, Haegar sizing in the tertiary hospital, mainly due to administrative reasons. Our 3D TTE findings are disappointing when compared with studies performed in larger academic centers, but we think that our results are reflecting an everyday clinical scenario in a primary hospital. We may have used non-optimal frame-rates, resulting in “smoothing”, which can obviously influence on our results.
Conclusion
In the present study of patients with severe aortic stenosis and a high degree of calcification, 2D TTE had excellent feasibility and inter-observer variability in measurements of LVOT dimensions. In these patients the use of 3D TTE measurements showed poor feasibility. Both 3D and especially 2D underestimated LVOT area when using CT and Haegar sizers as reference. AVA estimation is highly dependent on the imaging method used for obtaining the LVOT area when applying the continuity equation. These observations suggest that 2D TTE is preferable to 3D TTE in the assessment of severe aortic stenosis.
Supplemental Material
Download Zip (56.7 KB)Acknowledgements
The authors thank Vestfold Hospital Trust for the opportunity and economic support to conduct this study, Matthew McGee, Centre for Morbid Obesity, University of Oslo for language editing.
David Swanson, Oslo Centre for Biostatistics and Epidemiology (OCBE), University of Oslo, for invaluable help with the statistics.
General Electric, Vingmed Ultrasound, Horten, Norway for access to the EchoPac software
Margareth Ribe, Research Nurse at Centre for Cardiological Intervention (CCI), Oslo University Hospital, Rikshospitalet for invaluable help with study logistics.
Disclosure statement
The authors report no conflict of interest.
Correction Statement
This article has been republished with minor changes. These changes do not impact the academic content of the article.
References
- Baumgartner H, Falk V, Bax JJ, et al.; ESC Scientific Document Group. ESC/EACTS Guidelines for the management of valvular heart disease. Eur Heart J. 2017;38(36):2739–2791.
- Minners J, Allgeier M, Gohlke-Baerwolf C, et al. Inconsistencies of echocardiographic criteria for the grading of aortic valve stenosis. Eur Heart J. 2008;29(8):1043–1048.
- Clavel MA, Messika-Zeitoun D, Pibarot P, et al. The complex nature of discordant severe calcified aortic valve disease grading: new insights from combined Doppler echocardiographic and computed tomographic study. J Am Coll Cardiol. 2013;62(24):2329–2338.
- Pibarot P, Clavel MA. Left ventricular outflow tract geometry and dynamics in aortic stenosis: implications for the echocardiographic assessment of aortic valve area. J Am Soc Echocardiogr. 2015;28(11):1267–1269.
- Chin CW, Khaw HJ, Luo E, et al. Echocardiography underestimates stroke volume and aortic valve area: implications for patients with small-area low-gradient aortic stenosis. Can J Cardiol. 2014;30(9):1064–1072.
- Alskaf E, Kardos A. The mystery of defining aortic valve area: what have we learnt from three-dimensional imaging modalities? J Echocardiogr. 2018;16(3):130–138.
- Schmidkonz C, Marwan M, Klinghammer L, et al. Interobserver variability of CT angiography for evaluation of aortic annulus dimensions prior to transcatheter aortic valve implantation (TAVI). Eur J Radiol. 2014;83(9):1672–1678.
- Kamperidis V, van Rosendael PJ, Katsanos S, et al. Low gradient severe aortic stenosis with preserved ejection fraction: reclassification of severity by fusion of Doppler and computed tomographic data. Eur Heart J. 2015;36(31):2087–2096.
- Jilaihawi H, Doctor N, Kashif M, et al. Aortic annular sizing for transcatheter aortic valve replacement using cross-sectional 3-dimensional transesophageal echocardiography. J Am Coll Cardiol. 2013;61(9):908–916.
- Kempfert J, Van Linden A, Lehmkuhl L, et al. Aortic annulus sizing: echocardiographic versus computed tomography derived measurements in comparison with direct surgical sizing. European Journal of Cardio-Thoracic Surgery: official Journal of the European Association for Cardio-Thoracic Surgery. 2012;42(4):627–633.
- Rosenhek R, Klaar U, Schemper M, et al. Mild and moderate aortic stenosis. Natural history and risk stratification by echocardiography. European Heart Journal. 2004;25(3):199–205.
- Marwick TH, Gillebert TC, Aurigemma G, et al. Recommendations on the use of echocardiography in adult hypertension: a report from the European Association of Cardiovascular Imaging (EACVI) and the American Society of Echocardiography (ASE). J Am Soc Echocardiogr. 2015;28(7):727–754.
- Baumgartner H, Hung J, Bermejo J, et al. Recommendations on the echocardiographic assessment of aortic valve stenosis: a focused update from the European Association of Cardiovascular Imaging and the American Society of Echocardiography. J Am Soc Echocardiogr. 2017;30(4):372–392.
- Aune E, Baekkevar M, Roislien J, et al. Normal reference ranges for left and right atrial volume indexes and ejection fractions obtained with real-time three-dimensional echocardiography. Eur J Echocardiogr. 2009;10(6):738–744.
- Ruddox V, Edvardsen T, Baekkevar M, et al. Measurements of left ventricular volumes and ejection fraction with three-dimensional echocardiography: feasibility and agreement compared to two-dimensional echocardiography. Int J Cardiovasc Imaging. 2014;30(7):1325–1330.
- Clavel MA, Malouf J, Messika-Zeitoun D, et al. Aortic valve area calculation in aortic stenosis by CT and Doppler echocardiography. JACC Cardiovasc Imaging. 2015;8(3):248–257.
- Stahli BE, Abouelnour A, Nguyen TD, et al. Impact of three-dimensional imaging and pressure recovery on echocardiographic evaluation of severe aortic stenosis: a pilot study. Echocardiography. 2014;31(8):1006–1016.
- Gaspar T, Adawi S, Sachner R, et al. Three-dimensional imaging of the left ventricular outflow tract: impact on aortic valve area estimation by the continuity equation. J Am Soc Echocardiogr. 2012;25(7):749–757.
- Tamborini G, Fusini L, Muratori M, et al. Feasibility and accuracy of three-dimensional transthoracic echocardiography vs. multidetector computed tomography in the evaluation of aortic valve annulus in patient candidates to transcatheter aortic valve implantation. Eur Heart J Cardiovasc Imaging. 2014;15(12):1316–1323.
- Cavallaro M, Palmiero G, Sordelli C, et al. Reclassification of low-gradient severe aortic stenosis by three-dimensional echocardiography. Eur Heart J. 2017;38(Suppl_1):ehx502.P1641.