
Abstract
Objectives
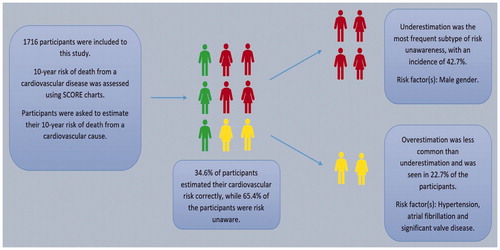
Cardiovascular “risk” is an abstract concept that is frequently misunderstood by the general public. However, correct estimation of one’s own cardiovascular risk is important as risk unawareness is associated with noncompliance with interventions aimed to reduce risk burden. Knowing the prevalence and factors linked with an increased probability of risk unawareness are therefore important to develop strategies aimed to increase risk awareness. Aims. To study prevalence of risk unawareness and to understand risk markers associated with risk underestimation and overestimation. Design. A total of 1716 participants were enrolled to the study in 33 centers across Turkey. Relevant demographic and clinical data were collected by direct interview. Cardiovascular risk of the participants was calculated using SCORE risk charts. Results. Ten-year risk for a fatal cardiovascular event was calculated as low in 633 (36.8%), intermediate in 513 (29.9%) and high-very high in 570 (33.2%) participants, respectively. According to these findings, 34.6% (n = 593) of the participants estimated their risk correctly, whereas 22.7% (n = 390) of the participants overestimated and 42.7% (n = 733) of the participants underestimated their risk. Male gender was the sole factor that was associated with an increased risk of underestimation, while having hypertension, significant valve disease or atrial fibrillation was associated with increased odds for risk overestimation. Conclusions. Only one-thirds of the sample was aware of their calculated risk for cardiovascular mortality and risk underestimation was the most common mode of risk unawareness, prompting concerns on the possible impact of the latter on adherence to the strategies aimed to reduce cardiovascular risk.
Graphical Abstract
Illustration summarizing study flow and main takeaways. Out of 1716 participants included to the present analysis, only one-third of the participants were aware of their risk. Of those who were unaware of their risk, roughly two-thirds underestimated and one-third overestimated their calculated risk. Several demographic and clinical factors were associated with a higher or lower odds for risk unawareness. See text for details.
Graphical Abstract
Introduction
Cardiovascular diseases (CVDs) are the leading cause of death throughout the world despite major advances in the diagnosis and treatment [Citation1]. Atherosclerotic CVD and related complications can be prevented by implementation of strategies against modifiable risk factors such as smoking, obesity, sedentary life, hypertension and hyperlipidemia [Citation2]. To determine individuals and populations at risk, international guidelines recommend using assessment tools that incorporate clinical and laboratory variables. However, “risk” is an abstract concept and is usually not readily understood by an individual. A lack of risk awareness is an important barrier to implement preventive measures and is related with worse cardiovascular outcomes, while an accurate risk perception is beneficial in terms of effective prevention and treatment of CVDs [Citation3–5]. As such, updated epidemiologic information on risk awareness is desirable to better understand this phenomenon, as well as to develop strategies to mitigate negative effects of risk unawareness [Citation6–8].
Cardiovascular Systematic Coronary Risk Evaluation - Turkey (CVSCORE-TR) project aimed to obtain contemporary data on calculated CVD risk and individual risk perception from individuals admitting to cardiology outpatient clinics. Present study aimed to evaluate: (i) Participants’ calculated and perceived risk of death in 10 years from a cardiovascular cause, the frequency of individuals who were aware of their risk and agreement between calculated and perceived risk, (ii) demographic and clinical characteristics of individuals that were risk unaware and (iii) independent markers of risk underestimation and overestimation.
Methods
Patient selection
This study was a multicenter, observational and cross-sectional study that encompassed all geographical locations of Turkey. Subjects were enrolled from 33 study centers between January 2017 and June 2017. Consecutive voluntary participants aged ≥40 years who agreed to participate to the project were included. Patients aged <40 years and those who were automatically classified as having a high or very-high risk per Systematic Coronary Risk Evaluation (SCORE) tool (see definitions) were excluded. Data were collected by an investigator at the outpatient cardiology clinic in each participating center and potential participants were asked to participate to the study by the investigator. Participation to the study was purely voluntary and potential participants were not pressured to participate. Out of 4209 participants who accepted enrolling to the CVSCORE-TR project, 2493 were excluded and the final analysis included 1716 participants. Demographic and clinical data were collected from the participants by direct interview, using a standard 24-point questionnaire. Participants’ perception for their CVD risk was assessed by the following question: “In your opinion, what is your probability for dying from a CVD, such as myocardial infarction or stroke, in the next 10 years: Low, moderate or high?.” Blood pressure was measured at office using an aneroid sphygmomanometer per available international guidelines [Citation9].
Definitions
Definitions used in the present study were given in Supporting Information Table 1. Participants with conditions that automatically upgrade their CVD risk to a high or very-high risk status according to 2016 European Society of Cardiology Cardiovascular Prevention Guidelines were excluded from the present analysis [Citation2]. These conditions included significant coronary or peripheral artery disease, Stage 3 or more advanced chronic kidney disease, diabetes and a marked increase in at least one coronary risk factor [Citation2].
Laboratory and echocardiographic analysis
Blood samples were taken from all participants after overnight fasting. A complete blood count was obtained using a standard analyzer in each study center. Low-density lipoprotein (LDL), high-density lipoprotein (HDL), total cholesterol, triglyceride, fasting blood glucose and serum creatinine were measured according to standard laboratory procedures at all study centers. Estimated glomerular filtration rate was calculated using Cockcroft-Gault formula. A repeat echocardiographic examination was performed at each study center to verify participants’ ejection fraction if a recent (<6 months) examination was not available or if the participant had a recent event that might have caused a reduction in myocardial contractility. Patients with heart failure (HF) signs or symptoms but without evidence for a low ejection fraction were not included to HF category as not all centers had resources to diagnose HF with preserved ejection fraction.
Calculation of 10-year mortality risk
Ten-year mortality risk from a CVD was calculated using a calibrated version of the SCORE risk assessment tool [Citation10]. Individuals with a 10-year mortality risk <1%, 1–5% and ≥5% were categorized as having low, intermediate and high risk, respectively. Patients with a very high risk (10-year mortality risk ≥ 10%) according to the SCORE definition were included within the high-risk group for the purposes of the present study. For patients >70 years, risk assessment was done according to the chart provided for patients aged 70 years. Versions of SCORE charts that were recalibrated for Turkish population were used in the present work [Citation10]. This recalibration was done by European Society of Cardiology SCORE Project Group using 5 and 10 years mortality data obtained from Turkish Statistical Institute in 2014. Participants who did not have any previously diagnosed cardiac disease, hypertension, diabetes or hyperlipidemia necessitating drug use were classified as a separate subgroup to see whether risk perception differs in such individuals.
Ethical statement
The study was performed according to the 1975 Declaration of Helsinki and written informed consent was obtained from all participants prior to participation. The study was approved by the Local Ethics Committee (HNEAH-KAEK 2016/KK/112).
Statistical analysis
Continuous data were presented as mean ± SD, while interval data with less than 20 levels were given as median and interquartile range. Categorical data were given as percentages. For continuous variables, statistical differences between groups were assessed using one-way ANOVA. Post-hoc analyses were done with Tukey’s HSD or Games-Howell depending on the equality of variances. Kruskal-Wallis H and Mann-Whitney U tests were used for interval variables. Categorical variables were compared using χ2 test. Standardized residuals were calculated to assess significant deviations from the expected values. Correlation between calculated and perceived 10-year CV mortality risk was assessed with Spearman’s ρ and Kendall’s τ. Cohen’s κ was used to determine agreement between calculated and perceived risk. A logistic multivariate model with backward parameter selection criteria was constructed to determine clinical parameters related with risk underestimation and overestimation. Only participants that were at risk for a particular risk unawareness were included to the models. Both models were adjusted for calculated risk to avoid confounding. Comparisons with a p value of <.05 were accepted as statistically significant. For categorical variables, standardized residuals less than –1.96 or more than +1.96 were considered as significant deviations from expected values. All statistical analyses were done using SPSS 17.0 statistical software (IBM Inc, Armonk, NY, USA).
Results
Demographic and clinical characteristics
Out of 1716 participants, 43.8% (n = 751) were male, mean age was 56 ± 10 years and mean body mass index (BMI) was 28.6 ± 4.5 kg/m2. Mean systolic and diastolic blood pressures were 133 ± 20 mmHg and 80 ± 12 mmHg, respectively. On overall, 44% of the participants had hypertension, 26% had hyperlipidemia, 7% had HF and 13% had significant valvular heart disease. While most of the participants (91%) were in sinus rhythm, 9% had atrial fibrillation (AF). Twenty-three percent of the participants stated that they were active smokers and a further 14% stated that they smoked in the past. Forty-eight percent of the participants reported that they add salt to their diet and 20% reported they engage in habitual physical activity. Medications used by participants were (in decreasing frequency) angiotensin converting enzyme inhibitors/angiotensin receptor blockers (38.0%), beta-blockers (29%), diuretics (19%), acetylsalicylic acid (17%), proton pump inhibitors (17%), calcium channel blockers (16%) and nonsteroidal anti-inflammatory drugs other than acetylsalicylic acid (12%).
Calculated 10-year cardiovascular risk
Ten-year risk for a fatal cardiovascular event of the participants were found as low in 633 (37%), intermediate in 513 (30%) and high-very high in 570 (33%) participants, respectively. shows the demographic and clinical characteristics of the study participants according to the calculated CVD risk.
Table 1. Demographic characteristics, past medical history, laboratory findings and medications for participants with low, intermediate and high/very high risk for mortality from a cardiovascular cause within the next ten years.
Cardiovascular risk perception and risk awareness
Details on participants’ risk perception and awareness were summarized in . The majority of the patients who overestimated their risk had low calculated risk, while those had high calculated risk tended to underestimate their risk (). Both Spearman’s rho (r = 0.03, p = .26) and Kendall’s tau-b (r = 0.03, p = .26) were not suggestive of a significant correlation between perceived and calculated risks. Finally, agreement test between perceived and calculated CVD risk did not show a significant agreement (Cohen’s kappa 0.02, p = .35).
Figure 1. Risk awareness according to calculated and perceived cardiovascular risk. Clustered bar graphs showing risk awareness and unawareness in the study population. (A) shows the prevalence of risk awareness and unawareness for individual risk categories, while (B) shows cumulative distribution of calculated risk according to the correct estimation of the risk.
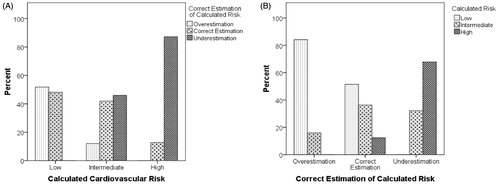
Table 2. Cross tabulations of participants according to calculated and perceived risk (upper table) and calculated risks in participants who were risk aware and risk unaware (lower table).
Characteristics of participants according to correct risk estimation
summarizes demographic, clinical and laboratory characteristics of participants who correctly estimated, overestimated and underestimated their risk. Those within the correct estimation group had an overall low risk profile as compared to those who underestimated their risk; with less hypertension or hypercholesterolemia, lower total or LDL-cholesterol levels and a higher estimated glomerular filtration rate, although nearly half of the participants within this group had either intermediate or high calculated risk ( and ). Similar findings were observed when only high-risk patients were considered (Supporting Information Table 2).
Figure 2. Distribution of clinical and laboratory parameters according to correct estimation versus underestimation in high-risk group. Box plots showing blood pressure measurements and blood chemistry results for high-risk patients who correctly estimated (n = 73) or underestimated (n = 497) their calculated risk. Boxes show interquartile range, while the horizontal line within the boxes show median value and whiskers indicate uppermost and lowermost values. LDL: low-density lipoprotein; HDL: high-density lipoprotein.
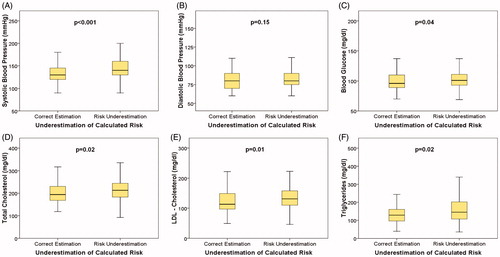
Table 3. Demographic characteristics, past medical history, laboratory findings and medications for participants who overestimated, correctly estimated and underestimated their calculated 10-year mortality risk.
Risk awareness in participants without cardiac disorders, hypertension or hyperlipidemia
Out of 1716 participants, 696 (41%) did not have any established cardiac disorders, hypertension or hyperlipidemia necessitating drug interventions. Mean age of these participants was 52 ± 9 years, mean BMI was 28.1 ± 4.1 kg/m2 and 377 (54%) were female. In this subset, 341 (49%) had low, 193 (28%) had intermediate and 162 (23%) had high risk and the frequencies for correct estimation, overestimation and underestimation were 39% (n = 274), 24% (n = 169) and 36.0% (n = 253), respectively. For both calculated and perceived risks, these patients were more likely to be in the low risk category and were more likely to perceive their risk as low, as compared to the remaining participants (p < .001 for both). Similar to the overall study group, agreement between calculated and perceived risks were low (Cohen’s kappa 0.01, p = .80) and there were no significant correlations between calculated and perceived risks (Spearman’s rho = –0.019, p = .61 and Kendall’s tau-b = –0.018, p = .62). Compared to the remaining participants, this group were more likely to correctly estimate their risk (39% vs. 31%, p = .01) and were less likely to underestimate risk (36% vs. 47%, p < .001), but the frequency of overestimators were similar between groups (24% vs. 22%, p = .2).
Independent predictors of risk underestimation and overestimation
Demographic and clinical markers of risk underestimation and overestimation were given in . Male gender was as a predictor of underestimation, even after adjusting for high risk status. Having significant valve disease and/or AF were both negative risk markers for underestimation and conversely, positive risk markers for overestimation (). Hypertension appeared as a risk marker for overestimation, but it was not associated with underestimation despite being more frequent in risk underestimators.
Table 4. Independent predictors of risk underestimation (left side) and overestimation (right side) in multivariate analyses that included relevant demographic and clinical characteristics of participants.
Discussion
CVSCORE-TR project evaluated the calculated and perceived risk for 10-year risk of death from a CVD in patients admitting to cardiology outpatient clinics. Main findings from the study were: (i) the overall agreement between calculated and perceived risk was poor, with only one-thirds of participants were risk aware, (ii) participants who correctly estimated their risk had a lower overall risk profile, even after exclusion of low-intermediate risk participants and (iii) several demographic and clinical parameters were found to be independently related with risk unawareness, even after adjusting for risk status. See graphical abstract for a summary of key findings.
Risk awareness and unawareness
The prevalence of risk “awareness” is ultimately related with the definition of the CVD risk, tools assessed to determine risk, the risk of the sample studied and the question asked to the participants to define their risk. This makes comparisons between individual studies rather difficult, but some associations can still be drawn. Katz and colleagues reported that the prevalence for risk awareness as 57.6% when Framingham score was used and only 20.6% when Lifetime risk score was used in the same sample [Citation11]. Both risk overestimation and underestimation appeared as a function of the baseline risk; the frequency of overestimators was greater than underestimators when Framingham score was used (7.7% of the participants had high risk) and underestimators outnumbered overestimators when Lifetime score was used (49.3% of the participants had high risk) [Citation11]. Similar to this study, others have reported risk underestimation as the more prevalent form of risk unawareness when studied a population with high actual risk, and vice versa [Citation12,Citation13]. Using a balanced sample with roughly equal numbers of participants from each risk category, we have found that only one-thirds of participants were risk aware, risk underestimation was the more common form of risk unawareness, and the agreement between perceived and calculated risks was very poor. While risk unawareness was less frequent in the subset of participants with no underlying CVD, this group also had a lower overall calculated risk and thus mimicking the overall pattern described above. This high prevalence of underestimation is clearly undesirable given the evidence suggesting association between risk underestimation and low treatment compliance [Citation14–16].
Factors associated with risk unawareness
Gender appears as a major factor affecting risk underestimation, as male participants had a 49% relative risk for risk underestimation (OR:1.49, 95%CI: 1.12–2.01). In a single center study on 465 participants, Homko et al. have identified female gender as a factor associated with increased risk perception after multivariate adjustment [Citation17]. A similar finding was found in a larger multi-center study that included 816 participants, which identified male gender as a marker of low risk perception [Citation13]. Present results confirm the role of gender on risk perception in a large sample and establishes male gender as an independent marker for risk underestimation after adjustment for actual risk status.
In addition to gender, presence of co-morbidities or being on cardiovascular drugs appear to affect risk awareness. This finding is not surprising given that co-morbidities or drugs could alter one’s perception of overall CVD risk. Being treated for a cardiovascular condition was previously reported as a marker of increased risk perception [Citation16]. In the BEFRI study, participants with a positive subjective health assessment were more likely to underestimate their risk, and vice versa; thus, suggesting that a more positive or negative view of overall health status could alter risk perception [Citation12]. Our findings indicate that disorders that played no role in estimating CVD risk but tend to be more symptomatic, such as significant valve disease or AF, were more likely to affect risk awareness as compared to hypercholesterolemia that is a major determinant of CVD risk ().
Possible clinical implications
According to Health Belief Model, individuals should understand their actual risk status and feel vulnerable towards a disease or condition to adopt preventive measures [Citation18–20]. Underestimation is found to be associated with an increased tendency to avoid recommendations that reduce risk and might be related with untoward cardiovascular outcomes [Citation20]. Possible clinical importance of risk overestimation is less well studied, but it was suggested that overestimation is related with anxiety and emotional distress that could be detrimental to adequately implement measures to prevent CVD [Citation11,Citation21]. Thus, risk unawareness itself could be considered as a risk marker for CVD. Indeed, present findings suggest that risk unaware individuals are more prone to have higher cholesterol and less likely to use drugs, thus offering some mechanistic insights for why risk unawareness may act as a risk marker. That said, it remains unclear whether risk unawareness per se is associated with hard cardiovascular outcomes, or whether strategies aimed to reduce unawareness could influence these outcomes.
Appropriateness of using SCORE function in cardiology outpatients
SCORE tool has been developed and validated in otherwise healthy adults and its use in cardiology outpatients is inappropriate as it would tend to underestimate the actual risk. Nonetheless, it is otherwise impossible to understand risk perception in this group given that extrapolating results from otherwise healthy individuals would be equally inappropriate as this would lead to underappreciation of the actual burden of risk unawareness in cardiology outpatients. SCORE tool does not include coexisting cardiac conditions or treated cardiovascular risk factors when calculating risk, unlike some other risk functions that also incorporate cardiac comorbidities to calculate overall risk [Citation22,Citation23]. Despite this shortcoming, decisions on risk interventions in cardiology outpatient clinics are usually based on SCORE tool even in those with underlying comorbidities, and therefore, it is reasonable to evaluate risk perception relative to the risk assessment tool that is most commonly employed. That said, these limitations of the SCORE tool should be recognized when interpreting present findings.
Study limitations
Though present study was multi-institutional and with a large sample size; it was performed in one country, so the data might not be representative for other populations or ethnic groups. For patients who were already drug treatment for hypertension or hypercholesterolemia, risk calculation was based on study findings (rather than pre-treatment findings) and therefore initial risks might be different from what is calculated given that none of the risk models were calibrated to compensate for active drug treatment. We have used a recalibrated version of SCORE for Turkish population, which is endorsed by the Turkish Society of Cardiology [Citation10]. Unfortunately, the details of the validation or calibration processes were not published before. Recalibrated SCORE chart did not include individuals aged >70, and it is recommended that all individuals aged >65 should be treated as if they have high or very high absolute risk in the original SCORE charts [Citation2]. However, it is hardly practical to accept all individuals over a certain age as having high risk, so we have used charts given for maximum age to risk stratify these patients. As most of these participants were already classified as having a high risk using this method (84.1%), we believe that the effect of this condition on the results should be rather limited.
Conclusions
Risk awareness and agreement between calculated and perceived risk is very low in subjects admitted to outpatient clinics, with only ⅓ being aware of their calculated risk and patients who underestimated their risk were more likely to have more pronounced CV risk factors. Risk unaware individuals show several common demographic and clinical characteristics that could be useful to identify them in clinical practice. Targeting such individuals to raise their risk awareness is a reasonable strategy, but more data are needed whether such interventions are feasible or could improve cardiovascular outcomes.
Supplemental Material
Download MS Word (35.5 KB)Supplemental Material
Download Zip (39.4 KB)Acknowledgement
The authors thank Emine Tosun, RN; Nuray M. Akgul, RN; Menduha Esir, RN and Ozgul Mete, RN for their invaluable contributions. This article is dedicated to the memory of Prof. Dr. Turan Erdogan, whom we lost during the 2020 COVID-19 pandemic.
Disclosure statement
The authors report no conflict of interest.
References
- World Health Statistics. 2015 [cited 2016 Jun 18]. Available from: http://www.who.int/gho/publications/world_health_statistics/2015/en/
- Piepoli MF, Hoes AW, Agewall S, et al. 2016 European Guidelines on cardiovascular disease prevention in clinical practice: the Sixth Joint Task Force of the European Society of Cardiology and Other Societies on Cardiovascular Disease Prevention in Clinical Practice (constituted by representatives of 10 societies and by invited experts)Developed with the special contribution of the European Association for Cardiovascular Prevention & Rehabilitation (EACPR). Eur Heart J. 2016;37(29):2315–2381.
- Steptoe A, Doherty S, Rink E, et al. Behavioural counselling in general practice for the promotion of healthy behaviour among adults at increased risk of coronary heart disease: randomised trial. BMJ. 1999;319(7215):943–947.
- Samsa GP, Cohen SJ, Goldstein LB, et al. Knowledge of risk among patients at increased risk for stroke. Stroke. 1997;28(5):916–921.
- Martell-Claros N, Aranda P, Gonzalez-Albarran O, et al. Perception of health and understanding of cardiovascular risk among patients with recently diagnosed diabetes and/or metabolic syndrome. Eur J Prev Cardiolog. 2013;20(1):21–28.
- Kozan O, Zoghi M, Ergene O, et al. Prevention and control program for cardiovascular diseases in Turkish population: PRE-CONTROL study group. Glob Heart. 2013;8(2):115–119.
- Turkey Cardiovascular Diseases Prevention and Control Program 2015-2020. [cited 2018 Sept 22]. Available from: https://www.tkd.org.tr/TKDData/Uploads/files/Turkiye-kalp-ve-damar-hastaliklari-onleme-ve-kontrol-programi.pdf
- Kotseva K, Wood D, De Bacquer D, et al. EUROASPIRE IV: a European Society of Cardiology survey on the lifestyle, risk factor and therapeutic management of coronary patients from 24 European countries. Eur J Prev Cardiolog. 2016;23(6):636–648.
- Perloff D, Grim C, Flack J, et al. Human blood pressure determination by sphygmomanometry. Circulation. 1993;88(5 Pt 1):2460–2470.
- Turkish Society of Cardiology National Guidelines "Score Turkey Risk Chart". [cited 2018 Sept 23]. Available from: http://file.tkd.org.tr/kilavuzlar/SCORETurkiye-160125.PDF?menu=52
- Katz M, Laurinavicius AG, Franco FG, et al. Calculated and perceived cardiovascular risk in asymptomatic subjects submitted to a routine medical evaluation: the perception gap. Eur J Prev Cardiol. 2015;22(8):1076–1082.
- Oertelt-Prigione S, Seeland U, Kendel F, et al. Cardiovascular risk factor distribution and subjective risk estimation in urban women–the BEFRI study: a randomized cross-sectional study. BMC Med. 2015;13(1):52.
- Alwan H, William J, Viswanathan B, et al. Perception of cardiovascular risk and comparison with actual cardiovascular risk. Eur J Cardiovasc Prev Rehabil. 2009;16(5):556–561.
- Kreuter MW, Strecher VJ. Changing inaccurate perceptions of health risk: results from a randomized trial. Health Psychol. 1995;14(1):56–63.
- Mochari-Greenberger H, Mills T, Simpson SL, et al. Knowledge, preventive action, and barriers to cardiovascular disease prevention by race and ethnicity in women: an American Heart Association national survey. J Womens Health (Larchmt). 2010;19(7):1243–1249.
- Navar AM, Wang TY, Mi X, et al. Influence of cardiovascular risk communication tools and presentation formats on patient perceptions and preferences. JAMA Cardiol. 2018;3(12):1192–1199.
- Homko CJ, Zamora L, Santamore WP, et al. Gender differences in cardiovascular risk factors and risk perception among individuals with diabetes. Diabetes Educ. 2010;36(3):483–488.
- Ghembaza MA, Senoussaoui Y, Tani MK, et al. Impact of patient knowledge of hypertension complications on adherence to antihypertensive therapy. Curr Hypertens Rev. 2014;10(1):41–48.
- Rosenstock IM, Strecher VJ, Becker MH. Social learning theory and the Health Belief Model. Health Educ Q. 1988;15(2):175–183.
- van der Weijden T, Bos LB, Koelewijn-van Loon MS. Primary care patients' recognition of their own risk for cardiovascular disease: implications for risk communication in practice. Curr Opin Cardiol. 2008;23(5):471–476.
- Webster R, Heeley E. Perceptions of risk: understanding cardiovascular disease. Risk Manag Healthc Policy. 2010; 3:49–60.
- Hippisley-Cox J, Coupland C, Vinogradova Y, et al. Predicting cardiovascular risk in England and Wales: prospective derivation and validation of QRISK2. BMJ. 2008;336(7659):1475–1482.
- D’Agostino RB, Sr, Vasan RS, Pencina MJ, et al. General cardiovascular risk profile for use in primary care: the Framingham Heart Study. Circulation. 2008;117(6):743–753.