
Abstract
Background Resting heart rate (HR) and its variability (HRV) reflects the cardiac sympathovagal balance that is stimulated by head-up tilting. HRV is influenced by the level of HR, but how much HRV offers additional information about cardiac autonomic tone than HR alone remains unresolved. We examined the relation of resting HR with HRV during head-up tilt. Methods. Hemodynamics of 569 subjects without known cardiovascular diseases and medications with direct cardiovascular effects were recorded using whole-body impedance cardiography, radial pulse wave analysis, and electrocardiography-based HRV analysis during passive head-up tilt. Results. Higher low frequency to the high-frequency ratio (LF/HF) of HRV (reflecting sympathovagal balance) was associated with higher HR in supine (p < .05, both linear regression analysis and variance analysis comparing HR tertiles) and upright postures (p < .001, linear regression analysis). The association of HR with HRV during tilt-testing remained significant when the HR dependence of HRV was mathematically weakened by dividing the HRV power spectra with the fourth power of the average RR-interval. Conclusion. Higher resting HR is related to higher LF/HF both supine and upright, reflecting elevated sympathetic influence on cardiac autonomic modulation. Lower resting HR is associated with lower resting LF/HF, while the differences in LF/HF between the HR tertiles were minor during head-up tilt, suggesting a greater change in cardiac sympathovagal balance in response to upright posture in those with lowest resting HR. Altogether, resting HR well predicts HRV levels during head-up tilt.
Trial registration: Clinicaltrialsregister.eu 2006-002065-39, first registered 5 May 2006. ClinicalTrials.gov NCT01742702, first registered 5 December 2012.
Introduction
Heart rate variability (HRV) is associated with heart rate (HR), and this association is determined by cardiac autonomic nervous tone. Hence, higher sympathetic activity is related to higher HR and lower HRV [Citation1–3]. Sympathetic tone can be easily stimulated by the change of body position from supine to upright [Citation2–4].
HRV has been widely studied and lower HRV is a risk factor for adverse cardiovascular outcomes [Citation5] and a predictor of mortality of cardiac but also of other causes [Citation6,Citation7]. Reduced HRV is observed in psychic conditions, such as mental stress and depression [Citation8,Citation9]. Higher resting HR has been related to cardiovascular events and a less favourable prognosis in healthy men and women [Citation10,Citation11]. A recent meta-analysis concluded that resting HR is a predictor of cardiovascular and all-cause mortality in the general population independent of the classic cardiovascular risk factors [Citation12]. The mechanisms of these relations are not well understood but an imbalance between vagal and sympathetic influences is a conceivable factor. Both HR and HRV are influenced by cardiac sympathovagal tone, and the association of reduced HRV with poor prognosis may be attributed to the concomitant level of HR [Citation13–15].
The relation of HRV to HR is not only physiological but also mathematical, and the relation is not linear [Citation3,Citation16]. HRV is usually calculated from consecutive RR-intervals reciprocal to HR measures. Therefore, when lower and higher initial HR levels are compared, a similar change in HR results in a greater change in RR-interval during lower HR. HRV is usually evaluated by the use of time or frequency domains, both of which provide information about vagal and sympathetic modulation [Citation3]. From the frequency domain parameters, the high frequency (HF) component represents vagal activation and the low frequency (LF) component predominantly represents the sympathetic component of HRV [Citation2]. From the time domain parameters, the square root of mean squared differences of normal to normal RR-intervals (RMSSD) mostly represents vagal influence while the standard deviation of normal to normal RR-intervals (SDNN) is an estimate of total HRV [Citation3]. There are mathematical methods that can be applied to strengthen or weaken the dependence of HRV on HR [Citation17].
Because HRV includes information on HR and its variation, it has not been ascertained which one of these factors (i.e. HR or HRV) is relating individuals to poor prognosis [Citation13,Citation18]. Furthermore, both HR and HRV are related to sex, and typically HR is lower but sympathovagal balance (LF/HF ratio) is higher among men [Citation14,Citation19,Citation20]. In addition, the relation of higher resting HR with a less favourable prognosis seems more pronounced among men than women in population studies [Citation10,Citation11,Citation19]. Hence, it is still unresolved whether HRV provides additional information than the sole measurement of HR.
In this study, we examined whether resting HR level predicts sympathovagal balance evaluated using HRV in the time domain and frequency domain parameters during supine and upright positions in a population without cardiovascular diseases or medications with direct cardiovascular influences.
Methods
Subjects
This research is a part of the DYNAMIC study which is an ongoing study focusing on non-invasive recording of hemodynamics from adult subjects with and without cardiovascular diseases (Clinicaltrialsregister.eu 2006-002065-39; Clinicaltrials.gov NCT01742702). The study was approved by the ethics committee of the Tampere University Hospital (reference number R06086M) and all study subjects gave informed consent before participation as stipulated in the declaration of Helsinki. Volunteers for the research were recruited by announcements delivered in public organizations including Tampere University Hospital, Tampere University, Varala Sports Institute, and occupational health care organizations. All study subjects were interviewed and examined by a physician who documented medical history and lifestyle habits. Smoking habits were determined as never smokers, previous smokers, and current smokers, and smoking in pack years were registered. Alcohol consumption was documented as weekly amounts of standard drinks (i.e. ∼12 g alcohol). Physical activity was determined as the number of exercise sessions (lasting at least 30 min) per week with at least a moderate level of workload (for example brisk walking or jogging).
From the present study subjects with a history of cardiovascular disease, diabetes mellitus, kidney disease, prevailing cardiac arrhythmia, alcohol or substance abuse, concurrent malignancy, or medications with direct effects on the cardiovascular system were excluded. Also, subjects with incomplete hemodynamic recordings (i.e. missing HR or HRV values) were excluded. Altogether 569 subjects (mean age 44.9, 95% confidence intervals of the mean (CI) (43.9, 45.9) years; 287 men) were included. The following stable medical conditions with adequate medications were included: asthma (medicated with inhaled corticosteroids, n = 12), allergy (n = 7), depression (n = 29), dyslipidemia (n = 13), dyspepsia (n = 10), epilepsy (n = 3), hypothyroidism (n = 16), and autoimmune disease (n = 3).
Laboratory tests
Blood sampling was conducted after overnight fasting. Concentrations of plasma glucose, creatinine, cystatin C, C-reactive protein, triglyceride, and total, high-density (HDL) and low-density lipoprotein (LDL) cholesterol were determined by Cobas Integra 700/800 (F. Hoffmann-LaRoche Ltd, Basel, Switzerland), or Cobas 6000, module c501 (Roche Diagnostics, Basel, Switzerland). Hematocrit was determined by ADVIA 120 or 2120 analyzers (Bayer Health Care, Tarrytown, NY, USA). The estimated glomerular filtration rate was calculated using the CKD-EPI creatinine-cystatin C equation [Citation21].
Hemodynamic measurements
A trained research nurse carried out hemodynamic measurements in a quiet and temperature-controlled laboratory. The study subjects were guided to avoid caffeine products, smoking, or heavy meals 4 h before the investigation. Before proper measurements, the subjects were resting supine for about 10 min, during which period a tonometric sensor was placed on the left radial pulsation, a brachial blood pressure cuff on the right upper arm for blood pressure calibration, and electrodes of whole-body impedance cardiography were placed on the body surface. Then HR (1/min) and radial blood pressure (mmHg) were captured in a beat-to-beat fashion in supine and upright positions. At first, the subjects rested 5 min supine on the tilt table, followed by 5 min of passive head-up tilt to 60°.
For the whole-body impedance cardiography measurement, the CircMonR-device (JR Medical Ltd., Tallinn, Estonia) and for continuous blood pressure measurements, the SphygmoCor pulse wave monitoring system (SpygmoCor PWMx, AtCor medical, Australia) was used. The measurement protocol is described in detail in our previous publications [Citation22,Citation23] and it has been shown to be repeatable and reproducible [Citation24,Citation25]. In addition, pulse wave velocity (PWV) values measured using impedance cardiography show a good correlation with the tonometric method (r = 0.82, bias 0.02 m/s, 95% CI 0.21–0.25) [Citation26].
Heart rate variability analysis
Beat-to-beat RR-intervals were captured from electrocardiogram recordings by the impedance cardiography device at a 200 Hz sampling rate. Then HRV results were analyzed from RR intervals using Matlab software (Natick, MA, USA). First, normal RR-intervals were recognized and an interval was considered ectopic or an artifact if it differed by more than 20% from the previous ones. The artifact RR-intervals were processed by the cubic spline interpolation method [Citation27].
The following HRV parameters were calculated from the measurements of 3 min in the supine and 3 min in the upright position: (1) time domain HRV parameters: SDNN and RMSSD, and (2) frequency domain parameters by the fast Fourier transformation method [Citation3,Citation28]: power in LF range (0.04–0.15 Hz), power in HF range (0.15–0.40 Hz), LF to HR ratio (LF/HF) and total power. Three last minutes of each phase (supine and upright) were selected with the assumption of a stationary HRV signal.
As stated above, the magnitude of HRV depends on the prevailing level of HR. To weaken the dependence of HRV on HR, the HRV power spectra were divided by average supine or upright RR-interval (avRRI) to the fourth power because of the good reproducibility of this index when compared with other indices [Citation17]. The supine and upright HRV values total power, HF power, LF power, and LF/HF (TP/avRRI4, HF/avRRI4, LF/avRRI4, LFHF/avRRI4, respectively) were included in the analyses.
Statistical analyses
IBM SPSS Statistics software (version 26, Armonk, NY, USA) was used and p-values <.05 were considered significant. Continuous data were reported as means and 95% confidence intervals (95% CI) if normally distributed, and as medians and interquartile range if asymmetrically distributed. For statistical analyses and the study, subjects were divided into tertiles according to the mean resting HR, determined from the mean of the last 3 min during the 5 min of supine measurement. Because HR and HRV significantly depend on sex [Citation4,Citation29], the tertiles were determined separately for men and women but for statistical power men and women were analyzed together.
Differences in study population demographics, hemodynamic measurements, and laboratory values between the HR tertile groups were examined using analysis of variances (ANOVA). Tukey’s HSD correction was performed for homogenous and Tamhane’s T2 correction for nonhomogeneous variables in post-hoc testing. Natural logarithms of HRV parameters, C-reactive protein, and fasting triglyceride concentrations were used in the statistical analyses to normalize their skewed distributions. The proportions of smoking habits (never, previous or current smoker) were compared using the χ2 test.
The associations of HR on HRV were confirmed by linear regression analysis using stepwise elimination (with natural logarithms of nonlinear HRV parameters). The other explanatory factors for the linear regression analysis were selected from variables with statistically significant differences between the HR tertile groups (ANOVA). The linear regression model for supine and upright HR was calculated using LF/HF ratio and then the analyses were repeated using LFHF/avRRI4 (to weaken the HR dependence) [Citation17].
Results
Study population
The study subjects were divided into tertiles of resting HR according to sexes. Altogether 187 subjects were allocated to the lowest HR tertile (HR tertile 1), 190 subjects to the intermediate HR tertile (HR tertile 2), and 192 subjects to the highest HR tertile (HR tertile 3). The respective HR ranges were 45–58/min, 59–67/min, and 67–103/min for women; and 41–58/min, 59–67/min, and 67–99/min for men. From the traditional cardiovascular risk factors, body mass index and fasting plasma glucose were highest, and HDL cholesterol was lowest in the HR tertile 3 (p < .05 for all, ). In addition, fasting plasma triglycerides and C-reactive protein were highest in the HR tertile 3. The lifestyle habits, amount of smoking, weekly alcohol consumption, and physical activity, did not differ between the tertiles (p > .05 for all). The study population demographics according to the tertiles are presented in .
Table 1. Study population demographics, laboratory and supine hemodynamic values in the heart rate tertiles calculated according to sexes.
Heart rate, blood pressure, and arterial stiffness
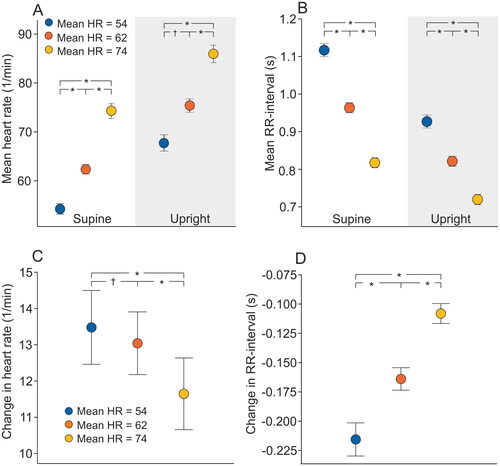
Mean resting HR in the whole study population was 64/min (95% CI 63, 64) and there was a statistically significant difference in resting HR between sexes: resting HR among men was 63/min (95% CI 61, 64) and among women 65/min (95% CI 64, 66; p < .001). Mean HR values according to the HR tertiles are depicted in and . Both systolic and diastolic radial blood pressures were lower in the HR tertile 1 when compared with HR tertile 3 (p < .001 for both, ). Also, arterial stiffness measured by PWV was lower in the HR tertile 1 in comparison with other HR tertiles (p < .001 for all comparisons).
Figure 1. Mean (95% confidence intervals) supine and upright heart rate (A), RR-interval (B), and the change in heart rate (C), and RR-interval (D) during passive head-up tilt according to the mean supine heart rate (HR) tertiles; *p < .001, †p < .05 statistically significant differences in the analysis of variance with Tukey’s HSD correction in post-hoc testing.
Heart rate and its variability between heart rate tertiles
Mean RR-interval was reciprocally shortened with increasing HR during supine and upright measurements (p < .001 for all group comparisons, ). The increase in HR during tilt-testing was lowest in HR tertile 3 [11.6 (95% CI 11.4, 11.9)/min] when compared with tertile 1 [13.4 (95% CI 13.2, 13.7)/min] and tertile 2 [13.0 (95% CI 12.8, 13.2)/min].
The actual median RR-interval and HRV values according to the HR tertiles are presented in and the outcomes of the statistical analyses using logarithmic values are in and . SDNN and RMSSD were lower with increasing HR in the tertiles both supine and upright (p = .069 for supine tertile 1 vs. tertile 2, p ≤ .001 for all other group comparisons, ).
Figure 2. Mean (95% confidence intervals) supine and upright standard deviation of normal-to-normal RR-intervals (SDNN) (A), and the square root of mean squared differences of normal-to-normal RR-intervals (RMSSD) (B) according to the mean supine heart rate (HR) tertiles. Values are presented as natural logarithms (Ln) of the variables to normalize their distributions; *p < .001, †p < .05 statistically significant differences in the analysis of variance with Tukey’s HSD post-hoc test.
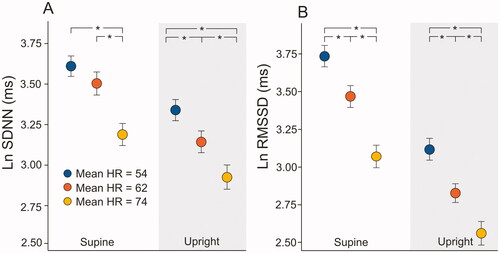
Figure 3. Mean (95% confidence intervals) supine and upright total power (A), low-frequency power (B), high-frequency power (C), and low to high-frequency power ratio (D) according to the mean supine heart rate (HR) tertiles. Values are presented as natural logarithms (Ln) of the variables to normalize their distributions; *p < .001, statistically significant differences in the analysis of variance with Tukey’s HSD post-hoc test.
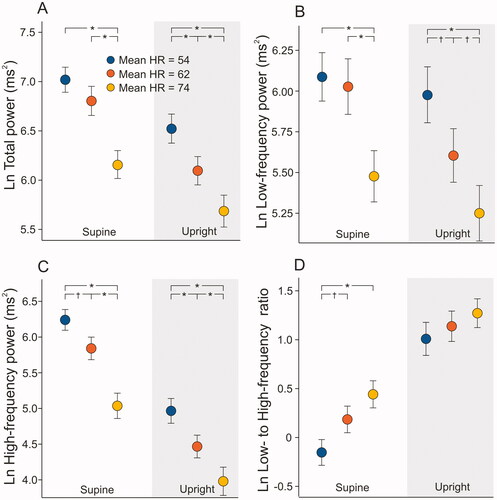
Table 2. Actual heart rate variability values according to resting heart rate tertiles during 3 min measurement at supine and upright position.
From the frequency domain parameters, the total power of variation decreased with increasing HR (p < .001, supine tertile 1 and tertile 2 vs. tertile 3 comparison; p < .001 in all upright group comparisons), and the differences remained similar during posture change from supine to upright (p < .001, for all group comparisons, ). Both parasympathetic and sympathetic modulation related variables (i.e. power in HF and LF range) were higher among the HR tertile 1 than in HR tertile 2 and 3, except supine LF power between HR tertile 1 and 2 (p < .05 for all other group comparisons, ). The differences between the HR tertiles were similar both supine and upright. The LF/HF ratio was lower in the HR tertile 1 when compared with HR tertiles 2 and 3 during supine position (p < .002 for both group comparisons, ), while the differences between the HR tertiles were not statistically significant during upright position (p = .073).
The change in LF power from supine to an upright position was significantly different only between tertiles 2 and 3 (p = .025), but the decrease in HF power was most marked in the HR tertile 1 and lowest in the HR tertile 3 (544 ms2 in tertile 1, 482 ms2 in tertile 2, 164 ms2 in tertile 3, p < .001 for comparisons to tertile 3). The posture-related change from supine to upright in LF/HF was not statistically different between the HR groups (p = .672 for the mean differences). The supine to upright change in total power was significantly different between the highest and lowest HR tertiles (p ≤ .005).
Heart rate variability with the approach to weaken the heart rate dependence
From HRV parameters analyzed with the approach to weaken the HR dependence (HRV divided by average RR-interval to the fourth power) total power, HF power, and LF/HF were associated with the resting HR tertiles. These supine HRV parameters (TP/avRRI4, HF/avRRI4, and LFHF/avRRI4) were lowest within the HR tertile 1 and highest within the HR tertile 3 (p ≤ .002 for all ANOVA tests and post-hoc tests, respectively, ). Only LFHF/avRRI4 difference between HR tertiles was statistically significant during upright measurement (p > .001 for all, ANOVA). The change in LFHF/avRRI4 during the head-up tilt test was highest in HR tertile 1 vs. tertile 2 and tertile 3 (p < .001, ANOVA).
Figure 4. Mean (95% confidence intervals) supine and upright total power (A), low-frequency power (B), high-frequency power (C), and low to high-frequency power ratio (D) according to the mean supine heart rate (HR) tertiles. The dependence of heart rate on heart rate variability was weakened by dividing heart rate variability parameters by average RR-intervals to the fourth power [Citation17]. Values are presented as natural logarithms (Ln) of the variables to normalize their distributions; *p < .001, †p < .05 statistically significant differences in the analysis of variance with Tukey’s HSD post-hoc test.
![Figure 4. Mean (95% confidence intervals) supine and upright total power (A), low-frequency power (B), high-frequency power (C), and low to high-frequency power ratio (D) according to the mean supine heart rate (HR) tertiles. The dependence of heart rate on heart rate variability was weakened by dividing heart rate variability parameters by average RR-intervals to the fourth power [Citation17]. Values are presented as natural logarithms (Ln) of the variables to normalize their distributions; *p < .001, †p < .05 statistically significant differences in the analysis of variance with Tukey’s HSD post-hoc test.](/cms/asset/6a4f41f3-8480-4888-87ff-646663b80184/icdv_a_2079713_f0004_c.jpg)
Heart rate and heart rate variation in linear regression analyses
The relation between resting and upright HR and HRV was also studied in a stepwise linear regression model where the HRV variables (LF/HF and LFHF/avRRI4) and the statistically significant confounding factors mentioned above were selected as independent variables (age, PWV, mean blood pressure, sex, BMI, C-reactive protein, triglycerides, HDL cholesterol, fasting plasma glucose, and cystatin C). The coefficients of the linear regression analyses are presented in Supplemental Tables 1–4.
Resting HR was directly related to LF/HF (p < .001 for LF/HF, coefficient Beta for LF/HF 0.293, R2 = 0.229 for the model, Supplemental Table 1). Also, upright HR was directly related to LF/HF (p < .001 for LF/HF, coefficient Beta for LF/HF 0.281, R2 = 0.214 for the model, Supplemental Table 2).
Both supine and upright HR were directly related to the LF/HF ratio also in analyses where the dependence on HR was weakened with the LFHF/avRRI4 approach (p < .001, coefficient Beta for LFHF/avRRI4 0.656, R2 = 0.546 for the model in the supine position, Supplemental Table 3; p < .001, coefficient Beta for LFHF/avRRI4 0.622 and R2 = 0.488 for the model in the upright position, Supplemental Table 4).
Discussion
In the present study, we showed that lower resting HR predicts a greater increase in sympathovagal balance (i.e. LF/HF) during the change from supine to upright posture. In addition, both supine LF and HF power were negatively associated with resting HR levels indicating more active autonomic nervous control of HR in subjects with lower resting HR. Even when the dependency of HRV on average HR was weakened using a mathematical method, a statistically significant relation between HRV and HR was detected. These findings suggest that lower resting HR is related to a more active autonomic cardiac modulation with a significant decrease in parasympathetic tone during head-up tilt and that the change in HRV during passive head-up tilt can be predicted by resting HR level in subjects without cardiovascular diseases or medications.
Previous studies have described that both HR and HRV are indicators of sympathovagal tone [Citation1,Citation30], and both of them are also predictors of cardiovascular diseases, such as coronary disease [Citation6,Citation7,Citation10], heart failure [Citation11,Citation31–33], and even mortality [Citation7,Citation12,Citation19,Citation34]. In addition, while the mathematical association of HR with HRV is obvious, their physical relation during stimulation of autonomic nervous tone is not fully understood [Citation13,Citation14,Citation35]. In the present study, the relation of HRV with HR was studied in 569 subjects without medications with direct cardiovascular effects of diagnosed cardiovascular diseases during supine and upright positions.
There are controversial studies of the relation of HR with HRV [Citation1,Citation13,Citation14,Citation16,Citation18]. The mathematical relation of these two variables is clear, but whether HRV does more represent the level of sympathetic modulation than HR alone is not finally settled. However, our results suggest that low resting HR is associated with decreased LF/HF, e.g. lower sympathetic vs. vagal modulation, independent of the method of calculation. Sacha et al. [Citation17] have presented a method for the strengthening and weakening of the HRV dependence of the average HR. The present HRV values with the mathematical HR dependency weakening approach were still clearly related to the resting HR in supine and upright positions (for all tested frequency domain parameters; see , Supplemental Tables 3 and 4). Consequently, HRV was strongly related to resting HR level regardless of the HRV calculation method, even after the adjustment for avRRI4. As far as we know, there are no previously published results that applied this method to weaken the HRV association of HR. Of note, the TP/avRRI4 and HF/avRRI4 values were directly related to the HR level, whereas the respective total power, HF, and LF values without the avRRI4 adjustment were inversely related to HR. This can be explained by the negative mathematical relation between the HR and the RR-interval.
Importantly, regardless of the mathematical HRV method lower resting HR was related to a lower supine LF/HF ratio, and a more pronounced change in this variable during head-up tilt, indicating a greater change in the sympathovagal balance in response to upright posture.
High resting HR and decreased HRV are associated with poor cardiovascular health and mortality [Citation5–7,Citation10–12,Citation19]. The present study population consisted of rather healthy subjects without cardiovascular diseases and the population was divided into tertiles according to the resting HR within each sex. This approach reduced possible differences in the distribution of such cardiovascular risk factors that are influenced by sex. However, subjects with the highest HR and higher LF/HF also presented with other markers of less favorable prognosis, i.e. decreased HRV (total power) and HDL cholesterol levels, increased triglyceride, fasting plasma glucose, C-reactive protein levels, and higher body mass index (). In addition, higher resting HR was related to higher blood pressure and pulse wave velocity () representing increased arterial stiffness in these study subjects. This indicates an accumulation of cardiovascular risk factors in subjects with higher resting HR, although high resting HR has been implicated as an independent cardiovascular risk factor [Citation12].
Within the present study, population resting HR was inversely related to both the sympathetic component (LF power) and vagal component (HF power and RMSSD) of HRV, and the relation with sympathovagal balance (LF/HF) was positive regardless of body position (in linear regression analyses). These findings support the view that lower resting HR is an indicator of increased vagal tone [Citation36,Citation37] and decreased sympathetic tone.
Previous examinations have shown a physiological decrease in HF power and an increase in LF/HF ratio during head-up tilt testing, while the changes in cardiac autonomic tone were found to be more pronounced in men vs. women [Citation38]. In the present study, posture change from supine to upright vagal modulation (HF power) decreased significantly independent of the resting HR level. This finding is consistent with two small previous studies where HRV was recorded from 22 and 12 healthy subjects, respectively, during head-up tilt [Citation2,Citation28]. Moreover, SDNN and total power, representing total autonomic tone, were negatively related to resting HR during supine and upright recordings, the findings of which are congruent with previous studies [Citation13]. In our study, there was no statistically significant change in sympathetic modulation (LF power) during posture change from supine to the upright in the HR groups. This finding is congruent with the views of a previous review by Goldstein et al. [Citation39], where the LF power was concluded to be an index of baroreflex function but not of cardiac sympathetic tone. Hence, the change in the autonomic tone in response to head-up tilt seems to be mediated more by an alteration in vagal than the sympathetic cardiac influences regardless of the resting HR level.
Previously Tsuji et al. [Citation34] studied the relation of HRV with cardiovascular events in 2501 patients with a mean age of 53 years. They found that reduced LF, HF, and total power were significantly related to increased risk for cardiovascular events when the other risk factors were taken into consideration (p < .05) [Citation34]. In the present study, the lower supine LF/HF ratio and the greater change in this variable in response to upright posture may hence reflect better cardiovascular health in the subjects with lower HR.
Study limitations
It is known that age has an effect on autonomic tone [Citation4,Citation40–42]. Lipsitz et al. [Citation40] compared HRV changes during head-up tilt in healthy young (18–35) and older subjects (71–94 years). They reported the loss of autonomic influences on HR regulation as a function of age. The same result was observed in a larger study by Barantke et al. [Citation42], where HRV remained unchanged during postural tilt in older subjects (58–88 years) without cardiac diseases. In the present study, the mean age was the same within the resting HR tertiles () and only 22 subjects (8%) were over 60 years of age (range 18–72). Hereby the possibility remains that the effect of age on HRV was not eliminated even though age was included as one of the confounding factors in the regression analyses. Also, sex has a marked effect on autonomous tone and reduced HRV has been observed in male subjects. The sex-specific HR tertiles were constructed to avoid the confounding influence of sex on the results.
Many medications, especially beta blockers, have direct effects on HR and other hemodynamic variables and also on HRV [Citation43,Citation44]. In the present study subjects with cardiovascular medications were excluded. However, not only cardiovascular medications but also for example antidepressants have effects on HRV [Citation45], while mental illnesses have also been associated with reduced HRV [Citation8,Citation9]. The present study included subjects who were medicated with antidepressants, but all were in a stable non-symptomatic phase. In addition to posture, breathing frequency is associated with HRV via autonomous activity and strong respiratory sinus arrhythmia may incorrectly identify true RR intervals as artifacts (>20% different from the previous beat). In the present study, the respiratory frequency during hemodynamic measurements was not systematically registered and was not taken into account in the analyses.
All of the present participants were without signs of cardiovascular autonomic dysfunction, which has been previously related, e.g. to autoimmune and neurological diseases and acute myocardial infarction [Citation32]. It seems likely that mean HR and HRV are well correlated in healthy subjects, while depressed HRV and low LF/HF ratio have been observed in patients in the acute phase of myocardial infarction [Citation32]. Altogether, autonomic dysfunction has been associated with increased time-varying cardiovascular complexity [Citation47]. Autonomic control of peripheral vascular tone was not examined in our study that focused on cardiac autonomic modulation using HRV [Citation46]. Simultaneous recordings of photoplethysmograms [Citation48,Citation49] and blood pressure from fingers have indicated that the low-frequency component of photoplethysmogram variability may reflect the autonomic control of blood pressure [Citation49]. Laser doppler flowmetry would offer an alternative method for blood flow measurements in tissues [Citation50]. Recently, models for the study of complex dynamics in autonomic control during the tilt-test have also been published [Citation51].
Conclusions
In the present study, the relation between resting HR and its short-term variability during supine and upright position was studied in 569 subjects without cardiovascular diseases or cardiovascular medications. Resting HR was significantly associated with HRV and this relation was not eliminated by a mathematical correction method. Higher resting HR was related to higher LF/HF in both supine and upright positions, but lower resting HR also anticipated a more pronounced increase in sympathovagal balance during head-up tilt.
Based on previous literature, the link between HR and HRV may dissociate under pathophysiological conditions [Citation32], but in the present study population that was in rather good health, resting HR well predicted the HRV levels during both supine and upright postures.
Author contributions
JK and IP designed the study, analysed and interpreted the data, and drafted the first version of the manuscript. MU and JV contributed to data interpretation. JK, AT, AJT, PK, and IP contributed to data collection and experiments. AT, AJT, PK, JV, MK, and JM contributed to the critical revision of the manuscript. All authors read and approved the final manuscript.
Supplemental Material
Download MS Word (28.4 KB)Acknowledgements
The authors thank research nurses Paula Erkkilä, Reeta Kulmala, Pirjo Järventausta, and Mirja Ikonen for invaluable technical assistance.
Disclosure statement
No potential conflict of interest was reported by the author(s).
Data availability statement
The data been used during the present study is not publicly available as our clinical database contains several indirect identifiers and the informed consent obtained does not allow publication of individual patient data. However, the datasets are available from the corresponding author on reasonable request.
Additional information
Funding
References
- Grassi G, Vailati S, Bertinieri G, et al. Heart rate as marker of sympathetic activity. J Hypertens. 1998;16:138–1639.
- Montano N, Ruscone TG, Porta A, et al. Power spectrum analysis of heart rate variability to assess the changes in sympathovagal balance during graded orthostatic tilt. Circulation. 1994;90(4):1826–1831.
- Heart rate variability: standards of measurement, physiological interpretation and clinical use. Task force of the European Society of Cardiology and the North American Society of Pacing and Electrophysiology. Circulation. 1996;93:1043–1065.
- Stolarz K, Staessen JA, Kuznetsova T, et al. Host and environmental determinants of heart rate and heart rate variability in four European populations. J Hypertens. 2003;21:525–535.
- Thayer JF, Yamamoto SS, Brosschot JF. The relationship of autonomic imbalance, heart rate variability and cardiovascular disease risk factors. Int J Cardiol. 2010;141(2):122–131.
- Buccelletti E, Gilardi E, Scaini E, et al. Heart rate variability and myocardial infarction: systematic literature review and metanalysis. Eur Rev Med Pharmacol Sci. 2009;13(4):299–307.
- Dekker JM, Crow RS, Folsom AR, et al. Low heart rate variability in a 2-minute rhythm strip predicts risk of coronary heart disease and mortality from several causes: the ARIC study. Atherosclerosis risk in communities. Circulation. 2000;102(11):1239–1244.
- Kemp AH, Quintana DS. The relationship between mental and physical health: insights from the study of heart rate variability. Int J Psychophysiol. 2013;89(3):288–296.
- Sgoifo A, Carnevali L, Alfonso Mde L, et al. Autonomic dysfunction and heart rate variability in depression. Stress. 2015;18(3):343–352.
- Cooney MT, Vartiainen E, Laatikainen T, et al. Elevated resting heart rate is an independent risk factor for cardiovascular disease in healthy men and women. Am Heart J. 2010;159(4):612–619 e3.
- Nanchen D, Leening MJ, Locatelli I, et al. Resting heart rate and the risk of heart failure in healthy adults: the Rotterdam study. Circ Heart Fail. 2013;6(3):403–410.
- Zhang D, Shen X, Qi X. Resting heart rate and all-cause and cardiovascular mortality in the general population: a meta-analysis. CMAJ. 2016;188(3):E53–E63.
- Monfredi O, Lyashkov AE, Johnsen AB, et al. Biophysical characterization of the underappreciated and important relationship between heart rate variability and heart rate. Hypertension. 2014;64(6):1334–1343.
- Stauss HM. Heart rate variability: just a surrogate for mean heart rate? Hypertension. 2014;64(6):1184–1186.
- Sacha J, Barabach S, Statkiewicz-Barabach G, et al. How to select patients who will not benefit from ICD therapy by using heart rate and its variability? Int J Cardiol. 2013;168(2):1655–1658.
- Sacha J, Pluta W. Different methods of heart rate variability analysis reveal different correlations of heart rate variability spectrum with average heart rate. J Electrocardiol. 2005;38(1):47–53.
- Sacha J, Sobon J, Sacha K, et al. Heart rate impact on the reproducibility of heart rate variability analysis. Int J Cardiol. 2013;168(4):4257–4259.
- Sacha J. Interaction between heart rate and heart rate variability. Ann Noninvasive Electrocardiol. 2014;19(3):207–216.
- Kannel WB, Kannel C, Paffenbarger RS Jr., et al. Heart rate and cardiovascular mortality: the Framingham study. Am Heart J. 1987;113(6):1489–1494.
- Huikuri HV, Pikkujämsä SM, Airaksinen KJ, et al. Sex-related differences in autonomic modulation of heart rate in middle-aged subjects. Circulation. 1996;94(2):122–125.
- Inker LA, Schmid CH, Tighiouart H, et al. Estimating glomerular filtration rate from serum creatinine and cystatin C. N Engl J Med. 2012;367(1):20–29.
- Koskela JK, Tahvanainen A, Haring A, et al. Association of resting heart rate with cardiovascular function: a cross-sectional study in 522 Finnish subjects. BMC Cardiovasc Disord. 2013;13(1):102.
- Tikkakoski AJ, Tahvanainen AM, Leskinen MH, et al. Hemodynamic alterations in hypertensive patients at rest and during passive head-up tilt. J Hypertens. 2013;31(5):906–915.
- Tahvanainen A, Koskela J, Tikkakoski A, et al. Analysis of cardiovascular responses to passive head-up tilt using continuous pulse wave analysis and impedance cardiography. Scand J Clin Lab Invest. 2009;69(1):128–137.
- Tahvanainen AM, Tikkakoski AJ, Leskinen MH, et al. Supine and upright haemodynamic effects of sublingual nitroglycerin and inhaled salbutamol: a double-blind, placebo-controlled, randomized study. J Hypertens. 2012;30(2):297–306.
- Wilenius M, Tikkakoski AJ, Tahvanainen AM, et al. Central wave reflection is associated with peripheral arterial resistance in addition to arterial stiffness in subjects without antihypertensive medication. BMC Cardiovasc Disord. 2016;16:131.
- Peltola MA. Role of editing of R-R intervals in the analysis of heart rate variability. Front Physiol. 2012;3:148.
- Bergland G. A guided tour of the fast Fourier transform. IEEE Spectr. 1969;6(7):41–52.
- Koenig J, Thayer JF. Sex differences in healthy human heart rate variability: a meta-analysis. Neurosci Biobehav Rev. 2016;64:288–310.
- Malik M, Camm AJ. Components of heart rate variability–what they really mean and what we really measure. Am J Cardiol. 1993;72(11):821–822.
- Nolan J, Batin PD, Andrews R, et al. Prospective study of heart rate variability and mortality in chronic heart failure: results of the United Kingdom heart failure evaluation and assessment of risk trial (UK-heart). Circulation. 1998;98(15):1510–1516.
- Chattipakorn N, Incharoen T, Kanlop N, et al. Heart rate variability in myocardial infarction and heart failure. Int J Cardiol. 2007;120(3):289–296.
- Adamson PB, Smith AL, Abraham WT, et al. Continuous autonomic assessment in patients with symptomatic heart failure: prognostic value of heart rate variability measured by an implanted cardiac resynchronization device. Circulation. 2004;110(16):2389–2394.
- Tsuji H, Larson MG, Venditti FJ, Jr, et al. Impact of reduced heart rate variability on risk for cardiac events. The Framingham heart study. Circulation. 1996;94(11):2850–2855.
- Sacha J, Pluta W. Alterations of an average heart rate change heart rate variability due to mathematical reasons. Int J Cardiol. 2008;128(3):444–447.
- Parati G, Saul JP, Di Rienzo M, et al. Spectral analysis of blood pressure and heart rate variability in evaluating cardiovascular regulation. A critical appraisal. Hypertension. 1995;25(6):1276–1286.
- Malliani A, Pagani M. Spectral analysis of cardiovascular variabilities in the assessment of sympathetic cardiac regulation in heart failure. Pharmacol Res. 1991;24(Suppl 1):43–53.
- Kangas P, Tahvanainen A, Tikkakoski A, et al. Increased cardiac workload in the upright posture in men: noninvasive hemodynamics in men versus women. J Am Heart Assoc. 2016;5:e002883.
- Goldstein DS, Bentho O, Park M-Y, et al. Low-frequency power of heart rate variability is not a measure of cardiac sympathetic tone but may be a measure of modulation of cardiac autonomic outflows by baroreflexes: low-frequency power of heart rate variability. Exp Physiol. 2011;96(12):1255–1261.
- Lipsitz LA, Mietus J, Moody GB, et al. Spectral characteristics of heart rate variability before and during postural tilt. Relations to aging and risk of syncope. Circulation. 1990;81(6):1803–1810.
- Tsuji H, Venditti FJ Jr., Manders ES, et al. Determinants of heart rate variability. J Am Coll Cardiol. 1996;28(6):1539–1546.
- Barantke M, Krauss T, Ortak J, et al. Effects of gender and aging on differential autonomic responses to orthostatic maneuvers. J Cardiovasc Electrophysiol. 2008;19(12):1296–1303.
- Jandackova VK, Scholes S, Britton A, et al. Are changes in heart rate variability in middle-aged and older people normative or caused by pathological conditions? Findings from a large population-based longitudinal cohort study. J Am Heart Assoc. 2016;5:e002365.
- Sandrone G, Mortara A, Torzillo D, et al. Effects of beta blockers (atenolol or metoprolol) on heart rate variability after acute myocardial infarction. Am J Cardiol. 1994;74(4):340–345.
- Huang WL, Liao SC, Kuo TB, et al. The effects of antidepressants and quetiapine on heart rate variability. Pharmacopsychiatry. 2016;49(5):191–198.
- Bernardi L, Spallone V, Stevens M, et al. Methods of investigation for cardiac autonomic dysfunction in human research studies: investigation methods for cardiac autonomic function. Diabetes Metab Res Rev. 2011;27(7):654–664.
- Valenza G, Citi L, Garcia RG, et al. Complexity variability assessment of nonlinear time-varying cardiovascular control. Sci Rep. 2017;7:42779.
- Elgendi M, Fletcher R, Liang Y, et al. The use of photoplethysmography for assessing hypertension. NPJ Digit Med. 2019;2:60.
- Karavaev AS, Borovik AS, Borovkova EI, et al. Low-frequency component of photoplethysmogram reflects the autonomic control of blood pressure. Biophys J. 2021;120(13):2657–2664.
- Abdulhameed YA, McClintock PVE, Stefanovska A. Race‐specific differences in the phase coherence between blood flow and oxygenation: a simultaneous NIRS, white light spectroscopy and LDF study. J Biophotonics. 2020;13:e201960131.
- Ishbulatov YM, Karavaev AS, Kiselev AR, et al. Mathematical modeling of the cardiovascular autonomic control in healthy subjects during a passive head-up tilt test. Sci Rep. 2020;10(1):16525.