
Abstract
Background: Coronary artery disease (CAD) is a top life-threatening disease and early and sensitive detection of CAD remains a challenge. This study aimed to assess the value of three-dimensional speckle tracking imaging (3D-STI) in diagnosing CAD patients and investigate the parameters of 3D-STI associated with disease severity. Methods: A total of 260 suspected CAD patients who met the study criteria underwent coronary angiography within one week after the ultrasound examination. Based on the examination results, 142 patients were confirmed to have CAD (CAD group), while 118 patients were classified as non-CAD (NCAD group). Age, gender, family history, smoking status, diabetes, hypertension, dyslipidemia, electrocardiogram, BMI, heart rate, and left ventricular ejection fraction were compared between the two groups. Additionally, 3D-STI parameters including left ventricular global radial strain (GRS), left ventricular global longitudinal strain (GLS), left ventricular global area strain (GAS), and left ventricular global circumferential strain (GCS) were analyzed. Results: No significant differences were found between the CAD and NCAD groups in terms of demographics, smoking history, physiological measurements, and common comorbidities such as diabetes mellitus and dyslipidemia. However, when comparing the 3D-STI parameters, all four parameters, including GLS, GRS, GCS, and GAS, were significantly different in the CAD group compared to the NCAD group. The results suggest that 3D-STI parameters have diagnostic value for CAD, and their changes are associated with CAD severity. Conclusions: Combined detection of these parameters enhances diagnostic accuracy compared to individual detection.
Introduction
Coronary artery disease (CAD) is a life-threatening prevalent heart condition caused by atherosclerosis-induced narrowing or blockage of coronary arteries, leading to myocardial ischemia, hypoxia, or necrosis [Citation1]. It is a significant cause of morbidity and mortality, affecting both men and women and accounting for over one-third of all deaths [Citation1]. Various clinical methods are currently employed for diagnosing and assessing CAD, including coronary angiography [Citation2], cardiovascular magnetic resonance imaging [Citation3], and echocardiography [Citation4]. Coronary angiography is considered the “gold standard” for evaluating CAD but is an invasive procedure associated with risks and complications [Citation5]. Cardiovascular magnetic resonance has a high sensitivity for assessing biventricular morphology and function, but its utilization is limited due to its high cost and time-consuming nature [Citation6].
Echocardiography, on the other hand, is widely utilized due to its simplicity, non-invasiveness, affordability, and ability to provide care at the bedside [Citation7]. Echocardiography not only visualizes structural and functional changes in CAD patients but also evaluates left ventricular systolic function [Citation8]. However, conventional two-dimensional echocardiography relies on wall motion observation to assess ventricular function and can be influenced by operator experience and technique. In this context, three-dimensional echocardiography plays a crucial role in CAD diagnosis as it allows for comprehensive assessment of left ventricular endocardial surface morphology, precise measurement of left ventricular volume, and evaluation of its function [Citation9].
Nevertheless, there exists a subgroup of patients with severe CAD who do not exhibit segmental wall motion abnormalities or reduced ejection fraction (EF) during routine echocardiography examinations [Citation10]. This discrepancy highlights the need for an advanced technique that can provide more accurate diagnostic information. Three-dimensional speckle tracking imaging (3D-STI) is a cutting-edge approach that utilizes 3D echocardiography and speckle technology to track myocardial tissue speckles [Citation11]. By employing 3D-STI, it becomes possible to assess left ventricular systolic function through the measurement of parameters such as radial, longitudinal, and area strain of the left ventricle [Citation12].
The primary objective of this study is to investigate the diagnostic value of 3D-STI in the context of coronary artery disease. By assessing the utility of 3D-STI in detecting CAD, we aim to contribute to the improvement of diagnostic accuracy, particularly in cases where conventional echocardiography methods may not effectively identify severe CAD. This exploration of 3D-STI's application value has the potential to enhance our understanding of CAD pathophysiology and facilitate the development of more effective diagnostic strategies.
Method
Study subjects
The study included clinically suspected coronary artery disease (CAD) patients admitted to our department over three years. All patients underwent coronary angiography within one week of the ultrasound examination. Patients who were radiologically confirmed to have CAD were categorized as the coronary artery disease group (CAD), while patients confirmed to be free of coronary artery disease were classified as the non-CAD group (NCAD). The study was approved by Daqing Oilfield General Hospital and informed written consent was obtained from the participants. This study was performed in strict accordance with the Declaration of Helsinki, Ethical Principles for Medical Research Involving Human Subjects.
Inclusion criteria
Patients included in the study met the following criteria: typical angina symptoms occurring during exertion or emotional stress, aged 18 years or older, complete medical records, informed consent from patients and their families, absence of significant segmental wall motion abnormalities in routine echocardiography, and a left ventricular ejection fraction (LVEF) larger than 50%.
Exclusion criteria
Patients meeting any of the following criteria were excluded from the study: acute coronary syndrome (ACS), previous history of coronary artery disease, premature ventricular contraction or atrial fibrillation, any valvular disease, poor acoustic window, left bundle-branch block, patients on cytotoxic drug therapy, and refusal to provide informed consent. Additionally, patients with congestive heart failure and left ventricular systolic dysfunction (ejection fraction [EF] < 50%) were also excluded.
Diagnosis criteria for coronary artery disease
The diagnosis of coronary artery disease was confirmed based on coronary angiography, which identified the presence of ≥ 50% stenosis in any major coronary artery. The severity of coronary artery disease was assessed using the Gensini scoring system [Citation13]. The scoring system assigned scores to different degrees of stenosis: 0 for no stenosis, 1 for ≤ 25% stenosis, 2 for 26% to 50% stenosis, 4 for 51% to 75% stenosis, 8 for 76% to 90% stenosis, 16 for 91% to 99% stenosis, and 32 for 100% stenosis. Lesions in specific locations were assigned coefficients to calculate a single lesion score. The sum of these scores represented the Gensini total score for each patient. Patients with coronary artery disease were further classified into three groups based on the Gensini score: mild lesion group (< 25 points), moderate lesion group (25-49 points), and severe lesion group (≥ 50 points).
Preprocessing of patient data
For 260 suspected coronary heart disease patients meeting our study criteria, all patients underwent coronary angiography within 1 week after ultrasound examination. According to the examination results, 142 patients confirmed with coronary heart disease by coronary angiography were classified into the CAD group, while 118 patients confirmed without coronary heart disease were classified into the NCAD group. A comparison was made between the two groups in terms of age, gender, family history, smoking status, diabetes, hypertension, dyslipidemia, electrocardiogram, BMI, heart rate, left ventricular ejection fraction, as well as 3D-STI.
Ultrasound diagnosis
Ultrasound examinations were performed using the GE Vivid E9 ultrasound diagnostic instrument (GE Healthcare, Chicago, IL, USA) equipped with a 2D probe (M5SC, GE Healthcare) with a frequency range of 1.7 to 3.3 MHz and a 3D probe (4 V) with a frequency range of 1.5 to 4.0 MHz. The frame rate was set between 25 and 40 frames per second, and an EchoPAC workstation (GE Healthcare) was utilized.
Routine echocardiography examination followed the guidelines outlined in the American Society of Echocardiography (ASE) guidelines for transthoracic echocardiography in adults. Measurements of left atrium, left ventricle size, posterior wall thickness, and interventricular septal thickness were performed using the M5SC 2D probe. Left ventricular ejection fraction (LVEF) was measured using Simpson’s biplane method when clear images of the four-chamber and two-chamber views at the cardiac apex were obtained.
3D-STI examination was conducted using the 4 V 3D probe. Adjustments were made to optimize sector angle, depth, and gain to obtain clear images of the endocardium. Once clear four-chamber images were obtained, the 4D mode was activated, and the patient was instructed to hold their breath at end-expiration. Six consecutive cardiac cycles of left ventricular three-dimensional ultrasound images were acquired with a frame rate exceeding the heart rate (beats per minute) multiplied by 40%.
Analysis of 3D-STI
The acquired 3D echocardiographic images of the left ventricle were analyzed offline at the EchoPAC workstation. The 4D Auto LVQ software was used for image analysis. The midpoint of the mitral annulus and the apex of the endocardium were manually selected on the apical three-chamber, two-chamber, and four-chamber views. The software can automatically delineate the boundaries of the endocardium and epicardium. The software automatically generates a bull’s-eye plot of left ventricular myocardial strain across 17 segments and a strain-time curve. Following the standardized left ventricular segment division recommended by the American College of Cardiology, the left ventricle was divided into 17 segments. The measurements included peak systolic global longitudinal strain (GLS), global radial strain (GRS), global circumferential strain (GCS), and global area strain (GAS) of the left ventricle.
Statistical analysis
Data were shown with mean ± SD. Unpaired t-tests with Welch’s correction or Brown-Forsythe ANOVA test followed by Dunnett’s T3 multiple comparisons test were used.
Results
Comparison of demographic and clinical characteristics between CAD and non-CAD groups
Among the 260 suspected coronary artery disease patients who met our study criteria, all patients underwent coronary angiography within one week after the ultrasound examination. Based on the examination results, 142 patients were confirmed to have coronary artery disease and were classified as the coronary artery disease group (CAD group), while 118 patients were confirmed to be free of coronary artery disease and were classified as the non-CAD group (NCAD). A comparison was made between the two groups in terms of age, gender, family history, smoking status, diabetes, hypertension, dyslipidemia, electrocardiogram, BMI, heart rate, and left ventricular ejection fraction. The two groups did not significantly differ in any of these factors (p < 0.05 for all parameters, ).
Table 1. Demographic and clinical characteristics of suspected coronary artery disease (CAD) patients who were diagnosed with CAD or without CAD (NCAD) through coronary angiography.
Analysis of 3D-STI parameters in CAD and non-CAD groups
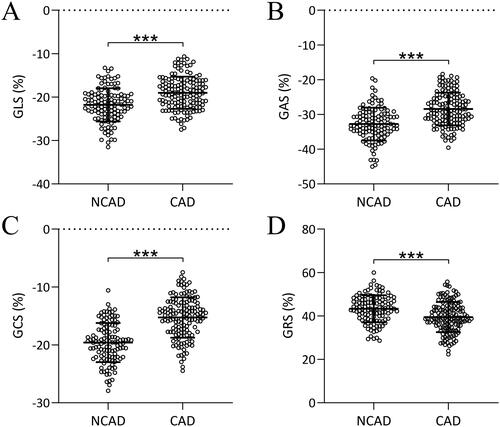
A comparison was conducted between the two groups regarding the parameters of 3D-STI, including GLS (), GRS (), GCS (), and GAS (). It was observed that GLS, GAS, and GCS values were significantly higher in the CAD group and GRS values were pronounced lower in the CAD group compared to the NCAD group (p < 0.001 for all comparisons). Representative GCS from suspected CAD patients who diagnosed with CAD or without CAD was shown in the Figure S1.
Figure 1. Comparisons of parameters of three-dimensional speckle tracking imaging including global longitudinal strain (GLS, a), global area strain (GAS, B), global circumferential strain (GCS, C), and global radial strain (GRS, D) in suspected coronary artery disease (CAD) patients who diagnosed with CAD (n = 142) or without CAD (NCAD, n = 118) through coronary angiography. Data were shown with mean ± SD. ***p < 0.001 from unpaired t-test with Welch’s correction.
Enhanced diagnostic accuracy using individual or combined 3D-STI parameters
To characterize the diagnostic values of 3D-STI, receiver operating curve (ROC) analyses were conducted for the 3D-STI parameters (). It can be seen that all the 3D-STI parameters demonstrated high area-under-curve (AUC) for CAD diagnosis and the combined value showed the highest AUC.
Figure 2. ROC analysis for the diagnostic value of three-dimensional speckle tracking imaging in coronary artery disease.
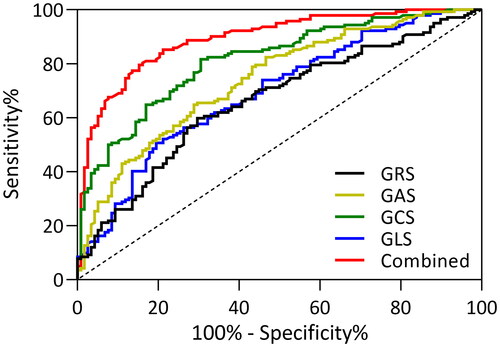
presents the specific values of ROC analysis, showing the cutoff values, sensitivity, specificity, and area under the curve for all four parameters and the combined value. The cutoff values were determined by the Youden index. The sensitivity and specificity of these parameters range from 50% to 85%, and the combined value demonstrated the highest AUC, along with a prominent sensitivity of 79.58% and specificity of 84.75%.
Table 2. Diagnostic values in ROC analysis.
Relationship between Gensini scores and 3D-STI parameters in CAD patients
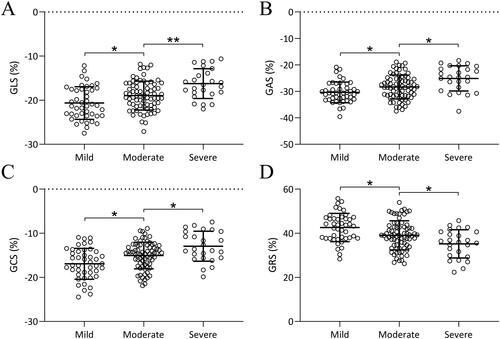
We further compared the GLS (), GAS (), GCS (), and GRS () values among patients re-grouped according to CAD severity (Mild, Moderate or Severe categorized based on Gensini scores). With increasing disease severity, the absolute values of GLS, GAS, and GCS increased and the value of GRS decreased. This indicates that 3D-STI not only has diagnostic value for CAD but also the changes in these parameters are associated with the severity of CAD (p < 0.05).
Figure 3. Comparisons of parameters of three-dimensional speckle tracking imaging including global longitudinal strain (GLS, a), global area strain (GAS, B), global circumferential strain (GCS, C), and global radial strain (GRS, D) among patients with different severity of coronary artery disease. Data were shown with mean ± SD. *p < 0.05, **p < 0.01 from Brown-Forsythe ANOVA test followed by Dunnett’s T3 multiple comparisons test.
Discussion
3D-STI has emerged as a promising tool in diagnosing various diseases and has particularly been shown to provide valuable insights into cardiac function assessment [Citation14], myocardial mechanics [Citation15], and tissue characterization. For example, 3D-STI enables accurate and comprehensive evaluation of cardiac function by assessing parameters such as strain, strain rate, and displacement in three-dimensional space [Citation14]. This allows for the detection of subtle abnormalities and early identification of cardiac dysfunction. Recent studies also indicated that 3D-STI provides detailed information on myocardial mechanics, including regional deformation patterns and myocardial synchrony, aiding in the diagnosis and management of conditions like myocardial infarction and heart failure. Furthermore, studies suggest that 3D-STI offers valuable tissue characterization by assessing the myocardial fibrosis and scar burden [Citation16], which is crucial in determining prognosis and guiding therapeutic interventions. STE serves as a sophisticated imaging technique capable of identifying early myocardial deformation changes.
3D-STE used in the present study has been recognized as a reliable approach for evaluating both the left atrium and left ventricle, offering advantages over traditional 2D-STE. 3D-STE is particularly effective in detecting subclinical myocardial involvement in various conditions, including both atherosclerotic and non-atherosclerotic coronary artery diseases. Previous studies on 3D-STE in patients with stable angina pectoris revealed that GLS and other strain metrics were significantly impaired in individuals with CAD compared to those with non-critical CAD [Citation17–19]. Additionally, a positive linear relationship has been found between the Gensini score and all strain parameters assessed [Citation20]. The myocardial fibers with maximum chances of ischemia are the longitudinally orientated fibers that are located subendocardial, where intermittent ischemia leads to myocardial stunning and can be detected by strain measurement using 3D-STI. Despite these advancements of 3D-STI as a new non-invasive tool in cardiac disease diagnosis, improving patient care, and enhancing our understanding of cardiac pathophysiology, clinical application of 3D-STI parameters as imaging biomarkers entails comprehensive characterization of 3D-STI parameters in the clinical setting.
The present study set out to investigate the diagnostic value of 3D-STI parameters for CAD detection and their association with the severity of the disease. Our study is a well-defined patient cohort of suspected CAD patients who underwent coronary angiography within a week after ultrasound examination was utilized, ensuring accurate confirmation of disease presence or absence. A comprehensive assessment of various traditional risk factors, such as comorbidities of CAD, was conducted, which in comparison to 3D-STI parameters allows for a robust analysis of the associations of 3D-STI parameters to CAD.
Consistent with other studies investigating STI in CAD [Citation21,Citation22], our study corroborated the utility of 3D-STI based on a larger cohort (260 patients in total) and offered an approach of combining parameters of 3D-STI for highly sensitive and specific detection of CAD. Our results demonstrated that the combination of GLS, GRS, GCS, and GAS significantly improved the diagnostic accuracy for CAD when compared to individual parameters. Additionally, the absolute values of these parameters showed a progressive reduction with increasing disease severity. The combined values of GLS, GRS, GCS, and GAS exhibited a high AUC compared to individual parameters alone. This indicates that the integration of multiple parameters improved the overall diagnostic accuracy for CAD. Such an approach of combining the 3D-STI parameters has been shown to increase diagnostic efficacy in other cardiac diseases [Citation23]. The AUC values obtained from the ROC analysis, including cutoff values, sensitivity, specificity, and maximum Youden index, further supported the superior performance of the combined detection approach. These findings suggest that utilizing a combination of 3D-STI parameters may be a valuable approach for diagnosing CAD. This data also potentiates further optimization for the combinatory pattern, e.g. using machine learning [Citation24,Citation25] to achieve an even higher diagnostic accuracy.
Furthermore, the study investigated the relationship between the severity of CAD, as determined by Gensini scores, and the 3D-STI parameters. The results revealed a significant positive correlation between disease severity and the absolute values of GLS, GAS, and GCS, and a reverse correlation to GRS. Similarly, previous studies have also shown that 3D-STI provides parameter values correlated to severities of other diseases [Citation17,Citation26]. Our data indicate that not only do the 3D-STI parameters have diagnostic value for CAD, but they also reflect the progressive impairment of myocardial function associated with the severity of the disease. These findings suggest that 3D-STI parameters could potentially serve as indicators for assessing the severity of CAD, and our study is the first study showing a correlation between 3D-STI parameters to CAD severity.
Despite these strengths, there are some limitations to consider. Firstly, the study design was cross-sectional, limiting the ability to establish a cause-and-effect relationship between 3D-STI parameters and CAD. Future longitudinal studies could provide more insight into the predictive value of these parameters. Secondly, the study was conducted on a relatively small sample size, which may impact the generalizability of the findings. A larger cohort could provide more statistical power and validate the observed associations. Additionally, the study did not investigate the interobserver and intraobserver variabilities of the 3D-STI measurements, which could influence the reliability and reproducibility of the results. STI, while powerful, is susceptible to a variety of technical limitations that can affect the accuracy and consistency of the measurements. Key factors influencing the quality of strain imaging include the necessity for high-quality imaging, and sufficient frame rates of no less than 40 frames per second. Additionally, the performance of strain measurements can be impacted by loading conditions, the specific ultrasound system used, and external mechanical factors such as the patient’s chest wall conformation [Citation27–29]. They also face limitations compared to other imaging modalities. These include a lower spatial resolution and susceptibility to artifacts compared to MRI, and less robust quantification of myocardial perfusion than nuclear imaging techniques. Additionally, their effectiveness is highly dependent on operator skill and experience, which can lead to variability in outcomes across different clinical settings.
Conclusions
In conclusion, the present study demonstrated the diagnostic value of 3D-STI parameters, specifically GLS, GRS, GCS, and GAS, for CAD. Combining these parameters significantly improved the diagnostic accuracy compared to individual detections. Moreover, the absolute values of these parameters are exhibited. Future work should focus on longitudinal studies that track the progression of CAD in patients over time using 3D-STI parameters. Investigating the predictive value of these parameters for adverse cardiovascular outcomes could enhance risk stratification and management strategies. Additionally, further research could aim to standardize 3D-STI techniques and refine the analysis algorithms to improve the sensitivity and specificity of CAD detection across diverse populations. Collaborations across different clinical centers would also help in validating the efficacy of 3D-STI in a broader clinical context and facilitate the integration of these techniques into routine clinical practice.
Ethical approval
The study was approved by Daqing Oilfield General Hospital, the study was performed in strict accordance with the Declaration of Helsinki, Ethical Principles for Medical Research Involving Human Subjects.
Informed consent
Written consent was obtained from the participant’s parents or guardians.
Consent for publication
The current study is available from the corresponding author upon reasonable request.
Supplemental Material
Download MS Word (542.9 KB)Disclosure statement
No potential conflict of interest was reported by the author(s).
Data availability statement
The raw data supporting the conclusions of this article will be made available by the authors, without undue reservation.
Additional information
Funding
References
- Duggan JP, Peters AS, Trachiotis GD, et al. Epidemiology of coronary artery disease. Surg Clin North Am. 2022;102(3):499–516. doi: 10.1016/j.suc.2022.01.007.
- Modi BN, Sankaran S, Kim HJ, et al. Predicting the physiological effect of revascularization in serially diseased coronary arteries: clinical validation of a novel CT coronary angiography–based technique. Circ Cardiovasc Interv. 2019;12:e007577.
- Reynolds HR, Maehara A, Kwong RY, et al. Coronary optical coherence tomography and cardiac magnetic resonance imaging to determine underlying causes of myocardial infarction with nonobstructive coronary arteries in women. Circulation. 2021;143(7):624–640. doi: 10.1161/CIRCULATIONAHA.120.052008.
- Pastore MC, Mandoli GE, Contorni F, et al. Speckle tracking echocardiography: early predictor of diagnosis and prognosis in coronary artery disease. Biomed Res Int. 2021;2021:6685378–6685311. doi: 10.1155/2021/6685378.
- Nazir MS, Bustin A, Hajhosseiny R, et al. High-resolution non-contrast free-breathing coronary cardiovascular magnetic resonance angiography for detection of coronary artery disease: validation against invasive coronary angiography. J Cardiovasc Magn Reson. 2022;24(1):26. doi: 10.1186/s12968-022-00858-0.
- Kwong RY, Ge Y, Steel K, et al. Cardiac magnetic resonance stress perfusion imaging for evaluation of patients with chest pain. J Am Coll Cardiol. 2019;74(14):1741–1755. doi: 10.1016/j.jacc.2019.07.074.
- Vasudev R, Guragai N, Habib H, et al. The utility of bedside echocardiography in critically ill COVID‐19 patients: early observational findings from three Northern New Jersey hospitals. Echocardiography. 2020;37(9):1362–1365. doi: 10.1111/echo.14825.
- Klaeboe LG, Edvardsen T. Echocardiographic assessment of left ventricular systolic function. J Echocardiogr. 2019;17(1):10–16. doi: 10.1007/s12574-018-0405-5.
- Volpato V, Ciampi P, Johnson R, et al. Feasibility and time analysis of three-dimensional and myocardial deformation versus conventional two-dimensional echocardiography to assess cardiac chambers. J Am Soc Echocardiogr. 2022;35(10):1102–1105. doi: 10.1016/j.echo.2022.05.017.
- Zheng K, Bao Y, Zhu Y, et al. Feasibility of automated measurement of left ventricular volume and function using machine learning-based three-dimensional echocardiography. Chin J Med Ultrasound (Electronic Edition). 2021;18:1140.
- Ziheng Y, Pan H, Cheng Z, et al. Evaluation of left ventricular systolic function in patients with coronary microvascular dysfunction by three-dimensional speckle-tracking imaging. Brazilian J Cardiovasc Surg. 2021;37:321–327.
- Xu Y, Shi J, Zhao R, et al. Anthracycline induced inconsistent left ventricular segmental systolic function variation in patients with lymphoma detected by three-dimensional speckle tracking imaging. Int J Cardiovasc Imaging. 2019;35(5):771–779. doi: 10.1007/s10554-018-1510-2.
- Rampidis GP, Benetos G, Benz DC, et al. A guide for Gensini score calculation. Atherosclerosis. 2019;287:181–183. doi: 10.1016/j.atherosclerosis.2019.05.012.
- Chen D, Yan Z, Fan L, et al. Evaluation of cardiac function before and after PAD regimen in patients with multiple myeloma by three-dimensional speckle tracking imaging. J Healthc Eng. 2022;2022:1849969. doi: 10.1155/2022/1849969.
- Wang Y, Lu C, Li H, et al. 3D-STI evaluation of the effect of dexrazoxane on the mechanical properties of right ventricular myocardium in breast cancer patients treated with pirarubicin. Ann Palliat Med. 2020;9(3):1187–1197. doi: 10.21037/apm-20-1074.
- Li Y, Zhang R, Liu W, et al. Evaluation of right ventricular systolic function in patients with chronic renal insufficiency with 3D-STI. Progress in Modern Biomedicine 2019;22: 4060–4101. doi: 10.13241/j.cnki.pmb.2022.21.010.
- Dogdus M, Simsek E, Cinar CS. 3D-speckle tracking echocardiography for assessment of coronary artery disease severity in stable angina pectoris. Echocardiography. 2019;36(2):320–327. doi: 10.1111/echo.14214.
- Dogdus M, Kucukosmanoglu M, Kilic S. Assessment of the impact of isolated coronary artery ectasia on left ventricular functions with 3D speckle-tracking echocardiography. Echocardiography. 2019;36(12):2209–2215. doi: 10.1111/echo.14533.
- Dogdus M, Demir E, Cinar CS, et al. Coronary tortuosity affects left ventricular myocardial functions: a 3D-speckle tracking echocardiography study. Int J Cardiovasc Imaging. 2020;36(4):627–632. doi: 10.1007/s10554-019-01760-0.
- Taskin U, Mammadov G, Topaloglu C, et al. Evaluation of left atrial and left ventricular functions with 3D speckle-tracking echocardiography in patients with coronary artery tortuosity. Echocardiography. 2023;40(11):1237–1242. doi: 10.1111/echo.15702.
- Yu C, Li S, Ghista D, et al. Multi-level multi-type self-generated knowledge fusion for cardiac ultrasound segmentation. Inf. Fusion. 2023;92:1–12. doi: 10.1016/j.inffus.2022.11.004.
- Xu L, Huang X, Ma J, et al. Value of three-dimensional strain parameters for predicting left ventricular remodeling after ST-elevation myocardial infarction. Int J Cardiovasc Imaging. 2017;33(5):663–673. doi: 10.1007/s10554-016-1053-3.
- Song L, Zhao X, Lv W, et al. Preliminary study on the diagnostic value of cardiac magnetic resonance feature tracking for malignant ventricular arrhythmias in non-ischemic dilated cardiomyopathy. Ann Transl Med. 2022;10(4):215. doi: 10.21037/atm-22-660.
- Backhaus SJ, Aldehayat H, Kowallick JT, et al. Artificial intelligence fully automated myocardial strain quantification for risk stratification following acute myocardial infarction. Sci Rep. 2022;12(1):12220. doi: 10.1038/s41598-022-16228-w.
- Zhong J, Liu P, Li S, et al. A comparison of three-dimensional speckle tracking echocardiography parameters in predicting left ventricular remodeling. J Healthc Eng. 2020;2020:8847144
- Deng W, Xie M, Lv Q, et al. Early left ventricular remodeling and subclinical cardiac dysfunction in systemic lupus erythematosus: a three-dimensional speckle tracking study. Int J Cardiovasc Imaging. 2020;36(7):1227–1235. doi: 10.1007/s10554-020-01816-6.
- Negishi T, Negishi K, Thavendiranathan P, et al. Effect of experience and training on the concordance and precision of strain measurements. JACC Cardiovasc Imaging. 2017;10(5):518–522. doi: 10.1016/j.jcmg.2016.06.012.
- Rösner A, Barbosa D, Aarsæther E, et al. The influence of frame rate on two-dimensional speckle-tracking strain measurements: a study on silico-simulated models and images recorded in patients. Eur Heart J Cardiovasc Imaging. 2015;16(10):1137–1147. doi: 10.1093/ehjci/jev058.
- Mirea O, Pagourelias ED, Duchenne J, et al. Intervendor differences in the accuracy of detecting regional functional abnormalities: a report from the EACVI-ASE strain standardization task force. JACC Cardiovasc Imaging. 2018;11(1):25–34. doi: 10.1016/j.jcmg.2017.02.014.