
Abstract
This paper provides a more thorough empirical examination of the development and determinants of the liquidity position in the financial sector during the last financial crisis in the Baltic-Nordic region, which takes into consideration the whole economic cycle. The current study serves as an extension to an ex-ante study which was made in 2010. We look at fiscal and monetary policy implications of the liquidity problems arising in the crisis and stabilization process after that. The results show that the changes (and the speed of changes) of interest rates, GDP and money supply have occurred relatively fast, meaning that the rising area of the LM curve has been shorter than theory would predict. Market reactions took place quickly and simultaneously – there was no time for the slow restructuring, thus liquidity needs were higher than generally.
1. Introduction and background
The recent financial crisis had severe implications on the economies of many countries, but the Baltic States stand out as being among the biggest decliners as well as among the fastest to recover. The recent turbulence has been justly called a liquidity crisis (e.g. Cornett, McNutt, Strahan, & Tehranian, Citation2011; Baglioni & Monticini, Citation2010), as it all started from the liquidity problems which had more effects on different parts of the economies. For example Ellingsen and Vlachos (Citation2009) show a negative impact on international trade and Martell and Kravchuk (Citation2012) on public administration.
The aim of the paper is to look at the recent crisis from the liquidity point of view and study the effects of decreased liquidity on a sample of small open economies. The Baltic States have been chosen to be the sample as we can observe a direct influence of the larger neighbouring EU Nordic countries (Finland, Sweden, and Denmark, henceforth the Nordic countries) and relate the impact of the crises to developments in the Nordic countries. We approach the problem from the perspective of the Investment Saving–Liquidity Preference Money Supply (IS-LM) model in order to study the connections between money supply and real economy, before, during, and in the recovery period of the crisis.
We expect that the global financial shock, which decreased liquidity all around the worlds’ financial markets, affected the Baltic States more severely as the shock was amplified by the neighbouring larger economies pulling out their investments when funds are needed in the home country. The money supply in the Baltics (especially Estonia and Latvia) greatly depends on the actions of Swedish banks, which in turn are not alone in their investment decisions, but must comply with the regulations of their home monetary policy institutions. Thus any monetary easing in foreign markets is greatly delayed reaching the Baltics, whereas any crisis transmits directly to the markets, and is further amplified during the first phases of the crisis.
The current paper serves as a complement to our 2010 ex-ante study of the crisis (Karilaid & Talpsepp, Citation2010). Methodologically we take a similar approach and extend the time series till the end of the recovery period. This enables us to study and compare the developments of the sample countries during the starting phase of the crisis as well as the recovery period. Thus, the paper can serve as an ex-post study of the consequences and lessons of the crisis from the liquidity point of view. We approach the problem from the perspective of the IS-LM model to study the connections between money supply and the real economy before, during, and in the recovery period of the crisis.
With the financial shock, economies fall into the liquidity trap (Keynes's area of the LM curve) which can happen quite fast, depending on the severity of the shock and presence of any amplifying factors. Decreased liquidity starts to affect the real economy and we expect negative consequences to be seen (in addition to money supply and interest rates) in the GDP, reserves, investment position, and foreign trade. The transmission of the effects of expansive monetary policy which should soften the liquidity problems may not be as fast as the negative shock, and can be delayed depending on the characteristics of the economy and direct regulative measures available. Thus, we expect the movement from the vertical area of the LM curve to the horizontal area (liquidity trap) to be always faster than the subsequent recovery.
It is important to recognize the effect of liquidity and the connections between money supply and the real economy because they can help to soften similar effects during future turbulent times. The paper is motivated by the severe effects that took place in the economies as a consequence of the liquidity problems and the fast changes that took place during the starting and recovery phase of the crisis. Our contribution to the literature is a complex view of the developments of the recent liquidity crisis, including a recovery phase, which so far has earned only a modest attention. In addition, we explore how the crisis affected the economies of the Baltic-Nordic countries by studying the changes in money supply, economic growth, reserves, and investment position which serve as indirect indicators of the liquidity crisis. The indirect approach is justified as the viewed countries are connected to each other economically as well as through the banking system.
We study the crisis based on the theoretical approach of the IS-LM model with its roots, contemplations, and interpretations of Keynes's work (Hansen, Citation1953; Hicks, Citation1937). According to Gordon (Citation1994), we can divide the usually steady and rising LM curve into three areas and treat them separately. We can distinguish between different areas of the curve and the sequence and speed of the shifts between the areas means that based on the capital market transactions, the money market is moving to the next equilibrium point. The theoretical sources of the hypothesis are supported by the Law of Say and the Law of Verdon.
We are most interested in the Keynes's area, which is where the curve is quite horizontal and can be referred to as a liquidity trap when money is pulled out of business transactions. The opposite of the situation is the vertical area of the LM curve, which occurs in the booming economy when all money is used for business transactions. In-between there should be a more realistic area of the LM curve when the curve is rising, meaning that money is divided between bank accounts and business transactions. Theoretically, shifts from the vertical area to the horizontal area should take some time which should give economies time to adjust to the changes. However, the empirical data of the recent crises shows that situations exist when the shifts between the areas can be very fast, which has severe effects especially on small open economies. We take an empirical approach to try to study the speed, sources, and consequences of the shifts between the different areas of the curve. The contribution to the literature lies in empirically identifying the possible factors coming from the influencing economies that affect the speed of the changes, as well as explaining the connections and changes in correlations between the money supply and the measures of the real economy in the context of the recent crisis for the sample countries.
As the LM curve is difficult to observe with empirical data, we have to take an indirect approach and study economic indicators to see when the shifts between different areas of the curve took place and estimate the time for such changes. The problem is that excluding the presumed equilibrium point of the current money supply and interest rate, the theoretical demand and supply quantities of the money at different interest rate levels are difficult to estimate.
During the Keynes's area or the period of the liquidity trap, we are in a situation where the current interest rate level and money supply quantity do not necessarily clearly represent the quantities that should be needed in business transactions and despite interest rates soaring, do not give an insight of the theoretical demand and supply quantities present at the different interest rate levels at the same moment. Thus, data availability dictates our indirect approach where we still can observe interest rate levels (we mostly look at overnight rates) but cannot observe the demand and supply quantities at different interest rate levels and have to look at different relevant indicators instead.
Studying the changes in the interest rates and different economic indicators still enables us to study the speed of changes in those indicators and measure both the correlation and cointegrations of the series of the economic indicators. Combining the analysis of the connections between different indicators and countries with drawing qualitatively explained conclusions from the time series and cross sectional differences gives us a better picture of the consequences and implications of the crisis for the countries. Studying such effects enables us to suggest policy measures that could be used under such circumstances and learn what the lessons of the liquidity crisis are.
In general, all economic crises tend to have similar characteristics that precede the crisis and describe how the economy recovers from the crisis. Reinhart and Rogoff (Citation2009) conclude that there is a typical path, which leads to the crisis. The period before the crisis usually means fast economic expansion with increasing consumption and booming prices in different real and financial sectors. During the first or second year of the crisis unemployment as a lagging indicator starts to decrease; GDP tends to post the biggest decline one year after the start of the crisis. Even though inflation can still be high during the start of the crisis and decline together with an economic downturn, there is not a clear trend which describes the typical dynamics of inflation. Studying our sample of countries, we can recognize the same main characteristics.
Reinhart and Rogoff (Citation2009) also argue that in the case of sudden large capital inflows countries are at a high risk of debt crisis. The result of the process of large capital inflows can be an over borrowing in good times, which in turn makes countries vulnerable during the inevitable regressions. According to Mai (Citation2008) the same scenario was present in the Nordic countries during the banking crises of the 1990s. Unfortunately bankers in the region did not learn their lesson and the same happened in the Baltics again during the recent crisis (for the chronology of the crisis in the Baltics see, for example, Purfield & Rosenberg, Citation2010).
There are also several studies about the recent crisis, which focus on different influences of the crisis. For example Cornett et al. (Citation2011) look at the impact of the crisis on the US banks. They conclude that banks with a stronger core deposit and equity base continued their lending activities, but banks with more illiquid assets in their portfolio increased their holdings of liquid assets and decreased lending. This means that efforts of the banks to manage the liquidity crisis led to a decline in credit supply. This is also consistent with the findings of Campello, Graham, and Harvey (Citation2010) who find that firms around the world sharply cut back and cancelled their planned investments because of the credit constraints in the recent crisis. In addition, constrained firms also accelerated the withdrawal of funds. Similar conclusions can also be found in other studies focusing on both developed and developing countries (Poulsen & Hufbauer, Citation2011; Ucal, Özcan, Bilgin, & Mungo, Citation2010). Besides, decrease in money supply meant that interest rates went up (Acharya & Merrouche, Citation2012) and negative money supply shocks caused overall economic output to decline as well (Cover, Citation1992).
Currently we cannot say with full confidence that the financial and economic crisis has completely ended as some of the effects of the crisis are still present. Despite the lack of full recovery in some areas, this paper takes an ex-post view of the consequences of the financial crisis and recovery for the money market, liquidity issues, and policy implications. It offers solutions to problems faced in the crisis, along with reactions and specifics of the changes which occurred during the crisis period.
In addition to focusing on the money market we also study other economic indicators to get as complete an economic picture as possible. This is also needed for making policy decisions. The money market plays a fundamental role in discount rate formation and in the investment decision process in general.
As higher consumption and import surpassed export in the Baltic States before the crisis, the current account balance became negative. Restructuring the economy and production or devaluing the local currency is needed to stimulate export during the crisis. Therefore, in the countries with pegged currencies, devaluation of the currency is a very common side effect of the crisis. Considering lessons from the past crises, there is no surprise that expectations and fears of devaluating of local currencies emerged also in the Baltic States but did not take place in reality. Thus, the negative effect on the real economy was even more severe and puts the case of the Baltics in a unique perspective in the crisis literature.
The policy measures available in such a scenario are limited but still exist. It is very important to have a full knowledge of government indebtedness to soften the unwanted outcomes during the crisis. Debt sustainability is a critical factor in the case of a sudden stop of capital flows. Therefore, it has to be based on credible scenarios in the framework of economic performance. Considering monetary policy, the level of domestic debt tends to have an influence on inflationary risks as many governments are tempted to inflate domestic debt away. The recent crisis has taken a liberal monetary policy to the next level in the sense of different stimulus packages, which have not been so widely used before.
Section 2 provides a brief overview of the used data and methodology. Section 3 documents the empirical analysis of the current crisis in the Baltic and Nordic countries using a large number of economic indicators and suggests policy measures to soften negative consequences. Section 4 discusses different possible policy measures for the Baltics and Section 5 provides a conclusion.
2. Methodology and data
The focus of the study is on the last financial crisis with the attention on the period from 2006 to 2012. For specific indicators, also an overall period from 1995 to 2012 is viewed, as the development period of the Baltic States (Estonia, Latvia, and Lithuania) plays an important role. In addition to the three Baltic States, the sample consists of three Nordic countries (Finland, Sweden, and Denmark). The sample enables us to observe how the banking sector and the small open economies are influenced by the neighbouring more developed countries which impact on the inflow of funds to the smaller countries.
We use the latest available data from ThomsonReuters Datastream and International Monetary Fund International Financial Statistics (IFS). For better comparability, we use the average exchange rates in situations where comparing the magnitude of the series across countries is necessary. Data about reserves, foreign trade and investments, and the asset and liabilities structure of financial institutions come from the IFS databank. Most of the macroeconomic indicators and interest rate and exchange rate data come from Datastream.
To study the asset structure of the financial sector, depository institutions are used, as commercial banks play the most important role in money and capital markets in the Baltic States. The influence of other participants in the financial sector is limited (Kein, Citation1999) and has not changed recently.
As we study the developments based on the LM curve and because of data availability, we are forced to use an indirect approach. Based on the analysis of time series and cross sectional differences of the economic indicators, we offer mostly qualitatively explained conclusions. The connections between different economic indicators are verified based on the number of single regressions. In addition, we also present the correlation matrix along with the Johansen cointegration test results.
Given the indirect approach of studying the shifts in the LM curve, we expect to see the negative consequences of the liquidity crises for all countries to affect their real economy in decreasing money supply, temporarily high interest rates and decreasing economic growth. Falling into the liquidity drop would result in increasing reserves and decreasing foreign investments and trade. During the start of the depression such indicators should move closely together in all of the sample countries. This can change for the trough of the curve and the recovery phase where correlation of the indicators among countries should decrease. Running correlation and cointegration tests before and after the crisis should help to identify such effects.
3. Empirical study of the crisis and the recovery
3.1 Interest rates and money supply
Studying the changes in interest rates and money supply should give the best overview of the movements of the LM curve. Those indicators still remain indirect, as we cannot directly observe the level of money supply at different interest rate levels to be able to derive the LM curve reliably.
Interest rate co-movement of the Baltic and the Nordic countries shows that interest rates of Denmark, Sweden, and Finland coincide greatly with Euro area interest rates. Although Denmark and Sweden have not adopted the Euro, their central banks have lowered the rates in quite a similar manner as the European Central Bank. This is reflected in the overnight interest rate level, which follows closely the base rate of the country.
Interest rates of the Baltic States have behaved slightly differently during the crisis. The period from 2000 to 2007 was more volatile for Latvian and Lithuanian rates. The dramatic increase (and decoupling from Euro rates) of the interest rates in the Baltics clearly illustrates the situation where central banks are unable to provide expansive measures. Local markets are more influenced by the outflow of foreign investments, which happened after the beginning of 2007. The speed in the change of interest rates was dramatic during the recent crises. For example, it took 20 days in September 1999 for the Latvian overnight rate to rise from 3.5% to over 8% and less than 10 days in March 2007 to rise from around 2% to 8%. Such quick changes do not allow the economy to adjust to the changes in the interest rates and shrinking money supply ().
Figure 1. Changes in interest rates, GDP and money supply before and during the crisis. The left vertical axis presents the changes in money supply and GDP. Money supply and GDP are indexed to their initial value at the starting point of the data. The right vertical axis presents the changes in overnight interest rates. Data cover the period from Q1 1995 to Q2 2012.
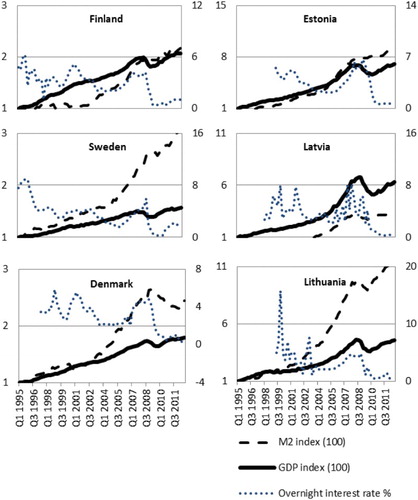
During the recovery phase starting in the second half of 2009, it took slightly longer for short term interest rates to drop and become less volatile in the Baltics. In terms of volatility, uncertainty seems to remain higher for Estonia and Latvia, which were considered to be the more likely countries to devaluate their currency. Because of the pegged currencies, central banks in the Baltic States have no tools to directly influence the interest rate by money supply. This means that policy makers are basically unable to influence liquidity on that level.
So other ways should be considered in case of market liquidity problems. Brunnermeier and Pedersen (Citation2009) suggest that easing requirements for margin or funding helps to improve market liquidity. Even public communication about extra funding could mitigate the tense liquidity situation.
The decrease of the interest rates in the Nordic countries was even faster and happened quite simultaneously with the action of the Swedish central bank. The Swedes lowered the rates, which could be seen in the market already in the second quarter of 2009. It was closely followed by the other two Nordic markets in the third quarter of 2009. If we are not bothered by the fact that short term interest rates are less than 1% (which should be abnormal, as the rates have not been so low during the rest of the viewed period since 1995 and for such a long period in the European history), the conclusion of the crisis could be that interest rates are very sensitive to both bad news and good news (or at least to the central bank action, which in the current crisis context seemed to lead to a recovery). So the interest rates were one of the most sensitive indicators of the worsening and improving market conditions before and during the crisis. As more fundamental economic indicators (conditions) are not able to adjust that quickly to the changes of the interest rates, such situations prolong problems for the whole economies.
illustrates the situation further, as we can see that the recovery in the money supply was not so fast as for the short term interest rates. When Nordic countries, on average, have been able to continue to hold a more or less stable positive trend in the money supply even after GDP levels have started to deteriorate, the same has not happened in the Baltics. Especially Latvia and Lithuania faced even more abrupt decline in the money supply than the dramatic fall in GDP figures during the start of the crises. Still, such a fall was turned around and the money supply started to grow already in the fourth quarter of 2009, although at a slower pace than the preceding decline. Still, the movements in interest rates, the money supply and the GDP are consistent with the predictions of the LM curve as the changes were quick and the adjustment process of the economy happened with a delay.
If we look at the inflation, we can see similarities among Baltic countries before the crisis, but also that the situation in Latvia was a little worse than in Estonia and Lithuania. In 2007 and 2008 inflation (measured by consumer price index (CPI)) in Latvia rose even above the 10% level and before that it had not been lower than 5% since the beginning of 2004. As a result of the crisis, inflation in Latvia reached below 5% in the second quarter of 2009 and has been moving even lower after that. In Estonia and Lithuania inflation remained around 5% before rising also above 10% in 2008. The described highly inflationary environment in the Baltics meant negative real interest rates and encouraged firms to invest and households to spend as much as possible.
During and after the crisis, there was only a short period in the second half of 2009 (and in some countries the first quarter of 2010) when real interest rates were positive (because of 0 or negative inflation) and even then nominal interest rates were about 1% or less. Already starting from 2010, we can once again speak about negative real interest rates in the Baltic States as CPI figures reached 3–5%. It means clearly negative real interest rates as nominal interest rates were less than 1%. All of the stimulus that comes from the negative real interest rates does not reach the economy as margins for bank loans to both households and companies are still at least around 1% higher in the Baltic States than they were during the pre-crisis years, which is also reflected in the slower growth pace of the money supply.
The economic environment in the Baltic countries in the pre-crisis years was attractive for foreign capital. The situation turned around when interest rates increased and the inflationary environment changed into deflationary. Decreasing money supply and devaluation worries led to high interest rates on deposits in commercial banks. As risk was minimized and real interest rates were high, money was held on deposits. At the same time shrinking economy and increased risks made investments unattractive and foreign funds were flowing out. These developments are also consistent with previous literature (Poulsen & Hufbauer, Citation2011; Ucal et al., Citation2010).
Despite currently very low nominal interest rates and negative real interest rates, the asset structure of the depository institutions (see and ) still shows that not much has changed. Most probably because of fear caused by recent turbulence, the money lying in deposit bank accounts still increases and does not reach the economies although it is not encouraged by interest rates any more.
Figure 2. Asset and liability structure of depository financial institutions in Estonia, Latvia, and Lithuania. The left pane presents the asset structure in the following order: claims on other sectors; claims on central government; claims on non-residents. The right pane presents the liability structure in the following order: shares and other equity; other shares excl. from broad money; liabilities to central government; liabilities to non-residents; M2 deposits; M1 deposits.
Figure 3. Asset and liability structure of depository financial institutions in Denmark, Finland, and Sweden. The left pane presents the asset structure in the following order: claims on other sectors; claims on central government; claims on non-residents. The right pane presents the liability structure in the following order: shares and other equity; other shares excl. from broad money; liabilities to central government; liabilities to non-residents; M2 deposits; M1 deposits.
3.2 Economic growth
Developments described in the previous subsection are connected with the dynamics of GDP (which we consider as a key indicator of economic well-being). The dynamics of GDP should show clearly the negative consequences of the liquidity crisis on the real economy. The GDP series is not as volatile as interest rates and reflects the situation in the real economy better than money supply figures. Thus, by considering a slight delay, GDP could also serve as an indicator where the LM curve is shifting, as we expect to see clear consequences of the liquidity trap in the real economy.
In Karilaid and Talpsepp (Citation2010), we conclude that the correlation between the GDP (measured in EUR) growth rates of the studied countries is in all cases over 0.7 and in most cases between 0.8 and 0.9 for the Baltic States and the Nordic countries (the lowest figures are for Sweden but it is influenced also by the fluctuation of the Swedish krona). Thus, we can assume significant influence of the Nordic countries on the Baltic States, as much of the financial sector in the Baltics is under the control or direct influence of the Nordic origin banks and the countries are also closely integrated due to international trade. The correlation between the sample GDP growth rates has not decreased much during the crisis years.
We look at time series of GDP in both Euro and local currencies. This approach gives us a more complete picture of the developments in the sample countries. For example Sweden experienced quite stable GDP growth in the last quarter of 2007, when measured in kronas. But as a result of the weakened krona, the growth was only 0.5% when GDP was measured in Euros. At the same time all other countries in the sample still showed a strong growth (with a tiny exception of slowing in Denmark). Surprisingly, already the next quarter brought Estonia and Denmark to a negative territory. Latvia joined in three months later and the rest of the countries in the last quarter of 2008. As on a global scale financial markets were collapsing and volatility was surging to never seen before levels, this meant that hopes of a soft landing for economies were erased.
Considering the framework of the EU and GDP measured in Euros, Sweden, as the largest economy in the sample, was along with Estonia the leading country with economic growth slowing and turning negative. Therefore we could expect that the greatest influence on the smaller neighbouring countries came from Sweden and that worries in Swedish financial sector were most felt in Estonia and Latvia.
The crisis meant five to seven quarters of falling GDP for the countries in the sample. Latvia took the hardest blow with seven consecutive quarters of falling GDP (measured in EUR) and had not still reached the high levels of 2008 by the third quarter of 2012. All other countries in the sample recovered to the 2008 levels by the first half of 2012 and the best figures were for the largest economies in the sample: Sweden and Denmark. They reached 3–5% higher GDP figures by the third quarter of 2012 compared to previous high levels (we have to consider a slight error in the exact growth figures because of seasonality). Estonia and Lithuania fully recovered by the second or third quarter of 2012 and to date, are less than 3% ahead of previous peaks.
We can say that the more developed and larger Nordic countries survived the crisis better than their smaller and less developed counterparts in the Baltics. About four years after the start of the decline in the GDP, when all of the countries (except Latvia) had recovered in terms of the GDP, the Nordic countries had grown faster during that four year period than the Baltic States. It occurred despite the fact that the growth pace of the Baltic States had been about two times faster during the crises than it had been before the crisis.
Correlations within countries (see Appendix 1) between money supply (either M2 or M3) and GDP are strong, around and over 90% for all countries except Estonia where GDP figures fell clearly more than money supply, which recovered relatively more quickly. Especially for the Baltic countries, cointegration test results mostly confirm the correlation findings, especially if we only look at the period till the end of 2009. Correlation between money supply and interest rates has an expected negative sign. During the recovery period, interest rates remained low in all of the viewed countries and money supply fluctuated more. We can see a slightly decreased correlation between interest rates and other viewed indicators, but the sign has in most cases not changed.
The changes in the cointegration results (see Appendix 1) are pronounced. Cointegration analysis results depend more than correlation results on the length of the sample period. Including the period from the end of 2009 until 2012 in the calculations, the tests do not establish cointegration between nearly as many country-indicator series as previously. The only difference comes from the money supply series where tests mostly show that cointegration between the sample countries’ money supply and its impact on other economic indicators has remained the same or even increased. Although the general trend during the recovery phase is a decreased cointegration between countries, the money supply is a clear exception and shows the importance and the role of liquidity during the crises even if the impact and path to recovery for the viewed countries was slightly different. Care should be taken in interpreting results where changes in cointegration depend only on a short time period, especially where the crisis years change the statistical significance of the coefficients below the accepted threshold (p-value 5%). Thus the general conclusion can only be that during the crisis and the recovery, the changes in various indicators have been drastic. This has decreased the strong relationship between the countries (except for the money supply) but the pre-crisis years indicate that such relationships should strengthen again during normal times.
3.3 Reserves, investment position and foreign trade
In addition to changes in economic output, the crisis situation was clearly reflected also in the international reserves. In less than half a year (starting from the third quarter of 2008) reserves in Denmark more than doubled and increased by 40% in Sweden in June 2009. Rising reserves during the crisis were common to the whole sample, but changes in the Baltic countries (where the ability of implementing monetary policy is limited) and Finland were not so drastic. Increasing reserves are quite an expected consequence of the liquidity trap where funds are pulled out of the real economy.
Changes in international reserves did not affect the total depositor financial institution assets to the same degree but piling up the reserves still made the situation worse in the sense of liquidity and the money supply. In Denmark reserves amounted to 6% in the second quarter of 2009, in Sweden 4% and in Finland 2% of depository assets. At the same time in Estonia, Latvia, and Lithuania, the same figures were 12%, 9%, and 15% as the Baltic countries needed to hold larger reserves due to pegged currencies. Latvia had some trouble with maintaining the reserve level as foreign funds were flowing out (Transition Report, Citation2009).
We can see that during and after the crisis, reserves generally still followed a growth trend but the growth pace was clearly slowed down and we do not see any comparable jumps in the reserves as we saw during the start of the crisis. Latvia is the only country which has decreased international reserves in 2012 compared to the second half of 2010. Sweden has remained quite stable and Estonia faced decreased reserves during the adoption of the Euro in 2011.
When we look at the investment position of the sample countries we can see that as domestic interest rates increased, the money supply started to decline and the economy was slowing down, both direct and portfolio investments started to be pulled out from foreign countries in all cases (see ). We can also conclude that Nordic countries tend to have a bigger amount of foreign portfolio investments, which is common for more developed financial markets. In contrast, Baltic countries are dominated by direct investments and tend to have less portfolio investments.
Figure 4. Direct and portfolio investments in economy and abroad. Data are presented in million USD from Q1 2006 to Q2 2012.
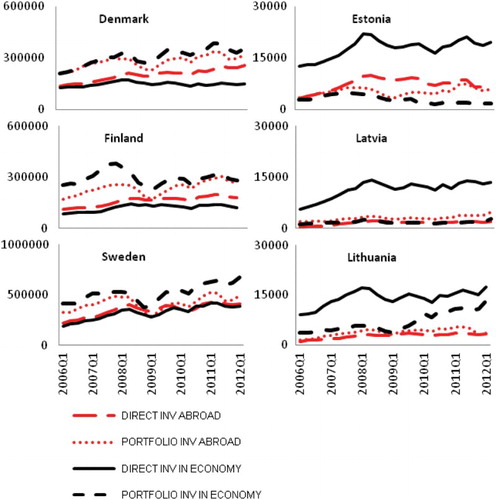
Even though the Estonian economy is the smallest in the Baltics in absolute terms, it has attracted more direct and portfolio investments than Latvia or Lithuania. In the crisis environment these investment flows change direction and when the liquidity situation is tense, this has a great influence on domestic economy. Therefore Estonia tends to suffer most when investments are pulled back as its dependence on them is the greatest (the biggest share of foreign investment compared to GDP in the local economy).
In the crisis period of 2007–09, there is a clear correlation between outflow of foreign portfolio investments and decreased stock market prices and value. Therefore, we can conclude that the movement of stock market prices is dependent on the behaviour of foreign investors within and originating from the Nordic region. The correlation is strongest for Estonia and Finland. When studying the Nordic countries and the Euro area, we can see that the drop in direct investments was smaller than in foreign portfolio investments. At the same time the Nordic countries also pulled out their own portfolio investments abroad. So it should not be a big surprise that the two processes – shrinking stock prices and almost ceased lending of foreign owned banks – happened simultaneously as all the three Baltic countries are highly dependent on the Nordic countries.
The assumption during the crisis was that the drop in direct foreign investments in the Baltic economies can have a longer term negative effect. Generally portfolio investments are more mobile, meaning that they can move in and out of the economy faster than direct investments. In the case of Lithuania, the recovery of the portfolio investments has been fast, but the same cannot be said about Estonia and Latvia. Those two countries are still facing the decrease in portfolio investments in the economy which started already in 2007 and 2008.
For the Baltic countries, direct investments in the economy still have not recovered to the levels of the pre-crisis. The positive aspect is that the drop in the direct investments was not as big as for portfolio investments and we can see a stabilizing level of direct investments in the economy. As before the crisis, foreign inflow of investments had a clear stimulating effect on the Baltic economies, this cannot be the case (at least to that amount) during the recovery period ().
Figure 5. Boosting of international reserves during the crisis. The left vertical axis presents the figures in billion SDR for Nordic countries and the right vertical axis in billion SDR for Baltic countries.
Investments abroad as a share of GDP is lower for all Baltic States compared to the Nordic countries. This is probably one of the reasons why Estonian, Latvian, and Lithuanian investments abroad lost relatively less than the Nordic countries. At the same time as the Nordic countries have made investments into the Baltic States, the value of the Nordic investments abroad has also been influenced by the downturn in the Baltic economies. Studying the correlation and the size of the Nordic countries’ figures in the sample, we can conclude that the decrease in foreign investment may also be affected by pulling back portfolio investments from each other's economies. For the Baltic countries, the outflow of the Nordic funds has also had a negative influence on the economy. The same is also reflected in the total assets of the depository institutions (mostly owned by Scandinavian banks) of the Baltic countries, which all are still decreasing despite otherwise positive signs of recovery in the economies.
When we look at the time before the liquidity crisis, we see that the inflows to Baltic States more than tripled between 2004 and the end of 2007. As documented by Reinhart and Rogoff (Citation2009) typically that kind of development leads to excessive borrowing, high inflation, and therefore can create an unwanted situation, where these inflows are not present anymore. That also happened in the Baltics. In such cases policy makers actually have power to calm down the borrowing by establishing higher capital requirements. In reality, motivation to use this power tends to be very low, because it would cool down also the overall economy. Therefore typically the result of excessive borrowing is still higher volatility in the economy.
In the current case we see a situation where the inflow of funds has still not recovered, which can either mean that it takes longer for foreign investors to regain their confidence in investing in the Baltics or that pre-crisis growth was just too fast and the adjustment process to long term averages is still taking place. Either way, the Baltics (with less influenced Lithuania) seem to be missing one of their previous main catalysts of inflow of foreign money and still have to cope under a stable level of investments. The positive sign is that despite the lack of growth in the foreign inbound investments and decreased depository institutions’ assets – economies have been recovering and the money supply is in a positive trend.
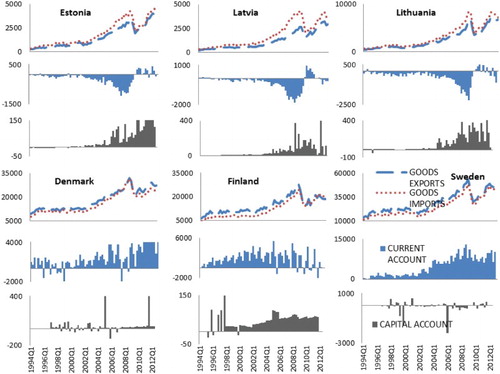
During the period of fast growth we can see that the current account deficit is increasing in all Baltic countries (see ). If we look at the crisis period the situation is basically the opposite (although not to the same magnitude). In contrast to the Baltic States, the dynamics of current or capital account have not been so clear in the Nordic countries. Export and import has moved together with GDP in the Baltic countries, experiencing sharp decline in 2008. Comparing movements of export and import, we can see that export did not drop as much as import did in the Baltics. The recovery has been typical – remarkable drop in imports led to the positive trade balance and restarted the economy.
Figure 6. Exports, imports, current account, and capital account. Data are presented in million USD from Q1 1994 to Q2 2012.
3.4 Depository institutions’ balance sheet structure
Finally we analyse how the crisis affected assets and liabilities of the depository institutions. This should give us a picture whether and how funds have moved away from the economy and what has happened during the recovery phase. From the aspect of available liquidity, strong financial institutions play a critical role during the crisis, because problems in the banking system can have a very negative effect on the whole economy (see, for example, Bernanke, Citation1983). Until the second half of 2008 banks’ balance sheets do not reflect the negative impact of the crisis as assets were still growing (see ). According to Brixiova, Vartia, and Wörgötter (Citation2010) the Baltic States were outstanding leaders among emerging economies in the sense of private sector credit growth in the period of 2001–07. This fact boosted the commercial banks’ balance sheets. From the end of 2008 banks in the Baltic countries and Sweden (most influenced by the developments in the Baltics) have experienced a modest drop in the assets, which is at least partly connected to the loan losses. As Sweden was able to overcome the situation and banks’ assets have been growing since 2009, this is not the case in the Baltics which cannot any more be explained by loan losses but that foreign owners of the banks are still pulling out their capital from the Baltics, which has a negative effect on the money supply and thus on the economy overall.
Figure 7. Assets of depository financial institutions. The left vertical axis presents the figures in billions EUR for Baltic countries and the right vertical axis in billion EUR for Nordic countries.
Before the crisis the trend in bank asset structure in the Baltics (see ), especially in Latvia and Lithuania, was that claims on foreigners were decreasing and domestic exposure was rapidly growing. The situation turned around during and after the crisis when the share of claims on non-residents has been growing. In that sense Denmark (see ) has been at a quite stable level but foreign exposure of Finnish banks has been growing since 2009 and of Swedish banks since 2004. At least some part of that foreign exposure growth can be reasoned by financing Swedish banks in the Baltic States. Claims on the central government have decreased constantly.
The Baltic States’ dependence on the inflow of foreign funds is clearly reflected in the banks’ liabilities. About half of the liabilities in Latvia are to non-residents; the same figure in Estonia is around 40%. These liabilities are mainly parent companies’ loans to local banks. Such funds can escape in times of economic trouble, which puts even stronger pressure on the liquidity position. The latter has been especially the case in Latvia (Transition Report, Citation2009). Further analysis of the balance sheet structure shows that the share of liabilities to non-residents has decreased for all Baltic countries making the fears of fleeing funds a reality. Such a negative effect seems to be smaller for Estonia and Latvia.
The overall liquidity picture in the Baltics is strongly influenced by a large share of liabilities to foreigners. If we do not consider these liabilities, we can see an accumulation of liquid assets on deposits. This means that money has still been trying to escape from the shrinking economy during the whole period of recovery. The situation of increasing deposits in the Baltics is consistent with the findings of Cornett et al. (Citation2011), but contradicts the situation in the more developed and stronger economies where the share of deposits has been quite stable in Denmark and Sweden and has been decreasing in Finland. This can probably give an indication of the confidence to make investment decisions. In addition to commercial banks, we can also look at the liabilities to the central government. Interestingly, liabilities to the central government have a minor role in Estonia, but have expanded in Latvia, Lithuania, and also in Denmark and Sweden (which is an expected change).
4. Discussion of policy measures
The situation where interest rates soared along with decreasing money supply was clearly worse in the Baltics compared to the Nordic countries. These developments are also consistent with the findings in other countries (Acharya & Merrouche, Citation2012) and illustrate the case where the central banks in small open economies are incapable of softening the negative impact of plummeting money supply. As our results show, this had also a negative effect on GDP, which confirms previous findings that negative money supply shocks make an economic output shrink (Cover, Citation1992). A high correlation of GDP and money supply between the sample countries also indicates that financial sector worries spread over the region. The Baltic States were negatively influenced by the outflow of funds initiated by the Nordic side, which occurred along with the increased international reserves worsening the situation even further. The outflow of foreign investments started in 2007 and did not recover until 2012. Sweden and Denmark had more means to deal with the liquidity situation as bigger and less dependent economies. The Nordic countries were also in a stronger position before the crisis. Therefore, the impact and negative changes were felt harder in the Baltic countries.
A classical policy makers’ approach is to start cutting interest rates in the case of economic downturn to stimulate the economy. During the recent crisis, cutting of interest rates is exactly what happened starting from 2008. The interest rates dropped significantly, at the same time when GDP was still falling. The cutting of interest rates and keeping money supply level comparable to the pre-crisis period was not possible in Estonia, Latvia, and Lithuania. Interest rates in Estonia, Latvia, and Lithuania moved higher during a longer period due to the shirking money supply, loss of confidence, and rising devaluation expectations. Thus, it should not be too surprising that in addition to the shrinking economy, the decreased money supply and increased interest rates worsened the situation during the crisis.
The findings of our previous work (Karilaid & Talpsepp, Citation2010) are still meaningful and we can conclude that high interest rates are associated with the lack of confidence among market participants, who demonstrate weak faith in the banking system and in the persistence of currency pegs. Therefore, a sound fiscal policy, in the sense of well-managed government expenditure and external public debt together with actions to boost the confidence in the market, could help to decrease the negative speculation towards currencies. This was not possible during the recent crisis and thus it took slightly longer in the Baltic States for the money supply to recover, which was amplified by the decreased government expenditure.
Thus, in a country with a pegged currency, policy makers have expansive means to stabilize the system only when external financing and plausible assurances of stability are available also during the crisis. This requires conservative borrowing and spending during good times. In the crisis period, capital outflows are not only common to emerging economies, but also to other countries (Poulsen & Hufbauer, Citation2011).
The recovery process has occurred quite simultaneously in all countries of the sample. Although the growth rates have been higher in the Baltics than in the Nordic countries during the four year period starting from 2008, the Baltics are still behind the Nordic countries by 2012. This is also reflected in cointegration results which indicate a decreased cointegration of the economies except for the money supply indicator. We can say that recovery has been the fastest for the money supply and interest rates in all countries. Restoring money supply has in fact been quite successful during the last crisis mostly due to expansive monetary policy around the whole world, which also affected the Baltics in a positive way. The slowest to recover have been foreign inbound investments to the Baltic States (mostly in Estonia and Latvia). Implications of the slow foreign investments’ recovery after the recent crisis can be also found in previous literature (Poulsen & Hufbauer, Citation2011).
Even though central banks in the Baltic States are unable to influence money supply by interest rates, there are some levers policy makers can still use in pegged currency systems. One tool for softening the liquidity crisis is well-designed public communication about extra funding. The aim of such communication is to inject the necessary confidence in the financial markets, but can be used only if the necessary buffers exist.
Another way for policy makers in pegged currency systems to affect positively the liquidity situation is to implement a conservative fiscal policy in times of growing economy. This helps to improve the chances to support the economy and also obtain external financing during the crisis and recovery.
In case of the Baltic countries, we can conclude that governments were at least to some extent blinded by the economic success. This was reflected in rapidly increased government expenditure. For example, salaries in the public sector and social benefits increased a lot faster than inflation before the crisis. In Lithuania spending on maternity benefits doubled from 2006 to 2008, in the same period pension costs increased almost 40% and sickness pay more than 60%. Similar trends were also experienced in the other two Baltic countries (Purfield & Rosenberg, Citation2010). These high growth figures contributed to sharp budget cuts during the crisis. We can argue that Baltic governments first accelerated the boom and then were also forced to amplify the bust of the local economies. Therefore, the lesson for the future is to take a more countercyclical fiscal policy approach.
An illustrative example here may be government payments to mandatory pension funds, which were also reduced and even stopped during the crisis (for example Estonia did not make any payments from June 2009 until the end of 2010). Implementing a countercyclical policy, which means increasing or at least continuing the payments to the pension funds, would have had at least two positive consequences. First, if policy makers support pension funds to invest in the local economies, this will help the overall economy to recover. Secondly, as asset prices tend to reach the bottom during a crisis, also buying from the very low, could increase the returns on pension funds.
Policy makers should aim to achieve sustainable capital flows, which means trying to avoid the excessive inflows during economic booms and large outflows during crisis. This is especially important for the small open economies as the experience from the recent crisis and our results indicate. On the one hand, government guarantees on deposits should help to increase the confidence and ease the liquidity situation as it reduces banks’ own liquidity risks (Cornett et al., Citation2011). On the other hand, stabilizing foreign capital inflows in a growing economy by higher requirements for margin or funding should also help to avoid hard landing. The current crisis shows that after extreme volatility in the economy, it is very difficult to restore the confidence in foreign investors (both direct and portfolio investors).
Another way to stabilize the foreign capital flows and volatility of the economy is to set maximum loan to value (LTV) ratios on mortgages. This is a simple and effective measure to regulate the money market (Gelain, Citation2011; Hong Kong Monetary Authority, Citation2011). LTV policy could be a successful tool for the Baltic countries, which are dependent on foreign banks. Setting the LTV ratio lower in good times means reducing the demand for loans and therefore cooling down the credit and the real estate market, which has been the main reason why the Baltic economies have fluctuated so much during the last decade. Easing the LTV policy during the crisis and recovery period should help to activate the economy.
5. Conclusions
The recent liquidity crisis triggered simultaneous changes in all of the Baltic-Nordic countries in interest rates, GDP, and the money supply. These changes occurred relatively fast, meaning that the rising area of the LM curve turned out to be shorter than the theory would predict. This also meant that the economies did not have time to adjust to the new levels and caused a situation where interest rates soared especially in the Baltic States along with decreasing money supply.
We conclude that a lack of direct monetary policy means, high dependence on and correlation with larger neighbouring Nordic economies can make the Baltic policy maker's use of levers less effective. However, there are still tools available to stabilize a small open economy. These tools are most effective, when using them during the good times. Still they can be also used in other times as they can also effectively help to soften a negative impact of a crisis and support the recovery.
Funding
This work was supported by Estonian Research Council target financing [grant number SF0140059s12].
Notes on contributors
Ivo Karilaid, PhD, is Associate Professor in Finance and Banking at Tallinn University of Technology. His interest of research is enterprise risk management (ERM) influences in financial management issues like capital and asset liability management decisions. He has published on strategy formulation, influence of money markets on the assets of financial institutions, regulation of insurance market, and performance measurement.
Tõnn Talpsepp, PhD, is Senior Research Scientist at the Chair of Finance and Banking at Tallinn University of Technology. His research is mostly connected with behavioral finance and financial markets. He has published on volatility asymmetry of financial markets, liquidity issues during crisis, investor behavior and behavioral biases.
Tarvo Vaarmets is a PhD student at Tallinn University of Technology. His research interests are connected with behavioral finance, investment decisions and the impacts of economic cycles on the financial markets. He is currently employed at the Estonian Ministry of Finance.
References
- Acharya, V. V., & Merrouche, O. (2012). Precautionary hoarding of liquidity and interbank markets: Evidence from the subprime crisis. Review of Finance, 17, 107–160. doi: 10.1093/rof/rfs022
- Baglioni, A., & Monticini, A. (2010). The intraday interest rate under a liquidity crisis: The case of August 2007. Economic Letters, 107, 198–200. doi: 10.1016/j.econlet.2010.01.023
- Bernanke, B. S. (1983). Nonmonetary effects of the financial crisis in the propagation of the great depression. American Economic Review, 73, 257–276.
- Brixiova, Z., Vartia, L., & Wörgötter, A. (2010). Capital inflows, Household debt and the boom-bust cycle in estonia. OECD Economics Department. Working Papers No. 700.
- Brunnermeier, M. K., & Pedersen, L. H. (2009). Market Liquidity and Funding Liquidity, Review of Financial Studies. Forthcoming.
- Campello, M., Graham, J. R., & Harvey, C. R. (2010). The real effects of financial constraints: Evidence from a financial crisis. Journal of Financial Economics, 97, 470–487. doi: 10.1016/j.jfineco.2010.02.009
- Cornett, M. M., McNutt, J. J., Strahan, P. E., & Tehranian, H. (2011). Liquidity risk management and credit supply in the financial crisis. Journal of Financial Economics, 101, 297–312. doi: 10.1016/j.jfineco.2011.03.001
- Cover, P. J. (1992). Asymmetric effects of positive and negative money-supply shocks. Quarterly Journal of Economics, 107(4), 1261–1282. doi: 10.2307/2118388
- Ellingsen, T. and Vlachos, J. (2009). Trade Finance in a Liquidity Crisis. Working paper.
- Gelain, P. (2011). Macro-prudential policies in a DSGE model with financial frictions. Central Bank of Norway. Working paper.
- Gordon, M. J. (1994). Finance. Aldershot, UK: Investments and Macro-Economics: The Neoclassical and Post Keynesian Solution.
- Hansen, A. H. (1953). A guide to Keynes. New York: McGraw-Hill.
- Hicks, J. R. (1937). Mr. Keynes and the classics: Suggested interpretation. Econometria, 5(2), 147–159. doi: 10.2307/1907242
- Hong Kong Monetary Authority. (2011). Loan-to-value Ratio as a Macroprudential Tool – Hong Kong SAR's Experience and Cross-Country Evidence. BIS Papers No 57, pp.163-178.
- Karilaid, I., & Talpsepp, T. (2010). Can policy improve liquidity during a financial crisis?. Baltic Journal of Economics, 10(2), 5–26. doi: 10.1080/1406099X.2010.10840476
- Kein, A. (1999). Formation of securities market in Estonia in 1990s. In Ü. Ennuste & L. Wilder (Eds.), Harmonisation with the western economics: Estonian economic developments and related conceptual and methodological frameworks (pp. 41–90). Tallinn: Estonian Institute of Economics at TTU.
- Mai, N. (2008). Lessons from the 1990s Scandinavian banking crises. London: JPMorgan Chase Bank.
- Martell, C. T., and Kravchuk, R. S. (2012). The liquidity crisis: The 2007–2009 market impacts on municipal securities. Public Administration Review, 72(5), 668–677. doi: 10.1111/j.1540-6210.2012.02564.x
- Poulsen, L. S., & Hufbauer, G. C. (2011). Foreign direct investment in times of crisis. Transnational Corporations, 20(1), 19–37.
- Purfield, C., & Rosenberg, C. B. (2010). Adjustment Under a Currency Peg: Estonia, Latvia and Lithuania During the Global Financial Crisis 2008-09. IMF Working Paper No, 10/213, September 2010.
- Reinhart, C. M., & Rogoff, K. (2009). This time is different: Eight centuries of financial folly. New Jersey, USA: Princeton University Press.
- Transition Report. (2009). EBRD Transition Report 2009: Transition in crisis? European Bank for Reconstruction and Development, November 2009.
- Ucal, M., Özcan, M. K., Bilgin, M. H., & Mungo, J. (2010). Relationship between financial crisis and foreign direct investments in developing countries using semiparametric regression approach. Journal of Business Economics and Management, 11(1), 20–33. doi: 10.3846/jbem.2010.02
Appendix 1
Correlation and cointegration matrix of Euro zone, Estonian, Latvian, Lithuanian, Finnish, Swedish, and Danish GDP, money supply (M2 or M3) and average overnight interest rates (i). Results are for the period Q1 1995 to Q2 2012. presents correlations in the lower right part of the matrix and results of cointegration tests in the upper right part of the matrix. Cointegration results are presented if either series were found to be cointegrated (+) or not (−). Marks ↑↓ indicate whether correlation has decreased or increased more or less than 5% respectively compared to calculation period of Q1 1995 to Q3 2009 or the cointegration results show a change in the cointegration: ↑ – currently cointegrated, previously (calculation period of Q1 1995 to Q3 2009) not; ↓ – currently not cointegrated, previously cointegrated).