
Abstract
This paper attempts to explain the link between corporate investments in different phases of the economic cycle and company financial distress. The data were derived from the Estonian Centre of Registers and Information Systems and contained the population of Estonian businesses from four economic activity areas – manufacturing; wholesale and retail trade; transportation and storage; and construction and real estate – and covered the period from 1995 to 2010. A firm was defined as distressed if it breached the minimum capital requirements set by law. The results demonstrate that all the investment-related factors matter for financial distress, with timing, intensity, sector, and type of investment all playing a role. Furthermore, the data seem to suggest that investment in tangibles is more cycle-sensitive for the transport and construction and real estate sectors and investment in working capital is more cycle-sensitive for manufacturing and merchandise, which stresses the importance of getting the timing right for different investment types in different industries.
1. Introduction
Corporate financial distress and bankruptcy issues have been the subject of extensive research for more than 40 years, but the complexity of the factors and influences determining the success or failure of firms constantly poses new challenges for researchers. The recent global financial turmoil in 2008–2009 again vividly stressed the importance of sound and wise management practices. The macroeconomic fluctuations and instabilities have become more pronounced than ever before, and this means that better planning and precautionary measures are called for at the micro-level for corporate planning and decision-making. Commensurate investment decisions are of central importance for firm growth, higher productivity, and improved competitiveness, as both overinvestment and underinvestment may lead to severe consequences, which in the worst case can result in company distress or failure. The rapid advancement and implementation of new technologies, the emergence of new markets, and sudden shifts in consumers’ preferences, all present new challenges for corporate investment policy. The strong swings on the demand side and on the supply side may lead to herding behaviour and overinvestment in expectation of a continued increase in demand and an improvement in productivity as new technologies are adopted. Our research aims to contribute to the conceptual strand of the literature by seeking to find the link between macroeconomic fluctuations, company investment, and eventual financial distress. Investments create negative cash flows and put company finances under pressure, and according to Taffler (Citation1983), higher volatility in cash flows leads to elevated risk of financial distress. Adding macroeconomic fluctuations into this regularity, we argue that higher investment before an economic downturn increases the probability of financial distress when the recession materializes.
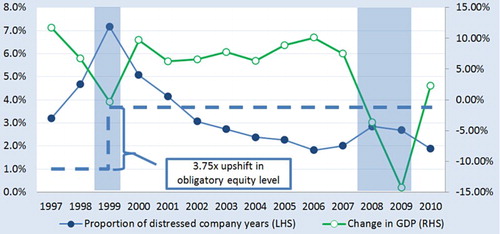
Our paper contributes in many respects. Firstly, we investigate the link between company investments and financial distress in different phases of the economic cycle, which to the best of our knowledge has not been extensively addressed before. We also conduct the estimations separately for different industries, since the various sectors have been subject to the bubble and bust patterns to a very different degree and extent. Moreover, the analysis considers the intensity of different types of investment, looking at investments in current assets and investments in tangibles. Secondly, we had a population data set that covered a long time frame of 16 years, which allowed us to investigate the distress in different sectors over two major crisis episodes in 1999 and 2008–2009 (). Furthermore, investment activity is discrete and this means the population data set gave us good hindsight into the problem, in contrast to smaller data sets, which may limit the study of rare events. Thirdly, we addressed the elasticity effects of investment-cycle interaction variables by calculating the combined effect on company distress at different investment intensity levels. We argue that this view provides novel insights.
Figure 1. Distress episodes and real GDP growth.Notes: A firm was defined as distressed if it breached the minimum capital requirements set by law. The obligatory equity level has been EUR 2.4 thousand for private limited companies and EUR 24 thousand for public limited companies since 1999; in 1995–1998, the obligatory equity levels were EUR 0.64 thousand for private limited companies and EUR 6.4 thousand for public limited companies. Two shadowed areas denote the crises of 1999 and 2008–2009. The source for real GDP growth is Statistics Estonia (Citation2013).
The results confirm that all the factors matter for financial distress, with investment cyclicality, investment intensity, type of investment, and the sector where the investment was made all playing a role.
This paper is organized as follows. The literature review and theoretical foundations are presented in Section 2. Section 3 introduces the data, describes the variables, and explains the research methodology. The results are reported and discussed in Section 4. Section 5 concludes.
2. Literature review
Company bankruptcy and financial distress have been extensively researched since the mid-1960s to make conceptual advances for the determinants, associations, and causalities between the various indicators or symptoms of financial distress and their implications for company failure. Comprehensive literature surveys have been conducted by Altman and Narayanan (Citation1997), Keasey and Watson (Citation1991), Balcaen and Ooghe (Citation2004), Aziz and Dar (Citation2006), Bellovary, Giacomino, and Akers (Citation2007), Ravi Kumar and Ravi (Citation2007), and more recently, Verikas, Kalsyte, Bacauskiene, and Gelzinis (Citation2010).
Firm investments can be divided into three types, with investments in current assets, fixed assets, and human capital. The investment intensity for the first two of these can be derived from the cash flow statement or from its predecessor the fund flow statement. The third can be a part of period costs, appearing, for example, as part of training costs, and therefore, can be less visible from standard accounts.
Three review articles – Sharma (Citation2001), Bellovary et al. (Citation2007), and Ravi Kumar and Ravi (Citation2007) – were used for locating the earlier studies that used financial ratios based on investment-related cash flow, and this resulted in three types of outcome. In the first type of outcome, statistically significant evidence has been found that higher capital expenditures one year (Aziz, Emanuel, & Lawson, Citation1988, p. 429; Aziz & Lawson, Citation1989, p. 57; Gentry, Newbold, & Whitford, Citation1985a, p. 52) and four years (Aziz et al., Citation1988, p. 429) before failure and higher investment in receivables one year (Gentry et al., Citation1985a, p. 52) before failure lower the probability of a firm going bankrupt. All three of these papers used fund flow statement information and a US data set. Secondly, there are some research papers (Gentry, Newbold, & Whitford, Citation1985b; McKee & Lensberg, Citation2002; Min & Lee, Citation2005) that included financial ratios based on investment-related cash flow in their initial battery of variables, but did not find statistically significant evidence from them. Thirdly, there are papers (McKee, Citation2003; Park & Han, Citation2002; Piramuthu, Ragavan, & Shaw, Citation1998) that focused on methodological aspects of data mining approaches and found statistically significant evidence for investment-related variables, but did not elaborate the findings further (probably because the low transparency of data mining methods somewhat restricted such elaborations).
Only a few years after Beaver's (Citation1966) and Altman's (Citation1968) pioneering studies, Johnson (Citation1970) suggested that economic conditions may have discriminating power in firm failure prediction, and many studies since then have shown that this is indeed so. Richardson, Kane, and Lobingier (Citation1998) showed that different accrual-based financial ratios can predict corporate failure, depending on the underlying and expected economic conditions. Bhattacharjee, Higson, Holly, and Kattuman (Citation2009, p. 122) showed that an increase in US output per capita lowers the probability of a UK firm going bankrupt; that uncertainty in the form of sharp increases in inflation and a sharp depreciation of the pound sterling affect freshly listed UK firms aged 0–4 years adversely; and that higher volatility in RPI inflation lowers the probability of UK firms listed for more than 25 years going bankrupt. Christidis and Gregory (Citation2010) showed that a higher log excess return over the FTSE All Share Index lowers the probability of bankruptcy.
Although the effects of investments and the economic cycle on financial distress have been addressed separately, we argue that there is a gap in the current research for explaining the link between financial distress and investments in different phases of the economic cycle.
Of the five more commonly used theoretical approaches,Footnote1 two directly address the influence of investment decisions on financial distress. These two are coalition behaviour theory (White, Citation1980) and cash flow theory (Aziz et al., Citation1988; Aziz & Lawson, Citation1989; Gentry et al., Citation1985a). However, four of the theories – cash flow theory, gamblers ruin theory, income finance theory, and option theory – take the investment decision into account indirectly through the profitability of the investment.
Our model is based on Beaver's (Citation1966) cash flow theory, which was further elaborated by Taffler (Citation1983). Beaver's cash flow theory views the firm as ‘a reservoir of liquid assets which is supplied by inflows and drained by outflows’ and states the following four ceteris paribus propositions: (I) the larger the reservoir, the smaller the probability of failure; (II) the larger the net liquid-asset flow from operations (i.e. cash flow), the smaller the probability of failure; (III) the larger the amount of debt held, the greater the probability of failure; and (IV) the larger the fund expenditures for operations, the greater the probability of failure (Citation1966, p. 80). Taffler added a fifth ceteris paribus proposition that the more highly variable the inflows, outflows, and claims on firm, the greater the probability of failure (Citation1983, p. 304).
We argue that a deteriorating economic environment increases the volatility of inflows and outflows in cycle-sensitive industries. Taking Beaver's (Citation1966) fourth proposition and Taffler's (Citation1983) fifth proposition, we argue that the larger the investment intensity (fund expenditures for operations) before the advent of weakening economic conditions (more variable inflows and outflows), the greater the probability of failure. As our research is based on cash flow theory, we also tried to find evidence for the underlying basis of cash flow theory by checking the validity of the other three propositions (Beaver's I, II, and III propositions (Citation1966)).
3. Data and methodology
The data were derived from the Estonian Centre of Registers and Information Systems and contained the population of Estonian businesses from four economic activity areas – manufacturing; wholesale and retail trade; transportation and storage; and construction and real estate – and covered the period from 1995 to 2010.
The target population contained privately owned companies in operation for at least three consecutive years, so all income statement and balance sheet data entered in the first lag, while the fund flow approach was used for cash flow variables by taking the first and second lags of balance sheet variables and the first lag of income statement variables. The fund flow approach was chosen as the data set did not contain the cash flow information from before 2005 and the aim of the research was to take data over several economic cycles.
In order to exclude the impact of outliers, the 1% lower and upper tail observations were excluded for accrual accounts-based ratios; due to the discrete nature of investment, business logic was applied for investment-related cash flow ratios, where observations showing investment or disinvestment of over 100% of the asset size were discarded as outliers. The effects of erroneous accounts and companies without economic activity were avoided by the inclusion only of those companies that had positive sales and asset levels and a balanced balance sheet.
After cuts the data set contained 133.1 thousand company-years, of which 4.1 thousand were distressed company-years. presents summary statistics for the pooled sample together with the industry-level aggregates and definitions of variables. The data set mainly contained small- and medium-sized companies with an average asset size of EUR 0.66 m.
Table 1. Summary statistics by sector.
Our target variable, the company financial distress, is defined as set out in Estonian law, so a company is defined as financially distressed if its equity level falls below the minimum obligatory equity level. Similar to Männasoo (Citation2008), our choice of definition was motivated by our interest in financial distress that is better observable, not dependent on legal procedures, and more broadly influential on the economy than bankruptcy, and also by our interest in financial distress that has a strong impact on shareholders’ equity and by the availability of the indicator for the population of Estonian businesses.
Three accrual accounts-based ratios (working capital requirement to total assets, equity ratio and return on total assets) and the size variable (Size) and the private/public company type dummy (Type) were selected to suit the cash flow theory model, which requires the inclusion of liquidity/equity buffer and inflow/outflow variables, where ‘Size’ together with equity ratio determines the equity buffer size and ‘Type’ determines the acceptable level for the equity buffer size. Although we tested several financial ratios we only included three due to their clear interpretation and absence of multicollinearity problem. Lender-related cash flow to total assets, which is a financial constraint variable, was left out due to its strong correlation with other variables and because the effect can be indirectly assessed through the equity ratio.
The overall model controls for sector fixed effects.Footnote2 The dynamic period of transition from 1995 to 2010 was controlled with period dummies (1995–1997, 1998–2000, 2001–2003, 2004–2007, and 2008–2010), since annual dummies would be collinear with the cycle dummy.Footnote3
We had 18 economic indicators in our initial variable list.Footnote4 Change in the OMX Tallinn stock index, which contains local listed companies, was included due to its good explanatory power and low correlation with other variables.
The three interacted variables were used in two different set-ups of the models to measure the importance of investment type (investment in working capital or tangibles), investment intensity, and investment timing. In the first set-up, the working capital investment intensity (dWCR_TA) and in the second set-up, the tangible asset investment intensity (dT_TA) were interacted with the GDP decline dummy (GDP-), which had the value 0 if the next year had positive GDP growth and 1 if the next year had negative GDP growth.
Both model specifications controlled for a number of other variables including company age, asset size, three accrual financial ratios (working capital requirement to total assets, equity ratio, and return on total assets), and one leading indicator (change in the OMX Tallinn stock index). The investment not interacted with the economic downturn dummy was also controlled for, so the model focusing on the interaction of tangible investments with the economic setback controlled for working capital investments and vice versa. To keep the model simple, we used an overall GDP-based cycle variable instead of a sector-level cycle variable (sector value added). We used robust and company-level clustered standard errors.
We estimated the importance of the investment intensity by first running the logit model with cycle-interacted investment variables and then calculating and plotting the combined impact at different investment levels.Footnote5 We used odds ratios instead of marginal effects to show the combined elasticity effect.
4. Results and discussion
The model specifications focusing on the interactions with the economic downturn of working capital and of tangible investments are presented in and , respectively. To give an even better picture of the combined effect of investment intensities and cyclical vulnerability, the combinations of investment and economic setback interactions were obtained for different investment levels, and the results of this are presented in and .
Figure 2. Odds ratios at different levels of investment intensity with 95% confidence intervals.
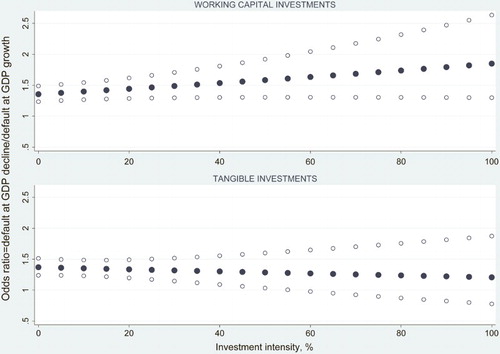
Figure 3. Odds ratios at different levels of investment intensity with 95% confidence intervals by industries.
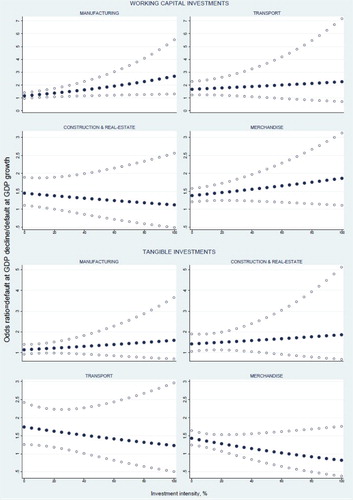
Table 2. Working capital investment intensity impact on distress.
Table 3. Tangible investment intensity impact on distress.
4.1. Evidence for the underlying basis of the cash flow theory
The estimation results for the control variables remained fairly stable across different model specifications in the pooled and industry-level samples. In order to evaluate the importance of the reservoir (Beaver's first proposition), we looked at the coefficients of the private/public company type dummy (Type), the equity ratio (E_TA), asset size (Size), working capital requirement to total assets (WCR_TA), and the period dummies, all of which had the expected signs. The public limited companies subject to higher capital requirements by law turned out to be more likely to breach the prescribed capital levels and become distressed. Higher equity-to-asset ratios and higher asset size were associated with lower probability of distress.
Period dummies decreased as expected over the period 1998–2010. Interestingly this trend is similar to the change in consumer price index (CPI) over the same period.Footnote6 Because the equity-to-asset ratio is the mirror of leverage or the debt-to-asset ratio, the other implication from the equity ratio was that lower exposure to debt reduces the company distress hazard (Beaver's third proposition). In assessing the importance of inflows to the reservoir (Beaver's second proposition), we focused on the return on asset ratio (ROA), which confirmed that higher returns imply lower distress risk. The results obtained on control variables were closely in line with the broad empirical evidence maintaining that the liquidity, leverage, and profitability ratios constitute a set of robust predictors of firm distress (see, for example, the list of predictors present in five or more studies; Bellovary et al., Citation2007, p. 42).
4.2. Sectoral variation
The estimation results for the sector and period dummies also remained fairly stable between the two different set-ups of the models. The manufacturing sector showed 26% higher statistically significant exposure to distress risk than the merchandise sector, whereas the other two sectors did not show any statistically significant difference.
4.3. Stand-alone cycle sensitivity
The estimation results for the GDP dummies come out differently for different industries. The overall effect from the downturn increased distress risk by a factor of 1.36–1.37 for all companies. The transport sector demonstrated the highest sensitivity to economic recession with distress risk rising 1.67–1.74 times, probably because Estonia is a small open economy where import and export levels are both close to 70% of GDP. The merchandise and real estate sectors showed average sensitivity to the downturn of 1.38–1.45 and manufacturing had the lowest sensitivity at 1.14–1.16. The figure for manufacturing was not statistically significant probably because of the great diversity within the sector.
4.4. Cycle sensitivity of investments
The combined effect on financial distress from investment before the economic downturn showed that distress risk increases moderately from a factor of 1.36 to 1.8 for working capital investments and decreases from 1.37 to 1.2 for tangible investments, while investment intensity increased from 0% to 100% (). As the 95% confidence interval stayed above 1 for all working capital investment intensity levels, the effect can be taken as unequivocal. In contrast, the 1 level was breached at the 55% intensity level for tangible investments making the risk-decreasing effect equivocal for higher intensities.
The combined effect for different industries () showed great heterogeneity between the sectors.
Firstly the effect on financial distress went in different directions. Increased working capital investment intensity increased the distress risk in manufacturing, transport, and the merchandise sector, whereas interestingly the effect was the opposite in the construction and real estate sectors (notice that odds ratio lines on and start from GDP- value level that are presented in and and have upward or downward trend depending whether investment downturn interaction term's odds ratio is over or below 1.0 level). This can be explained by the importance of a solid pipeline of ongoing projects for construction or of later stage developments for real estate ahead of an economic contraction, both of which are reflected in increased inventory levels. In contrast, increased tangible investment intensity had a risk-decreasing effect for transport and merchandise and a risk-increasing effect in the other two sectors. In these two cases, this might reflect investments in efficiency and new facilities, both of which can improve competitiveness and resilience towards an adverse economic environment.
Secondly, the investment intensity had varying elasticity, with the manufacturing and merchandise sectors, which hold larger inventories, showing higher elasticity in working capital investment. At the same time, the transport, manufacturing, and merchandise sectors, which have a high share of tangibles, showed higher elasticity in tangible investment.
Thirdly, the investment intensity did not show an unequivocal effect after the 20–40% working capital investment intensity level was reached in the transport and construction and real estate sectors. The unequivocal effect for tangible investment intensity disappeared in all sectors after the 45% investment intensity level was reached.
Finally, the confidence intervals decreased at moderate tangible intensity levels of 5–30% for construction and real estate and 5–25% for transport, indicating that the investments are probably made in set amounts from assets or in chunks that increase the statistical significance of these investment levels.
5. Conclusions
Our study confirms the conceptual propositions (Beaver, Citation1966; Taffler, Citation1983) and broad empirical evidence maintaining that liquidity, leverage, and profitability ratios constitute a set of robust predictors of firm distress. We elaborate the empirical model by including an economic downturn dummy variable to investigate the timing effect of investments across industries. Moreover, we consider two types of investment, looking at investments in working capital and tangible investments separately to uncover diversity in the investments structure. Our results reveal a remarkable diversity in investment types and industry sectors. The degree to which industries are exposed to distress risk varies depending on the economic environment and the type of investment made during the run-up to an economic recession.
Tangible investments seemed to improve efficiency and competitiveness in the merchandise and manufacturing sectors with no harmful effect ahead of an economic recession. The reverse was true for the transport and construction and real estate sectors, where high tangible investments during the run-up to an economic contraction significantly increased the company distress risk. In contrast to the tangible investments, overly high working capital investments endangered the viability of manufacturing and merchandise companies, where exposure to inventories is larger ahead of a deterioration in the economic environment. It appears that working capital investments, which reflect short-term planning and address current market demand, can be badly hit at times of cyclical contraction in sectors exposed to large inventories.
In general, the results demonstrate that all the investment-related factors matter for financial distress, with the timing, intensity, sector, and type of the investment that was made all playing a role. This stresses the importance of a firm making the right type of investment and choosing the right time and intensity for that investment if it is to withstand a storm in the economic climate. We are, however, aware of aggregation issues, where the deepest insight within an industry remains uncovered.
Disclosure statement
No potential conflict of interest was reported by the authors.
Funding
The authors are grateful for the financial grants PUT315 and ETF8796 provided by the Estonian Research Council. The publication of this article is also supported by the Doctoral School of Economics and Innovation created under the auspices of European Social Fund. The financing institutions, however, had no involvement in the design and implementation of the research project.
Notes on contributors
Peeter Maripuu is a Ph.D. candidate in department of finance and economics at Tallinn University of Technology. His recent research agenda relates mainly to companies' investment patterns, and their implications on companies' sustainability.
Kadri Männasoo is a Professor in the department of finance and economics at the Tallinn University of Technology. Her recent research agenda relates mainly to companies' investment patterns, including R&D investments, and their implications to long-term growth.
Notes
1. These are (1) coalition behaviour theory, (2) gamblers ruin theory, (3) option theory and credit risk theories, (4) cash flow theory, and (5) the income finance theory by Laitinen (Citation2011) and Aziz and Dar (Citation2006).
2. The merchandise sector was left as the base.
3. The period 2008–2010 was left as the base.
4. These were growth of Estonian and Swedish real GDP; average monthly short- and long-term interest rates over a year together with their first differences; yearly change in CPI and highest monthly change in CPI within a year; unemployment level together with its first difference; yearly averages of monthly export expectations of industry players together with biggest monthly change in expectations within a year; change in total retail trade level; change in new passenger car registrations; export-level growth; trade balance to GDP together with its growth level; and food CPI level.
5. The combined effect of the interacted variables was calculated using the STATA lincom procedure.
6. As the obligatory equity level remained constant in 1999–2010, the CPI change meant companies in 1999 were more at risk of breaching the obligatory equity level than companies in 2010. On average the CPI was 1.21×, 1.36×, 1.53×, and 1.95× higher in 2008–2010 than in 2004–2007, 2001–2003, 1998–2000, and 1995–1997, respectively. The estimation results for the period dummies for the same periods were 1.28, 1.40, 1.68–1.69 and 1.20–1.21 which shows that in all the periods except 1995–97 the results for the dummies are similar to the CPI trend. The peculiarity of the 1995–1997 dummy, which didn't show up as statistically significant, can be explained by the fourfold upward shift in the required equity level from 1999, when the required equity level increased from EUR 0.64 thousand to EUR 2.4 thousand for private limited companies and from EUR 6.4 thousand to EUR 24 thousand for public limited companies, and by the legislative changes after the new Commercial Code was introduced in 1995 and the economy started to shift away more vigorously from a soviet-type economy.
References
- Altman, E. I. (1968). Financial ratios, discriminant analysis and the prediction of corporate bankruptcy. Journal of Finance, 23(4), 589–609. doi: 10.1111/j.1540-6261.1968.tb00843.x
- Altman, E. I., & Narayanan, P. (1997). An international survey of business failure classification models. Financial Markets, Institutions and Instruments, 6(2), 1–57. doi: 10.1111/1468-0416.00010
- Aziz, A., & Dar, A. (2006). Predicting corporate bankruptcy: Where we stand? Corporate Governance, 6(1), 18–33. doi: 10.1108/14720700610649436
- Aziz, A., Emanuel, D. C., & Lawson, G. H. (1988). Bankruptcy prediction – an investigation of cash flow based models. Journal of Management Studies, 25(5), 419–437. doi: 10.1111/j.1467-6486.1988.tb00708.x
- Aziz, A., & Lawson, G. H. (1989). Cash flow reporting and financial distress models: Testing of hypotheses. Financial Management, 18, 55–63. doi: 10.2307/3665698
- Balcaen, S., & Ooghe, H. (2004, June). 35 years of studies on business failure: An overview of the classical statistical methodologies and their related problems (Working Paper Series, Faculteit Economie en Bedrijfskunde, Universiteit Gent. No. 04/248, pp. 1–56). Ghent.
- Beaver, W. H. (1966). Financial ratios as predictors of failure. Journal of Accounting Research, 4, 71–111. doi: 10.2307/2490171
- Bellovary, J., Giacomino, D., & Akers, M. (2007). A review of bankruptcy prediction studies: 1930 to present. Journal of Financial Education, 33, 1–42.
- Bhattacharjee, A., Higson, C., Holly, S., & Kattuman, P. (2009). Macro economic instability and business exit: Determinants of failures and acquisitions of large UK firms. Economica, 76, 108–131. doi: 10.1111/j.1468-0335.2007.00662.x
- Christidis, A. C.-Y., & Gregory, A. (2010). Some new models for financial distress prediction in the UK (University of Exeter Business School. No. 10/04, pp. 1–46). Exeter: Centre for Finance and Investment, University of Exeter Business School, Xfi.
- Gentry, J. A., Newbold, P., & Whitford, D. T. (1985a). Predicting bankruptcy: If cash flow's not the bottom line, what is? Financial Analysts Journal, 41(5), 47–56. doi: 10.2469/faj.v41.n5.47
- Gentry, J. A., Newbold, P., & Whitford, D. T. (1985b). Classifying bankrupt firms with funds flow components. Journal of Accounting Research, 23(1), 146–160. doi: 10.2307/2490911
- Johnson, C. G. (1970). Ratio analysis and the prediction of firm failure. Journal of Finance, 25, 1166–1168. doi: 10.1111/j.1540-6261.1970.tb00879.x
- Keasey, K., & Watson, R. (1991). Financial distress prediction models: A review of their usefulness. British Journal of Management, 2(2), 89–102. doi: 10.1111/j.1467-8551.1991.tb00019.x
- Laitinen, E. K. (2011). Modelling cash-flow solvency: Search for default patterns. EAA 2011 Rome.
- Männasoo, K. (2008). Patterns of firm survival in Estonia. Eastern European Economics, 46(4), 27–42. doi: 10.2753/EEE0012-8775460402
- McKee, T. E. (2003). Rough sets bankruptcy prediction models versus auditor signaling rates. Journal of Forecasting, 22, 569–586. doi: 10.1002/for.875
- McKee, T. E., & Lensberg, T. (2002). Genetic programming and rough sets: A hybrid approach to bankruptcy classification. European Journal of Operational Research, 138, 436–451. doi: 10.1016/S0377-2217(01)00130-8
- Min, J. H., & Lee, Y.-C. (2005). Bankruptcy prediction using support vector machine (SVM) with optimal choice of kernel function parameters. Expert Systems with Applications, 28, 603–614. doi: 10.1016/j.eswa.2004.12.008
- Park, C.-S., & Han, I. (2002). A case-based reasoning with the feature weights derived by analytic hierarchy process for bankruptcy prediction. Expert Systems with Applications, 23(3), 255–264. doi: 10.1016/S0957-4174(02)00045-3
- Piramuthu, S., Ragavan, H., & Shaw, M. J. (1998). Using feature construction to improve the performance of the neural networks. Management Science, 44(3), 416–430. doi: 10.1287/mnsc.44.3.416
- Ravi Kumar, P., & Ravi, V. (2007). Bankruptcy prediction in banks and firms via statistical and intelligent techniques – a review. European Journal of Operational Research, 180, 1–28. doi: 10.1016/j.ejor.2006.08.043
- Richardson, F., Kane, G., & Lobingier, P. (1998). The impact of recession on the prediction of corporate failure. Journal of Business Finance and Accounting, 25(1 & 2), 167–186. doi: 10.1111/1468-5957.00182
- Sharma, D. S. (2001). The role of cash flow information in predicting corporate failure: The state of the literature. Managerial Finance, 27(4), 3–28. doi: 10.1108/03074350110767114
- Statistics Estonia. (2013). Gross domestic product by expenditure approach. Tables: NAA1061 and NAA0061. Statistics Estonia Database. Retrieved from http://pub.stat.ee/px-web.2001/I_Databas/Economy/23National_accounts/01Gross_domestic_product_(GDP)/06Gross_domestic_product_by_expenditure_approach/06Gross_domestic_product_by_expenditure_approach.asp
- Taffler, R. (1983). The assessment of company solvency and performance using a statistical model. Accounting & Business Research, 13(52), 295–308. doi: 10.1080/00014788.1983.9729767
- Verikas, A., Kalsyte, Z., Bacauskiene, M., & Gelzinis, A. (2010). Hybrid and ensemble-based soft computing techniques in bankruptcy prediction: A survey. Soft Computing, 14, 995–1010. doi: 10.1007/s00500-009-0490-5
- White, M. (1980). Public policy toward bankruptcy: Me-first and other priority rules. Bell Journal of Economics, 11, 550–564. doi: 10.2307/3003379