
ABSTRACT
The aim of this paper is to evaluate the impact of cash social benefits on work incentives across the income distribution and among selected model family types in Lithuania. The analysis of work incentives was carried out for 2005–2013 based on a combination of measures estimated using the EUROMOD tax–benefit microsimulation model. The analysis revealed high disincentives to work at the bottom of the income distribution, dominated by the effect of cash social benefits compared to taxes or social insurance contributions. A strong trade-off between benefit adequacy and work incentives is built into the design of the national cash benefit system, particularly social assistance. The challenge for policy design is thus to encourage active labour market participation among low earners without eroding the minimum income protection floor.
1. Introduction
Taxes and benefits are powerful tools to provide monetary incentives to increase labour supply at the intensive and the extensive margin. Both positive and negative incentives to work can be built into the tax–benefit system. The aim of this paper is to evaluate the impact of taxes and benefits on work incentives across the Lithuanian income distribution and among selected model family types.
Previous studies suggest that incentives to increase working efforts for people at the middle or upper parts of the income distribution in Lithuania are higher than the EU average. According to Jara and Tumino (Citation2013) marginal effective tax rates (METR) were at around 30% both at the median and at the 75th percentile of the income distribution. This has been mainly explained by relatively low and proportional income taxation and social insurance contributions (Jara & Leventi, Citation2014; Jara & Tumino, Citation2013). However, empirical literature reports high disincentives to work at the bottom of the income distribution based on both model family calculations (e.g. Lazutka & Poviliunas, Citation2010; Lazutka, Skučienė, et al., Citation2013; Tamašauskienė, Citation2003; UNDP, Citation2010) and microsimulation techniques (Jara & Leventi, Citation2014; Jara & Tumino, Citation2013).
We identify three shortcomings of the existing research: first, it only captured the effects of social assistance (Tamašauskienė, Citation2003); second, it incorporated Lithuania into a broader comparative analysis with only a short discussion of the national case (Jara & Leventi, Citation2014; Jara & Tumino, Citation2013); finally, it was predominantly based on the model family indicators (Lazutka & Poviliunas, Citation2010; Lazutka, Skučienė, et al., Citation2013; UNDP, Citation2010). Hence, there is scope for further analysis of complementary indicators of work incentives, decomposing them to single out effects of different elements of the tax–benefit system and analysing distribution of work incentives in the actual population and among selected family types.
The analysis of work incentives in this paper is based on estimates obtained using the EUROMOD tax–benefit microsimulation model (Sutherland & Figari, Citation2013). The use of EUROMOD allows analysing work incentives across the actual income distribution. It also allows decomposing indicators by income components. Model family estimates are also used to capture work incentives among specific family types: those with inactive, unemployed or low-earner members.
The structure of this paper is as follows. Section 2 discusses the analysed measures of financial incentives to work and our estimation procedure and data. Section 3 looks at work incentives in the actual population and their changes over time. Section 4 analyses model family-based indicators of work incentives and decomposes these indicators to single out the role of different income components. Section 5 looks at changes in work incentives in the context of economic growth and decline in 2005–2013 in Lithuania. The paper concludes with a discussion of the main findings.
Several limitations of the analysis need to be acknowledged. First, only direct effects of cash social benefits are accounted for when analysing work incentives. We did not consider in-kind benefits and compensations and the value of deferred benefits implied by current social insurance contributions. Second, the analysis takes into account only work incentives of the adult working age population (i.e. age 18 up to statutory retirement age). Finally, the analysis does not capture the effects on work incentives of the most recent social assistance reform for long-term unemployed. The reform’s effect on work incentives of the long-term unemployed social assistance recipients is expected to be limited (Lazutka, Poviliūnas, et al., Citation2013). According to the latest estimates, it affected only 2% of the total number of social assistance recipients and around 4% of all the long-term social assistance recipients.Footnote1
2. Measures of the financial incentives to work
Financial incentives to work can be captured through measures that show the percentage of additional income taxed away through direct taxation, deduction of social insurance contributions or benefit withdrawal. A distinction is usually made between the incentives to work at the intensive or extensive margin of labour supply (e.g. Blundell, Bozio, & Laroque, Citation2013; Jara & Tumino, Citation2013; Myck, Domitrz, Morawski, & Semeniuk, Citation2015; Saez, Citation2002). The indicators at the intensive margin reflect the incentives to increase labour supply (hours or intensity of work on the job). Work incentives along the extensive margin relate to the decision of whether to work or not, and thus to transition between unemployment or inactivity and employment. To put it another way, the extensive and intensive margins correspond, respectively, to the employment rate and to hours when employed (Blundell et al., Citation2013).
As demonstrated by Blundell et al. (Citation2013), both margins matter in explaining changes in total labour supply and hours worked. However, the relation between work incentives at intensive and extensive margins is not linear and can be influenced by factors outside the tax–benefit system. For example, Myck et al. (Citation2015) analysed financial incentives to work in the context of complex tax–benefit reforms and wage increases in Poland. They show that despite falling tax rates work incentives at the extensive margin can be weakened as long as individuals react to disposable income level in and out of work. This forms a trade-off between tax schedule, benefit adequacy and general economic situation in the labour market. It also calls for bringing analysis of work incentives at intensive and extensive margins together, as well as for evaluation of contribution of different factors to financial work incentives.
Two broad ways of estimating work incentives can further be distinguished: through hypothetical model-type family calculations or through microsimulation applied on representative data. Model-type family estimates specify particular labour market scenarios for the chosen households. Indicators of financial work incentives can be derived for the chosen measures of gross wages (e.g. Myck et al., Citation2015). This makes the calculations and results easy to interpret. Model family-based indicators of low wage, inactivity and unemployment traps are regularly published by the OECD in partnership with the European Commission.
However, model family estimates cannot be extrapolated and are insensitive to actual distribution of income and household characteristics within the population of any particular country. The latter would only be possible using a tax–benefit model in conjunction with representative household micro-data (Carone, Immervoll, Paturot, & Salomäki, Citation2004, p. 14). Simulations of the METR across income distribution allow capturing the effects of the population structure, actual levels of earnings and interactions with the tax–benefit system (e.g. Jara & Tumino, Citation2013).
Current analysis brings together the measures of financial work incentives on an intensive and extensive margin using both representative and model family-type data. The diversity of measures allows for looking at changes in work incentives across income distribution and among particular family types. This paper does not aim to single out the pure policy effects. Instead the analysis is focused on the outcomes of taxes and cash social benefits on work incentives and their interactions within the context of reforms and economic changes in Lithuania in 2005–2013.
2.1. Estimate procedure
The estimates are carried out using the EUROMOD tax–benefit microsimulation model developed for the European Union (Sutherland & Figari, Citation2013). EUROMOD simulates monetary social transfers, direct taxes and selected social insurance contributions according to the rules in place on 30 June of each year. The labour market income and other non-simulated income sources are taken directly from the data and updated based on average growth by income source based on external statistics from administrative sources or official projections. We use the latest version of the model (version G1.0), which covers the tax–benefit systems for 2005–2013. (For more information see Sutherland and Figari (Citation2013); for information on the Lithuanian component of the model see Ivaškaitė-Tamošiūnė, Lazutka, and Salanauskaitė (Citation2014)). Importantly, the model allows using representative survey-based micro-level data, conducting model family-type calculations and decomposing total work incentives indicators by factors.
EUROMOD is a static microsimulation tool, hence no behavioural responses or general equilibrium effects to changes in tax–benefit rules are modelled. Yet static microsimulations have often been shown to shed important light on the implications of the tax and benefit system with regard to labour market incentives. It has, in particular, proven to provide a good approximation of welfare effect when changes are small (Bourguignon & Spadaro, Citation2006). Detailed analysis of financial consequences of tax and benefit rules is crucial from the point of view of understanding labour market dynamics and can drive adjustment of fiscal policies to increase labour market participation (Decoster, Perelman, Vandelannoote, Vanheukelom, & Verbist, Citation2015).
We estimate financial incentives to work using the following expression:(1) where
is the change in gross earnings of the household member.
is the corresponding change in net household disposable income after taxes, social insurance contributions and changes in benefits are calculated at the household level. The effects at both intensive and extensive margins are estimated. For the intensive margin, we estimate the METR assuming an increase in gross earnings by 3% for all employed individuals observed in the data. This increase roughly corresponds to an extra working hour per week for a full-time worker (40 hours per week). At the extensive margin we model transitions from inactivity or unemployment into employment and discrete increase in gross earnings. The transitions are modelled for selected family types as in the standard OECD/EC calculations (at 33%, 50%, 67% and 100% of the average wage) and at additional thresholds of 50% and 100% of the minimum wage. The measures stand for, correspondingly, inactivity, unemployment and low wage traps.
Similar to Jara and Tumino (Citation2013), the calculations of METR are performed using an iterative procedure: calculating total household disposable income; increasing earnings of one earner in the household at a time and recalculating household disposable income taking increased earnings into account. The procedure is repeated for every individual with earnings in the household, while the total indicator is an average of individual estimates. The calculations of inactivity, unemployment and low wage traps model labour market transitions and discrete changes in gross earnings for selected model family members.
The total indicator in Equation (1) is further decomposed to single out the effects of changes in cash benefits on work incentives following Jara and Tumino (Citation2013):(2)
where changes in the total net household disposable income are decomposed into a change in market income M and changes in benefits B, direct taxes T and social insurance contributions S all at the household level. Market income includes gross employment and self-employment income, private pensions, investment income, income from property, income of children under 16 years of age, private transfers received and maintenance payments (Ivaškaitė-Tamošiūnė et al., Citation2014). Employer social insurance contributions are not included. As the change in market income in Equation (2) equals the change in individual gross earnings, the expression can be rewritten as(3)
where the total indicator is decomposed into components due to the changes in cash social benefits B, taxes T and social insurance contributions S. Each component may further be decomposed, for example, to reflect the role of individual benefits, group of benefits or for population subgroups.
2.2. Data
Two sources of data are used for the analysis: the representative EU Survey of Income and Living Conditions (EU-SILC) and hypothetical model family data.
The EU-SILC survey has a four-year rotational panel survey design. The data is collected via face-to-face interviews of all respondents age 16 and over. Additional information on income and taxes is obtained from the State Tax Inspectorate and the State Social Insurance Fund Board. The latter procedure reduces reporting errors for taxes and benefits.
Households in Lithuania are selected from the Residents’ Register using a stratified sampling method in seven non-overlapping strata (the five largest cities, towns and rural areas) with one-stage simple random selection within strata. The minimum effective sample size for the cross-sectional EU-SILC component for Lithuania is 4000 households. The sampling frame only includes private households.
The Lithuanian EU-SILC data is high quality due to its low gap between the actual and achieved sample sizes (around 15%), low unit non-response rates (at around 11%) and low number of proxy interviews (around 15%). Moreover, the item non-response for the income components of the gross and disposable income is reported to be marginal, with the fraction of household with missing values generally not exceeding 2%.Footnote2
The indicators of the work incentives are estimated for 2005–2013 based on the EUROMOD input data collected in 2006, 2008 and 2010. To bring the policy rules and data in line, non-simulated income variables are updated by income source based on their average growth as reflected in administrative statistics or official projections (Ivaškaitė-Tamošiūnė et al., Citation2014).
The hypothetical data containing model families was generated in line with the OECD model family types. We consider six types of families:
single person, no children (I);
lone parent, one child age 4 (I + i);
lone parent, two children age 4 and 6 (I + ii);
married couple, no children (II);
married couple, one child (II + i) and
married couple, two children age 4 and 6 (II + ii).
The disposable incomes of selected family types are modelled under different assumptions concerning their labour market earnings. Either one-earner or two-earner households are assumed. For one-earner households, the second spouse is assumed to be inactive. Where receipt of benefits is subject to activity tests, these are assumed to be met.
3. Work incentives at the intensive margin across the income distribution
Our discussion starts with analysing work incentives across the Lithuanian income distribution as captured by the representative SILC data. In this section, work incentives are estimated at the intensive margin. The METR show financial work incentives resulting from a marginal increase in gross earnings by 3% for those already employed. Work incentives at the extensive margin, that is, for those unemployed or inactive and moving into employment are discussed in Section 4.
reflects the size and spread of METR in quintiles of household disposable income equivalized using the modified OECD scale. The figure shows the first and final year of the period in question.
Figure 1. Distribution of the METR by income quintile, %.
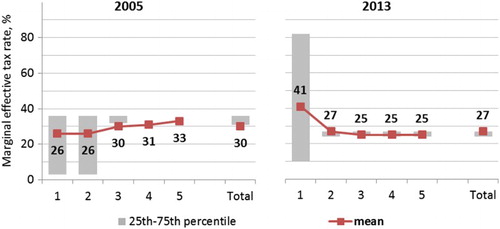
reveals several aspects of METR distribution. First, the average level of METR in 2013 is slightly below that in 2005, which highlights an improvement in work incentive averages in 2005–2013. However, although average METR decreased, they increased at the bottom of the income distribution. In effect, work incentives were strengthened for richer households and were hindered for poorer ones. This holds both looking at the mean and median METR, and their spread. The distribution of mean METR can be said to have been progressive in 2005 and have become regressive by 2013. Moreover, the spread of METR in the first disposable income quintile widened substantially from 2005 to 2013. As reported, half of the population within the first quintile faced METR of 3–36% in 2005. These boundaries changed to 10–82% in 2013. Increased levels of METR observed in the first income quintile may undermine work incentives and discourage labour market participation of poor households.
The reasons of such change are analysed by decomposing the total METR by income component (). Total METR are further decomposed in to single out effects on recipients and non-recipients of cash social assistance benefits.
Figure 2. Decomposition of mean METR by tax-benefit component and quintile, %.
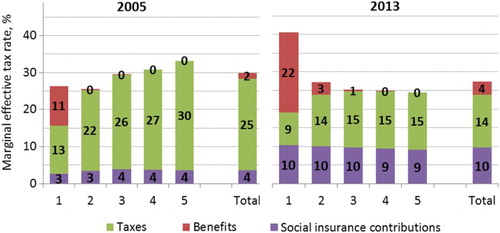
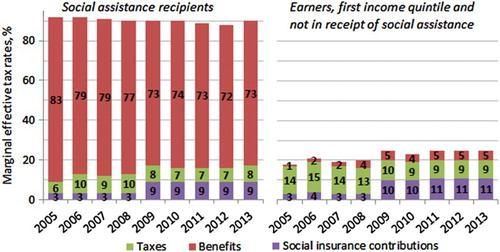
Figure 3. METR among earners in receipt and not in receipt of social assistance, %.
shows that the change of the METR distribution in 2005–2013 can be associated with changes in benefits, direct taxes and social insurance contributions. The three factors are discussed in turn.
First, there was a substantial increase in total METR caused by benefit withdrawal between 2005 and 2013. Unlike 2005, benefit withdrawal in 2013 played a major role compared to direct taxes and social insurance contributions in the lower income quintile. The increase in benefit-driven METR could be due to either introduction of additional income-tested benefits or due to the changes in levels and procedures of income testing. Indeed, there were several institutional changes in means-testing of cash social benefits within the analysed period. Changes to child benefits and to social assistance are further discussed in turn.
Child benefits have become means tested for children age 3 and up in families with one or two children since 2009. Income test levels were tightened and extended to families with three or more children in 2010 and for children under 3 in 2012. The introduction of income testing for child benefits had negative effects on work incentives for families with children. This, however, mainly affects families with income close to the income test threshold, as by design child benefits are not reduced with additionally earned income, but are rather withdrawn once the income test threshold is crossed.
Hence, the most important change in the system that might have affected a sharp increase in the benefit-driven METR was a substantial increase in the level of income test in social assistance. The level of state supported income (SSI), which is used for both income testing and determining the size of social assistance, has more than doubled within the period analysed. It increased in nominal terms from around 39 EUR in 2005 to around 102 EUR since 2008. The increase coincided with a drop in the disposable income in the population during the economic crisis since 2009. Hence, a sharp increase of individuals who qualify for social assistance, increased expenditure on social assistance and increased contribution of social assistance benefits into the total METR ().
Table 1. SSI, annual number of recipients and expenditure on cash social assistance benefits.
Importantly, this highlights a trade-off between adequacy of social assistance and its effects on work incentives. The dilemma is widely known as a traditional equity-efficiency trade-off governments face in balancing goals of poverty alleviation and work incentives in social protection (see Adam & Browne, Citation2010; Adam, Brewer, & Shephard, Citation2006; Blundell, Citation2001; Myck et al., Citation2015; Saez, Citation2002). More broadly, it is also referred to as a trilemma of equality, employment and budgetary restraint (Cantillon, Citation2011; Iversen & Wren, Citation1998). According to the argument the efforts to redistribute resources towards the poor may simultaneously put public budgets under pressure and reduce people’s incentives to work. However, effects of income support on work incentives strongly depend on the benefit rules. Strict withdrawal of cash social assistance with earned income is an example of policy design with negative impact on work incentives (Brewer, Saez, & Shepard, Citation2010) and is the case in Lithuania.
Second, the role of direct taxes on income and their interactions with cash benefits is important in regards to work incentives. Direct taxes include property, wealth and personal income taxes. Among the three, it is personal income tax that has potential first-order implications on work incentives. In Lithuania, personal income tax is calculated individually using a flat tax rate, with tax allowances for low income earners, those raising children and people with disabilities.
There were several important changes in the tax system in 2005–2013 affecting the levels and distribution of METR. Most importantly, the differential tax rate of 15% and 33% depending on income source was gradually reduced to a single rate of 15% in 2009. Moreover, a lower tax rate of 5% was introduced in 2010 on specific types of individual income. Last but not least, the general tax allowance has gradually been increased since 2005 and became progressive since 2009.
As portrayed in , the design of the personal income tax and the above-mentioned changes contributed to decreasing average METR in 2005–2013. While based on a flat tax rate, the system is slightly progressive at the bottom of income distribution due to allowances for low-income earners, families with children or people with disability. However, the positive effect of tax allowance progressivity on work incentives at the lower part of the income distribution is undone by high METR due to benefit withdrawal and an increase in social insurance contributions. This highlights a limited role of income tax reforms in improving work incentives among low income groups. It also shows the importance of interactions between systems of taxes, benefits and social insurance contributions.
Finally, we discuss the effects of social insurance contributions on work incentives. As portrayed in , the effects of employee and self-employed social insurance contributions on total METR are proportionally distributed across all income groups. This is due to their flat-rate design and the inexistence of either floors or ceilings for social insurance contributions in Lithuania, except for the self-employed. The increase in the level of the employee social insurance contributions by about 6% from 2005 to 2013 was due to a shift of deductions towards health social insurance from personal income tax to social insurance contributions in 2009. This reform had potentially negative effects on the work incentives at the bottom of the income distribution, since no deductions or allowances apply to social insurance contributions. In effect, due to combined effect of taxes and social insurance contribution METR increased in the first quintile of equivalized disposable income from around 15% in 2005 to almost 20% in 2013.
To further illustrate the role of income testing on work incentives, METR indicators are decomposed by tax–benefit element for those in receipt and not in receipt of cash social assistance ().
reveals high disincentives to work among social assistance recipients. Around 90% of extra earned gross earnings are estimated to be taxed away through the combined effects of withdrawal of cash benefits, direct taxes and social insurance contributions. As expected, withdrawal of cash social assistance is the dominant contributor to the total METR. The estimates are in line with model family-based estimates on the effects of cash benefits reported by the UNDP (Citation2010). The naïve reduction of social assistance with earned income decreases work incentives for beneficiaries. Unsurprisingly, around 80% of male and 90% of female social assistance recipients were reported not to be employed in the 2006 survey of social assistance recipients (Lazutka, Žalimienė, Skučienė, Ivaškaitė-Tamošiūnė, & Šumskienė, Citation2008). Moreover, an almost one-to-one reduction of assistance with extra income mitigates the effects of other elements of the tax–benefit system on work incentives. and demonstrated limited potential of tax reforms to increase work incentives at the bottom of the income distribution and among social assistance recipients in particular.
The total METR among the earners in the lower income quintile and not in receipt of social assistance were at substantially lower levels of around 20–25% in 2005–2013 (). The METR in this sub-group were lower compared to the rest of the population before 2009 and at similar levels thereafter. Direct taxes and social insurance contributions play a dominant role, while benefit withdrawal has a marginal effect on work incentives in this group, especially before 2009. As already mentioned, the post-2009 introduction of means-testing into the design of child benefits might have undermined work incentives for families with children.
Finally, it can be noted that while the latest estimates in the above graphs relate to 2013, there were no structural reforms in either the system of cash benefits, direct taxation or social insurance contributions in 2014 or 2015. Hence, the current distribution of METR should be comparable to the latest estimates presented in this section regarding both their levels and distribution across income groups.
4. Work incentives at the extensive margin for model families
Above, we discussed work incentives at the intensive margin, which result from a marginal increase of hours worked for those already employed. In this section, model family estimates are used to capture work incentives among specific family types: those with inactive, unemployed or low-earner members. EUROMOD-based indicators of unemployment, inactivity and low wage traps are used and decomposed to single out the effect of cash social benefits and taxes on work incentives. Higher inactivity, unemployment and low wage traps indicate potentially lower incentives to increase one’s labour supply at the extensive margin.
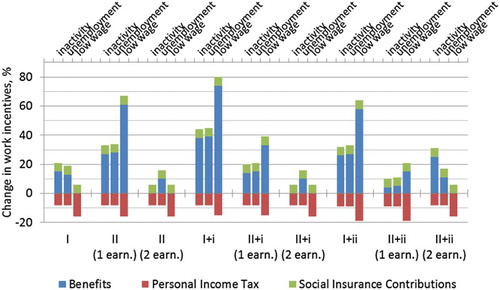
shows that among the analysed family types, single people and members of one-earner couples with or without children face high negative incentives to transition from inactivity or unemployment into employment. High disincentives to seek employment for single parents and single earner couples with children reveal interactions between the systems of unemployment benefits, social assistance and child benefits at both lower and higher income levels. The interaction is of great importance after the initial period of unemployment, as unemployment benefits decrease after 3 months and expire after 6–11 months. Two-earner married couples with or without children face unemployment traps of around 40–60%, while disincentives to seek work after periods of inactivity are substantially lower.
Table 2. Indicators of work incentives for Lithuania in 2013, % of extra gross earnings (total/due to cash benefit withdrawal).
Low wage traps are above the 50% threshold at lower wage levels among single parents and one-earner couples with children. This highlights importance of the financial motivation to work for the families with children (Blundell, Duncan, McCrae, & Meghir, Citation2000; Myck, Kurowska, & Kundera, Citation2013). Otherwise low wage trap indicators are at the levels of around 30% on average and with only a small contribution of cash benefits. This highlights low generosity of income support as most of the family types in with income above 33% of the average wage are not eligible for means-tested benefits.
Two traps are higher than virtually all other family and income situations: inactivity and unemployment traps at half of minimum wage and low wage traps for transitions between half of minimum and minimum wage. This reveals the economic unattractiveness of half-time employment in Lithuania, especially for individuals with low earning capacity, single people and people with dependent household members or children. Work incentives at the low earning levels are highly relevant within the Lithuanian context. According to Statistics Lithuania (Citation2015), around 20% of all employees in the country worked at minimum or below minimum wage in 2010–2013. The minimum wage was at around 45% of the gross average national wage in 2013, while in 2005–2013 this share was around 40% (Eurostat, Citation2015). High inactivity and unemployment traps for low earners are especially detrimental in the context of the high share of shadow economy in the country (Putniņš & Sauka, Citation2011, Citation2014). It highlights incentives for using the ‘envelop wages’ and other forms of under-reporting of earnings to avoid high effective taxation.
also shows that incentives to work tend to be greater for higher levels of earnings and lesser for households with lower earning capacity. This confirms the above analysis of distribution of the METR across income quintiles. The regressive pattern of work incentives is also in line with the previous finding on the above EU-average prevalence of high METR at the bottom of the Lithuanian income distribution (Jara & Tumino, Citation2013).
Decomposition of the total levels of inactivity, unemployment and low wage traps in reveals the dominant role of cash social benefits at creating disincentives for those not working or earning low wages in Lithuania. The phenomenon was termed ‘the glass ceiling of minimum income protection’ – a situation when disposable income of low wage earners is at the levels below or about the minimum incomes for jobless people (Cantillon, Collado, & Van Mechelen, Citation2015, p. 8). This highlights a trade-off between adequacy of cash social benefit provisions for the able-bodied working age adults and work incentives in Lithuania.
5. Changes in work incentives at the extensive margin: 2005–2013
Finally, we analyse work incentives in different family types looking at their changes over two sub-periods, 2005–2009 and 2009–2013. The first period can be noted for rapid economic growth in Lithuania that was reflected in growing levels of employment and real wages. According to Ivaškaitė-Tamošiūnė (Citation2013), this was also a ‘generosity era’ in the sphere of cash social transfers. The second period was that of economic decline and fiscal consolidation. Avram et al. (Citation2012) showed the negative effects of cuts in benefits and changes in taxes on disposable income across the Lithuanian income distribution. The effects were most profound at the bottom and top of the income distribution and for families with children. The two periods illustrate the classical trade-off between the generosity of tax–benefit systems, efficiency and budgetary restraint (Adam & Browne, Citation2010; Blundell, Citation2001; Cantillon, Citation2011; Iversen & Wren, Citation1998; Myck et al., Citation2015; Saez, Citation2002).
and demonstrate the change in combined effect of tax–benefits and earnings on work incentives. The estimates reflect the relative change in the model family indicators. We look at inactivity and unemployment traps for the transition to monthly minimum wage and at low wage traps for transition between half of minimum and minimum monthly wage. These levels of earnings were selected given the most dramatic change on work incentives noted at the bottom of the income distribution (see Section 3). Work incentives for low wage transitions are also important due to a high fraction, about 20%, of all employees earning minimum or below minimum wage in Lithuania (Statistics Lithuania, Citation2015).
shows increased inactivity, unemployment and low wage traps in the majority of family types in 2005–2009. Changes in cash benefits played the dominant role versus deductions for personal income tax and social insurance contributions. The increase in levels of cash benefits in Lithuania between 2005 and 2009 increased disincentives to work. This highlights a trade-off between the adequacy of the cash benefits and work incentives. Indeed, from 2005 to 2009 minimum wage was increased by around half in Lithuania from around 152 to 232 EUR. At the same time, SSI which is the base for estimating both social assistance and for the basic part of unemployment benefits increased rapidly in nominal terms from around 40 EUR in 2005 to around 100 EUR. The observed increase in inactivity, unemployment and low wage traps was not homogenous among groups. We observed the highest change for those with income levels close to the minimum wage and eligible for assistance and/or unemployment benefits. These were single parents with one or two children and one-earner couples.
Figure 4. Change in work incentives in 2005–2009: inactivity, unemployment and low wage traps by family type, %.
shows a different picture for 2009–2013, although the role of benefits was again dominant. Cuts in benefits in conjunction with the growing minimum wage levels widened the gap between the two, decreasing inactivity, unemployment and low wage traps in most family types. Indeed, the minimum statutory wage level was further increased by 25% to around 290 EUR in 2009–2013. At the same time, the adequacy of social cash benefits was reduced during the period, especially in light of the temporary austerity measures effective since 2010 and cash social assistance reform in 2012 (for detail see, e.g. Avram et al., Citation2012; Ivaškaitė-Tamošiūnė et al., Citation2014). Hence, the positive effect on work incentives in 2009–2013 was achieved mainly through decreased adequacy of benefits relative to minimum wages.
Figure 5. Changes in work incentives in 2009–2013: inactivity, unemployment and low wage traps by family type, %.
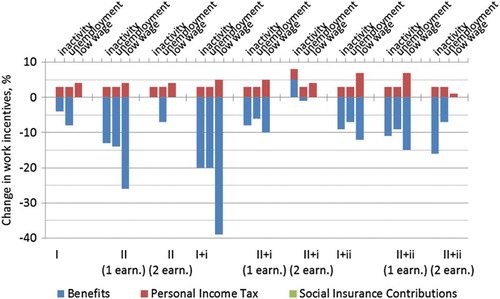
Finally, reveals that lone parents and one-earner couples were again affected most. This highlights the great sensitivity of these family types to changes in wages and cash benefits. The volatility of benefit levels with respect to the minimum wage in Lithuania reveals the ad-hoc nature of their changes due to the absence of indexation rules.
and illustrate the trade-off between adequacy and work incentives in the Lithuanian tax–benefit system. They also show pro-cyclical dynamics of cash benefits during the latest periods of economic growth and decline. reveals that an increase in benefit adequacy during economic growth had a negative impact on work incentives for individuals and families with minimum wage earning capacity. Cuts in benefits in the context of economic decline translated into improved indicators of financial work incentives (). Hence, the challenge for policy design is to ensure sufficient work incentives for low earners without eroding the minimum income protection floor.
6. Conclusions
In this paper, the impact of cash social benefits on work incentives across the Lithuanian income distribution and among selected model family types was analysed. The analysis showed that while incentives to work more are relatively high at the middle and upper part of the income distribution, they are substantially lower for people in the lower quintile of equivalized disposable income. Such a regressive work incentive profile is due to a combination of strict withdrawal of cash social benefits with income or employment, a narrow gap between in-work income and cash benefit provisions and flat tax-rate system of personal income taxation. High disincentives to work at the bottom of the income distribution are dominated by the cash social benefit effect, while the effect of taxes and social insurance contributions is limited.
Social assistance is a prime income-tested element of the system with strong negative effects on work incentives at the bottom of the Lithuanian income distribution. Total negative work incentives associated with receipt of social assistance amounted to around 90% of the extra gross earned income in 2005–2013. Naïve nearly one-to-one withdrawal of cash social assistance with additionally earned income not only undermines work incentives of its recipients. It also limits possibilities to encourage labour market participation among social assistance recipients through other components of tax–benefit system (e.g. direct taxes). This and other interactions between the elements of the tax–benefit system are important for work incentives and should not be overlooked.
Single parents and sole earners with dependent family members are subject to the highest inactivity, unemployment and low wage traps. This is especially true when earning capacity of the lone parent or sole earner is below or around minimum wage. Such families are also most sensitive to ad-hoc changes in cash social benefit levels relative to wages. The absence of indexation of cash benefits and minimum wage contributes to this volatility.
A strong trade-off was noted between the adequacy of cash social benefit provisions for able-bodied working age adults and work incentives. We demonstrated negative effects of cash benefits on work incentives when they were generously expanding in 2005–2009. The opposite was true during the period of benefit cuts caused by the recent financial crisis. The positive effect on work incentives in 2009–2013 was achieved mainly through decreased adequacy of benefits relative to the minimum wage. This highlights the importance of ensuring sufficient work incentives for low earners without compromising on the minimum income protection. The potential tools for both improving benefit adequacy and work incentives may include, for example, introduction of disregards when testing income, in-work benefits or tax credits.
Acknowledgements
The results presented here are based on EUROMOD version G1.0. EUROMOD is maintained, developed and managed by the Institute for Social and Economic Research (ISER) at the University of Essex, in collaboration with national teams from the EU member states. We are indebted to the many people who have contributed to the development of EUROMOD. The calculations in this paper are based on micro-data derived from EU Statistics on Incomes and Living Conditions (EU-SILC) made available by Eurostat under contract EU-SILC/2011/55. The results and their interpretation are the authors’ responsibility. The authors are very grateful to the anonymous referees for their insightful and detailed comments and suggestions on this paper.
Disclosure statement
No potential conflict of interest was reported by the authors.
Notes on contributors
Dr Romas Lazutka, professor at Vilnius University, teaches social policy and economics courses. Dr Lazutka is an expert of the European Social Policy Network and has been collaborating with the Lithuanian Government for the last decade. He has worked in the areas of social security and poverty reduction policy. His main research areas are public sector economics, pensions, social assistance and poverty.
Dr Jekaterina Navickė is a researcher and lecturer at Vilnius University. She has worked as a research officer at the Lithuanian Social Research Centre and at the Institute for Social and Economic Research at Essex University. Her research interests include social policy evaluation and analysis, poverty and inequality research and microsimulation analysis.
Additional information
Funding
Notes
1. According to statistics provided on request by the Lithuanian Ministry of Social Security and Labour.
2. For details, see comparative EU-SILC quality reports (http://ec.europa.eu/eurostat/web/income-and-living-conditions/quality/eu-quality-reports) and national EU-SILC quality reports for Lithuania (http://ec.europa.eu/eurostat/web/income-and-living-conditions/quality/national-quality-reports.
References
- Adam, S., Brewer, M., & Shephard, A. (2006). The poverty trade-off: Work incentives and income redistribution in Britain. Bristol: The Policy Press.
- Adam, S., & Browne, J. (2010). Redistribution, work incentives and thirty years of UK tax and benefit reform (Working Paper 10/24). London: Institute for Fiscal Studies.
- Avram, S., Figari, F., Leventi, C., Levy, H., Navicke, J., Matsaganis, … Sutherland, H. (2012). The distributional effects of fiscal consolidation in nine EU Countries (SSO Research Note No. 01/2012). Brussels: European Commission (pp. 1–43).
- Blundell, R. (2001). Welfare reform for low income workers. Oxford Economic Papers, 53(2), 189–214. doi: 10.1093/oep/53.2.189
- Blundell, R., Bozio, A., & Laroque, G. (2013). Extensive and intensive margins of labour supply: Work and working hours in the US, the UK and France. Fiscal Studies, 34(1), 1–29. doi: 0143-5671
- Blundell, R., Duncan, A., McCrae, J., & Meghir, C. (2000). The labour market impact of the working families’ tax credit. Fiscal Studies, 21, 75–104. doi: 10.1111/j.1475-5890.2000.tb00581.x
- Bourguignon, F., & Spadaro, A. (2006). Microsimulation as a tool for evaluating redistribution policies. The Journal of Economic Inequality, 4(1), 77–106. doi: 10.1007/s10888-005-9012-6
- Brewer, M., Saez, E., & Shepard, A. (2010). Means-testing and tax rates on earnings. In Adam, S., Besley, T., Blundell, R., Bond, S., Chote, R., Gammie, M., … Poterba, J. (Eds.), Dimensions of tax design: The mirrlees review (pp. 90–201). Oxford: Oxford University Press.
- Cantillon, B. (2011). The paradox of the social investment state: Growth, employment and poverty in the Lisbon era. Journal of European Social Policy, 21(5), 432–449. doi: 10.1177/0958928711418856
- Cantillon, B., Collado, D., & Van Mechelen, N. (2015). The end of decent social protection for the poor? The dynamics of low wages, minimum income packages and median household incomes (CSB Working Paper No. 15 / 01). University of Antwerp (pp. 1–32). http://improve-research.eu/?wpdmact=process&did=NzAuaG90bGluaw==
- Carone, G., Immervoll, H., Paturot, D., & Salomäki, A. (2004). Indicators of unemployment and low-wage traps // marginal effective tax rates on employment incomes. OECD Social, Employment and Migration Working Paper No. 18: DELSA/ELSA/WD/SEM, 3, 2–50. doi:10.1787/1815199x
- Decoster, A., Perelman, S., Vandelannoote, D., Vanheukelom, T., & Verbist, G. (2015). A bird’s eye view on 20 years of tax-benefit reforms in Belgium (CES Discussion paper: DPS15.07). Leuven: KU Leuven CES.
- Eurostat. (2015). Annual gross earnings [earn_nt_net]; averaged bi-annual data on monthly minimum wages [earn_mw_cur]. Retrieved April 15, 2015, from ec.europa.eu/eurostat/data/database
- Ivaškaitė-Tamošiūnė, V. (2013). Pajamų perskirstymas formuojantis gerovės kapitalizmui Lietuvoje [Income redistribution in emerging welfare capitalism in Lithuania] (Doctoral dissertation). Vilnius University, Vilnius.
- Ivaškaitė-Tamošiūnė, V., Lazutka, R., & Salanauskaitė, L. (2014). EUROMOD country report: Lithuania (LT) 2009–2013. Colchester: ISER.
- Iversen, T., & Wren, A. (1998). Equality, employment, and budgetary restraint: The trilemma of the service economy. World Politics, 50(4), 507–546. doi: 10.1017/S0043887100007358
- Jara, H. X., & Leventi, C. (2014). Baseline results from the EU27 EUROMOD (2009–2013) (EUROMOD Working Paper Series No. EM18/14–17). Retrieved May 2, 2015, from iser.essex.ac.uk/research/publications/working-papers/euromod/em18–14
- Jara, H. X., Tumino, A. (2013). Tax-benefit systems, income distribution and work incentives in the European Union. International Journal of Microsimulation, 6(1), 27–62.
- Lazutka, R., & Poviliunas, A. (2010). Lithuania: In-work poverty and labour market segmentation. A study of national policies. Vilnius: Vilnius University.
- Lazutka, R., Poviliūnas, A., Savičiūtė, D., Skučienė, D., Žalimienė, L., & Etnerytė, I. (2013). Piniginės socialinės paramos nepasiturintiems gyventojams teikimo, vykdant savarankiškąją savivaldybių funckiją, perspektyvos [Perspectives of cash social assistance for the poor implemented through the independent municipality function]. Vilnius: LSTC.
- Lazutka, R., Skučienė, D., Černiauskas, G., Bartkus, A., Navickė, J., & Junevičienė, J. (2013). Socialinis draudimas Lietuvoje: kontekstas, raida, rezultatai [Social insurance in Lithuania: context, development, results]. Vilnius: LSTC.
- Lazutka, R., Žalimienė, L., Skučienė, D., Ivaškaitė-Tamošiūnė, V., & Šumskienė, L. (2008). Socialinė parama Lietuvoje: remiamųjų padėtis ir paramos rezultatai [Social assistance in Lithuania: Situation of assistance recipients and assistance results]. Vilnius: LR Socialinės apsaugos ir darbo miniterija, Socialinių tyrimų institutas.
- Myck, M., Domitrz, A., Morawski, L., & Semeniuk, A. (2015). Financial incentives to work in the context of a complex reform package and growing wages: The Polish experience 2005–201. Baltic Journal of Economics, 15(2), 99–121. doi:10.1080/1406099X.2015.1124227
- Myck, M., Kurowska, A., & Kundera, M. (2013). Financial support for families with children and its trade-offs: Balancing redistribution and parental work incentives. Baltic Journal of Economics, 13(2), 61–85. doi: 10.1080/1406099X.2013.10840533
- Putniņš, T., & Sauka, A. (2011). Size and determinants of shadow economies in the Baltic States. Baltic Journal of Economics, 11(2), 5–25. doi: 10.1080/1406099X.2011.10840498
- Putniņš, T. J., & Sauka, A. (2014). SSE Riga shadow index for the Baltic countries 2009–2013. Riga: SSE Riga.
- Saez, E. (2002). Optimal income transfer programs: Intensive versus extensive labor supply responses. Quarterly Journal of Economics, 117, 1039–1073. doi: 10.1162/003355302760193959
- Statistics Lithuania. (2015). Structure of employees by wage levels: Full and part-time employees at minimum monthly wage and below, % of all employees including individual firms. Database of Indicators. Retrieved August 26, 2015, from http://osp.stat.gov.lt/en/statistiniu-rodikliu-analize1
- Sutherland, H., & Figari, F. (2013). EUROMOD: The European Union tax-benefit microsimulation model. International Journal of Microsimulation, 6(1), 4–26.
- Tamašauskienė, Z. (2003). Piniginė socialinė parama Šiaulių mieste ir jos tobulinimas [Cash social assistance in Šiauliai and its development]. Ekonomika ir vadyba: aktualijos ir perspektyvos, 2, 205–210.
- UNDP. (2010). Darbo paskatų ir priklausomybės nuo paramos priešpastatymo analize pagrįstos rekomendacijos: dėl trumpalaikių politikos priemonių, skirtų Lietuvos socialinės paramos sistemos reformai [Recommendations based on analysis of work incentives and welfare dependency: On short-term policy mechanisms for reforming social assistance in Lithuania]. Vilnius: Jungtinių Tautų vystymo programa (JTVP) Lietuvoje, LR socialinės apsaugos ir darbo ministerija.