
ABSTRACT
The Baltic Sea states and the European Commission initiated the intergovernmental Baltic Sea Energy Cooperation (BASREC) in 1998 and established it the following year. The aim of this study is to examine and compare the energy productivity change, energy technical change, and energy efficiency change in Baltic Sea states and non-Baltic Sea states using the Malmquist-DEA approach. The main results indicate that energy productivity in the Baltic Sea states has been improved, with this mainly caused by energy technology progression; however, the improvement in energy efficiency is not so obvious. In addition, the subsample includes 10 former communist countries, showing that the source of their energy productivity change not only comes from energy technical change, but also energy efficiency changes. In other words, the catching up effect in the 10 former communist countries is more obvious than that in the Baltic Sea states.
1. Introduction
The Baltic Sea states are endowed with an abundant amount of natural resources, such as hydro-electrical power in Norway, Finland, and Sweden, thermo-energy in Iceland, and crude oil and natural gas in Norway. In order to develop new renewable energy, reduce the use of non-renewable energy, and create sustainable energy development, energy cooperation is the key issue in the Baltic Sea region. In 1998 the Baltic Sea countries and the European Commission initiated the intergovernmental Baltic Sea Energy Cooperation (BASREC), with one of the main objectives being to promote energy efficiency and establish well-functioning energy markets. Established in 1999, BASREC pursues energy efficiency by developing and using energy-efficient technologies in order to ensure sustained economic growth. This cooperation includes the 11 independent countries around the Baltic Sea (Denmark, Estonia, Finland, Germany, Iceland, Latvia, Lithuania, Norway, Poland, Russia, and Sweden) and the European Commission (Streimikiene, Citation2007). However, only 8 of these 11 independent countries (excluding Iceland, Norway, and Russia) are also European Union (EU) members. The purpose of the energy cooperation among the countries around the Baltic Sea is to contribute to the stability, growth, and development of the region.
The Baltic Sea states have already implemented all EU directives to enhance energy efficiency and to use renewable energy sources (Streimikiene & Klevas, Citation2007), showing that EU policy plays a major role in BASREC activities. The main concern of the EU energy policy is the security of energy supply. In November 2000 the European Commission issued a Green Paper, but replaced this with a new Green Paper on 8 March 2006. The new Green Paper believes that controlling energy demand growth and the security of energy supply can be achieved by improving energy efficiency. Energy technology change may give rise to an improvement in energy efficiency and achieve the security of energy supply.
presents the 27 EU members, with all the EU countries being hereafter defined as the EU-27. It is noted that the last EU member is Croatia, which joined in 2010. Hence, the current total of EU members is 28. Because this study’s data cover the period from 1995 to 2010, Croatia is not included in the study sample. Of these 27 EU members, 8 of them located around the Baltic Sea are referred to as the Baltic Sea states, and the others are referred to as non-Baltic Sea states. Since the total number of non-Baltic Sea states in the EU is 19, we hereafter refer to the non-Baltic Sea states in the EU as the EU-19.
Figure 1. EU members: Baltic Sea and non-Baltic Sea states.
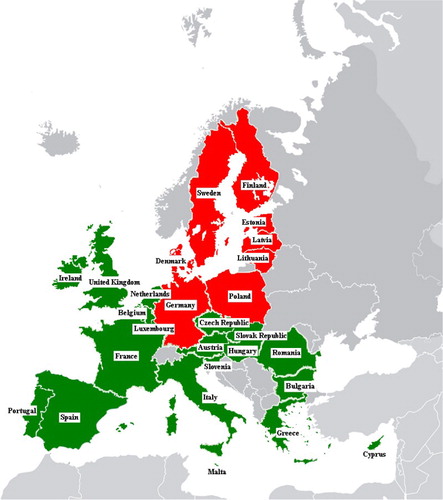
In order to measure and access the impact of the Baltic Sea states, we compare one set of countries that is made up of all EU countries including the eight Baltic Sea states (EU-27) with another set of EU countries that excludes the eight Baltic Sea states (EU-19). In this paper, we use the input-oriented Malmquist Data Envelopment Analysis (Malmquist-DEA) model to evaluate the energy productivity change (EPC), energy technical change (ETC), and energy efficiency change (EEC) in the Baltic Sea states by comparing the EU-27 set of countries with the EU-19 set of countries. Based on the fundamental framework of the Malmquist-DEA model, we take real GDP as the output factor and real capital stock, labour employment, and energy consumption as the input factors. In order to eliminate the distortion in non-energy inputs, we fix two non-energy inputs at the optimal level to discuss the energy productivity change, energy technical change, and energy efficiency change.
Some articles apply indicators selected from the list of Energy Indicators for Sustainable Development (EISD) to monitor the progress of sustainable energy development toward its achievement. These indicators have been developed and published by international energy and environmental institutions such as the IAEA, UNDESA, IEA, EEA, and Eurostat (IAEA, Citation2005). Some typically used energy indicators include total primary energy supply (TPES) per capita, TPES per unit of GDP, final energy consumption (FEC) per unit of TPES, the share of renewable energy sources (RES) in TPES, and the share of RES in gross electricity consumption (Streimikiene, Citation2007). Klevas and Minkstimas (Citation2004) used energy-economic indicators such as TPES/GDP and Net Imports of Energy Resources/GDP to analyse the problem that links the energy sector to macroeconomic development in Lithuania. They proposed guidelines for a long-term state energy efficiency policy in Lithuania and indicated that the energy-economic problem exists not only in Lithuania, but also in most Central and Eastern European countries. Klevas and Antinucci (Citation2004) also applied the method of an energy indicator to examine the integration of national and regional energy development programmes in Lithuania, Latvia, and Estonia. They referred to government efforts in these three countries to re-structure, liberalize, and privatize their energy markets, but made it clear that there is still a long way to go by observing the situation in regions and towns with regard to energy planning. Streimikiene and Klevas (Citation2007) implemented a number of energy indicators to review the situation regarding the implementation of renewable energy projects in Lithuania, Latvia, and Estonia by using EU Structural Funds. Streimikiene (Citation2007) monitored energy supply sustainability in Baltic Sea countries by means of certain energy indicators and suggested that Baltic Sea states should pay more attention to particular issues, including energy intensity, the security of supply by means of promoting renewable energy sources, energy efficiency improvements, and energy affordability in transition economies.
The DEA approach is a useful tool to measure the relative efficiency of decision-making units (DMUs) by expressing the production relationship between inputs and outputs in order for a decision-maker to consider how an inefficient DMU can be improved. The input-oriented DEA model is suitable for when the decision-maker emphasizes the efficiency in an input factor; on the contrary, if the efficiency of the output factor is emphasized, then it is suitable to use the output-oriented DEA model. However, the DEA approach is a static method that estimates the DMU’s performance at a specific time instead of estimating the efficiency change over time. Hence, the Malmquist productivity index (MPI), which is a dynamic DEA model, was developed to estimate productivity change by time. The function of MPI is to interpret the reason for a productivity change that results in either technical change or efficiency change. In geometry, technical change means the change in the frontier. If the frontier moves forward, then the DMU exhibits technology progression; if the frontier moves backward, then the DMU faces technology regression. Efficiency change means that the DMU’s location is forward to the frontier or backward to the frontier. The former stands for the catching up effect and the latter stands for the fall behind effect. The Malmquist-DEA approach in this paper, which is MPI based on the input-oriented DEA model, has been applied to express energy productivity change over time. A critical point that should be mentioned is that the energy efficiency estimation by Hu and Wang (Citation2006) is very different from this paper. Theirs is a static energy efficiency estimation by using the DEA model, while this study employs a dynamic energy efficiency estimation by means of the Malmquist-DEA approach.
Capital stock and labour are conventional production factors. In the past, researchers did not realize that energy was also a critical production factor until climate change and the greenhouse effect became more and more serious. Some international energy and environmental institutions have developed and published energy indicators to measure and assess the effects of energy use on the economy and the environment. However, these energy indicators disregard the substitution among energy use and other production factors such as capital stock and labour employment. The measurement and estimation of energy use by means of partial-factor energy productivity may be the cause of misleading estimates. The Malmquist-DEA approach adopted in this paper is based on the total-factor framework that evaluates the energy productivity change which can be decomposed into energy technical change and energy efficiency change. Hu and Wang (Citation2006) in a seminal article used the DEA approach to analyse the issue of energy efficiency. They proposed the total-factor energy efficiency (TFEE) index to estimate the aggregate energy intensity. According to a survey by Chang (Citation2013), the TFEE index has been cited 183 times based on the results of Google Scholar. Some related articles include Hu and Kao (Citation2007), Han, Fan, Jiao, Yan, and Wei (Citation2007), Honma and Hu (Citation2008), Honma and Hu (Citation2009), Chang and Hu (Citation2010), Zhang, Cheng, Yuan, and Gao (Citation2011), and Chang (Citation2013). Hence, the Malmquist-DEA approach on the evaluation of energy productivity change, energy technical change, and energy efficiency change has been applied in a valid manner. In addition, Wei, Liao, and Fan (Citation2007) used the Malmquist-DEA approach to investigate the energy productivity change of China’s iron and steel sector, and they then decomposed energy productivity change into energy technical change (the production frontier shifting effect) and energy efficiency change (the catching up effect) to further analyse the reason for the energy productivity change. All the input factors in their paper are energy factors: (i) fuel oil, natural gas, electricity; (ii) coal; and (iii) coke. Shi, Bi, and Wang (Citation2010) argued that only the energy input is unable to produce any output during the process of production. Hence, other inputs together with energy should be considered when measuring energy efficiency.
The results of the research in this article show that there has been an outstanding performance in terms of energy productivity change and energy technical change in the Baltic Sea states. These findings indicate that energy productivity in the Baltic Sea states has improved, and this improvement has been caused by the progression of energy technology. However, the energy efficiency change in the Baltic Sea states is not so obvious. In other words, the production frontier in the Baltic Sea states has undergone a large upward shift, but the cluster effect in these Baltic Sea states is not distinct. In addition, this study also discusses the energy productivity of the 10 former communist countries in the EU. The result shows that the contributions of their energy productivity progress are from energy technical improvement and energy efficiency promotion. It also implies that there is a more obvious catching up effect in the 10 former communist countries than in the Baltic Sea states. The remainder of this paper is organized as follows. Section 2 describes the methodology used, Section 3 presents the empirical results, and Section 4 concludes with a summary of the empirical results.
2. Methodology
The DEA methodology is applied to estimate the energy productivity change in Baltic Sea and non-Baltic Sea states. The DEA approach is related to not only the production theory in economics, but also operations management. The most efficient DMUs in the DEA approach form a best-practice frontier that is an improvement target for the other ineffective DMUs. Expecting the DEA literature to grow fast, Liu, Lu, Lu, and Lin (Citation2013) focused on a citation-based DEA survey that is extensively applied to economics and management fields. Hence, Cook, Tone, and Zhu (Citation2014) offered some advice and opinions on a prior choosing the DEA model. In this section we introduce the basic input-oriented DEA-CCR model, originally proposed by Charnes, Cooper, and Rhodes (Citation1978), and then use the DEA-CCR model to calculate the optimal input level. We also introduce the MPI to examine the energy productivity change that can be decomposed into energy technical change and energy efficiency change.
The reasons this study applies the DEA-CCR model and the MPI are based on three main advantages to this approach: (i) they do not require any prior assumption on the function relationship between inputs and outputs (Seiford & Thrall, Citation1990); (ii) they allow the decision-maker to simultaneously consider multiple output and input factors; and (iii) they provide an easy idea on how to push inefficient DMUs towards being efficient DMUs by radial adjustment. In addition, this study extends a static energy efficiency idea based on the DEA-CCR model proposed by Hu and Wang (Citation2006) to a dynamic energy efficiency estimation. Hence, the DEA-CCR model is the methodology basis of this paper.
2.1. The DEA-CCR models
DEA is a non-parametric mathematical programming approach used to compare the performance of DMUs in a set. Farrell (Citation1957) was the first study to calculate a firm’s efficiency using two components: overall technical efficiency and allocation efficiency. There are two basic DEA models: one is the DEA-CCR model invented by Charnes et al. (Citation1978), and the other one is the DEA-BCC model proposed by Banker, Charnes, and Cooper (Citation1984). The former is established on the assumption of constant returns to scale (CRS), while the latter is extended from the DEA-CCR model and is established on the assumption of variable returns to scale. We introduce the DEA-CCR model as follows:subject to
(1) where λ is the efficiency score of the ith DMU and i = 1, … , n; η is an n × 1 vector of constants; xi, yi, and ei are s × 1, t × 1, and u × 1 vectors of the non-energy input, output, and energy input of the ith DMU, respectively; and X, Y, and E are s × n, t × n, and u × n matrices of the non-energy input, output, and energy input of all DMUs, respectively. Equation (1) is a well-known input-oriented CRS DEA-CCR model.
In the process of production, a non-renewable resource such as coal or oil and so forth is one of the input factors. Based on the idea of efficiency, we reduce the consumption of energy for a given output as much as possible in order to examine energy efficiency. Banker and Morey (Citation1986) used the input-oriented DEA method to evaluate efficiency, and fixed non-energy inputs for comparing the situation of the energy input. In order to eliminate the distortion of non-energy inputs, we fix non-energy inputs at the optimal level and then examine energy use in the Baltic Sea states by using the MPI approach.
2.2. MPI approach for estimating energy productivity change
MPI is a productivity measure originally proposed by Malmquist (Citation1953) and used to measure the DMU’s productivity change that can be decomposed into technical change and efficiency change. The technical change causes the production frontier to shift, and the efficiency change refers to the non-best practice firms getting closer to or farther away from the best frontier. Therefore, the efficiency change is also viewed as the catching up effect or the falling back effect. Färe, Grosskopf, Norris, and Zhang (Citation1994) and Färe and Grosskopf (Citation1996) further developed and popularized MPI as a dynamic DEA.
We introduce the methodology underlying the MPI approach as follows. The production possibility set in period j is:(2) where X* is an s × n matrix of non-energy inputs at the optimal input level. The target whereby we fix the non-energy input at the optimal level is to eliminate the distortion caused by the non-energy input and then to evaluate the energy productivity change. We next define four distance functions as:
(3a)
(3b)
(3c)
(3d)
Equations (3a) and (3b) indicate that the distances from an observation to the frontier in periods j and j + 1 are respectively Dj and Dj+1, where Dj and Dj+1 are defined as the reciprocal of the maximum proportional reduction in the energy inputs Ej and Ej+1 given outputs Yj, such that Dj ≥ 1, and Dj+1 ≥ 1. Moreover, Dj = 1 or Dj+1 = 1 indicates that (, Ej; Yj) or (
, Ej+1; Yj+1) is on the frontier, which stands for full energy efficiency in the sense that a reduction in energy inputs will cause the outputs to decrease. Equations (3c) and (3d) indicate that the maximum proportional reduction in the energy inputs Dj and Dj+1 requires that (
, Ej+1; Yj+1) and (
, Ej; Yj) be feasible in relation to the technology in periods j and j + 1.
Based on Equation (3), the energy productivity change (EPC) index in period j + 1 is(4) Here, EPCj+1 measures the relative energy productivity change between periods j and j + 1. The value of EPCj+1 could be less than, equal to, or greater than unity and represents energy productivity regress, no change, or progress between two periods. ETCj+1 measures the energy technical change. The value of ETCj+1 is less than, equal to, or greater than unity and stands for energy technical regress, no change, or progress. EECj+1 measures the energy efficiency change relative to the best-practice observations. The value of EECj+1 could be greater than, equal to, or less than unity and respectively represents that the DMU’s location is getting closer to, has no change in relation to, or getting farther from the best-practice frontier when comparing years j + 1 and j. In other words, the value of EECj+1 can be used to describe the change in distance that is between the DMU’s location and the best-practice frontier. If the distance shrinks (extends), then the DMU has a positive (negative) energy efficiency change; if the distance shows no change, then the DMU’s energy efficiency is the same as last year.
3. Empirical study
3.1. Data description
The dataset includes one output (i.e. real GDP based on the price level in 2005), two non-energy inputs (i.e. real capital stock and labour employment), and one energy input (i.e. energy use with the calculation unit as kt of oil equivalent). The data period extends from 1995 to 2010. All data used for analysis in this study come from the World Data Bank published by the World Bank. This database is open data, and the website includes over 35 databases providing data from the 1960s up to the present. The most popular databases include the world development indicators and global development finance, which are the main data sources of this paper, gender statistics, health nutrition and population statistics, and education statistics. shows the correlation coefficients between the input and output variables in which positive correlation coefficients indicate that the input and output variables satisfy the principle of isotonicity in the DEA approach. Because the relationship between inputs and outputs in DEA should not be erratic, DEA requires that greater quantities of inputs should cause an increase in the quantity of at least one output. The positive correlation coefficients for all the input and output variables in this paper mean that greater inputs provide increased outputs.
Table 1. Correlation coefficient matrix.
The optimal amount of the real capital stock and labour employment can be obtained by means of calculation using the DEA-CCR model in Equation (1). Given the optimal amount of non-energy inputs, the paper next uses the energy productivity change index in Equation (4) to compute the energy productivity change. Since energy productivity change can be decomposed into two effects, that is, energy technical change and energy efficiency change, these two effects are also the sources of energy productivity change. To be clearer, if the DMU has a progression or a regression on energy productivity, then this paper can further investigate the source of energy productivity change resulting in energy technical change or energy efficiency change or both. Energy technical change can be represented to the frontier shift in which the shift forward (backward) means energy technical improvement (deterioration), and energy efficiency change can be represented to the DMU’s location being close to the frontier or far from the frontier. If the DMU’s location is close to (far from) the frontier, then there is not only energy efficiency improvement (deterioration), but also a catching up (fall behind) effect.
3.2. Energy productivity change
Given that the value of energy productivity change in period 1 is 1, that is, EPC1 = 1, we can obtain the value of accumulative energy productivity change (AEPC) in period n by calculating AEPCn = EPC1
(see Wei et al., Citation2007). indicates that the trend in accumulative energy productivity change in the EU-27 countries is always superior to that in the EU-19 countries and both of their values of accumulative energy productivity change are more than 1 in 2009 and 2010. This result shows that the values for the accumulative energy productivity change in the Baltic Sea states influence the values for the accumulative energy productivity change in the EU-27 countries. This conclusion can be confirmed from where the values for the accumulative energy productivity change in eight of the Baltic Sea states are larger than 1, which implies that the energy productivity in all Baltic Sea states has improved between 1995 and 2010. It has risen the quickest, or by more than 40%, in Estonia and Poland. However, for the EU-19 states, only Austria, Bulgaria, and Romania did not see an improvement in energy productivity. The EU’s energy policy plays a major role in BASREC’s main objectives of promoting sustainable growth, energy efficiency, and renewable energy measures by developing and using new, low-carbon and energy-efficient technologies. It is clear from the results for the energy productivity change in the Baltic Sea states that EU directives do in fact push the promotion of their energy productivity improvement.
Figure 2. The trend of accumulative energy productivity change in the EU-19 and EU-27 countries.
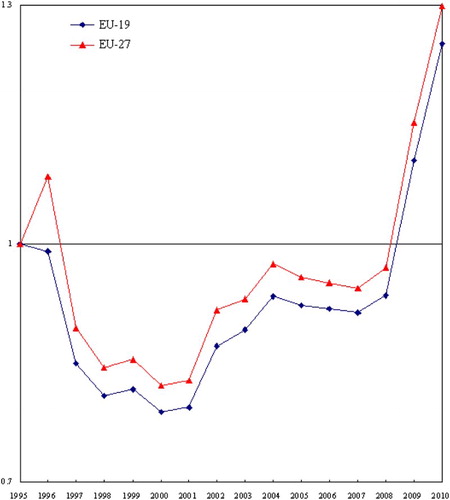
Table 2. Energy productivity change in the EU-19 and EU-27 countries over the 1995–2010 period.
The international organization BASREC has resulted in the relationship between Baltic Sea states and the EU becoming closer, such that energy policies in Baltic Sea states are driven by EU requirements. Scarlat, Dallemand, Monforti-Ferrario, Banja, and Motola (Citation2015) reviewed the EU’s renewable energy policy and indicated that Directive 2001/77/EC required 21% of total electricity to come from renewable sources by 2010, Directive 2003/30/EC required that 5.75% of all petrol and diesel used in transport to be replaced by bio-fuels and other renewable fuels by 2010, and Directive 2009/28/EC is to increase the share of renewable energy to 20% in FEC and to 10% renewable energy in transport by 2020. Roos, Soosaar, Volkova, and Streimikene (Citation2012) indicated that the Baltic Sea countries had followed and implemented the EU’s energy policy. Based on the Directives above, renewable energy has replaced traditional energy step by step in the EU, including the Baltic Sea countries. Hence, these directives help promote energy productivity, energy technology, and energy efficiency in each EU member.
Baltic Sea states have ambitious targets for the share of renewable energy sources in electricity production – for example, the national energy policy in Lithuania set targets for the renewable energy sources share of TPES to reach 12% by 2010 (Lithuanian Ministry of Economy, Citation2002). Directive 2002/91/EC requires energy use savings of around 22% by 2010 for buildings with air conditioning, heating, hot water, and lighting. Using renewable energy sources such as solar collectors for hot water and heating also helps achieve the requirement of Directive 2002/91/EC. Directive 2003/30/EC promotes bio-fuels or renewable fuels in transport, requiring member states (including Baltic Sea states) to hit a 5.75% share of bio-fuels used among the total amount of fuels for transport in 2010 and moving to 20% in 2020 (Ministry of Economic Affairs and Communications of Republic of Estonia, Citation2003). Directive 2004/8/EC is for developing high efficiency cogeneration of heat and power (CHP). Such CHP development in Baltic Sea states helps achieve their main energy policy priorities – decreasing energy intensity, mitigating climate change, and realizing energy supply security.
3.3. Energy technical change
According to Equation (4), energy productivity change can be decomposed into energy technical change and energy efficiency change. The information from the energy productivity change shows that that the accumulative energy productivity change in most EU countries including all the Baltic Sea states has been improved. The paper next investigates that the energy productivity change is caused by energy technical change, energy efficiency change, or both.
Energy technical progression (regression) refers to an upward (downward) shift in the production frontier (Coelli, Rao, O’Donnell, & Battese, Citation2005). Technology progression is also a production frontier shifting effect caused by a technological innovation. For example, a DMU can be affected by the introduction of a new energy-saving blast furnace which when installed extends the energy efficiency potential beyond previous limits. Several government policies also result in energy technical innovation by providing venture capital or R&D subsidies to energy technology innovation firms. Noailly and Smeets (Citation2015) pointed out that an energy innovation policy should focus on small firms in the long run.
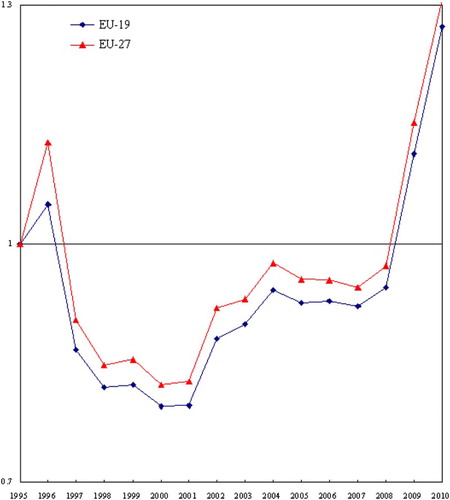
Given that the value of energy technical change in period 1 is 1, that is, ETC1 = 1, we can obtain the value of the accumulative energy technical change (AETC) in period n by AETCn = ETC1
(see Wei et al., Citation2007). represents the energy technical change in the EU-19 and EU-27 countries. The values of the accumulative energy technical change in Cyprus, Estonia, Hungary, Ireland, Poland, the Slovak Republic, and the United Kingdom increased the most to more than 50%. It is well known that Germany represents the outstanding model for environment and energy. Its values of accumulative energy productivity change and accumulative energy technical change are ranked last in this paper (AEPC and AETC are both 1.095). In other words, it is very difficult for Germany to improve, because it is so efficient already.
Table 3. Energy technical change in the EU-19 and EU-27 countries over the 1995–2010 period.
In the values of accumulative energy technical change for all Baltic Sea states are larger than 1, which indicates that the energy technical frontier improves for all Baltic Sea states. The most improved state is Estonia whose AETC2010 = 1.451, while the least improved state is Denmark whose AETC2010 = 1.022. Moreover, the values of accumulative energy technical change in Baltic Sea states in 2009 and 2010 exhibit a large jump. The result may be caused by Baltic Sea states having a budget framework for carrying out BASREC projects during the three-year 2009–2011 period. Each BASREC project is assigned a lead country, which has responsibility for the realization of the project. For instance, Germany is a project leader for ‘Energy Policy Strategies of the Baltic Sea Region for the Post-Kyoto Period’, Denmark and Lithuania are project leaders for the ‘Baltic Rotating Energy Planning Academy’, and Sweden is a project leader for the ‘Analysis of Conditions for the Deployment of Wind Power in the Baltic Sea Region’.
indicates that the trend in accumulative energy technical change in the EU-27 countries has always been superior to that in the EU-19 countries. The critical year for the trends in accumulative energy technical change in both the EU-19 and EU-27 countries is 2000. Before 2000, the trend of accumulative energy technical change was decreasing; but its trend by contrast increased after 2000. The promotion of energy technology can result in energy savings by reducing the demand for energy. Examples of improvements in technology are the reduction in heat loss in buildings, more efficient energy consuming equipment, energy-efficient industrial technologies, model changes in transportation, etc. (Lithuanian Ministry of Economy, Citation2001). Štreimikienė (Citation2016) concluded that the EU Structural Funds have resulted in an increase in energy productivity in Baltic Sea states where the biggest progress in energy productivity development has been Lithuania since 2004, the best result for increasing the share of wind renewable power in electricity generation is Estonia, and the highest share of renewable power in electricity generation is Latvia. The energy innovation policy in the EU through the EU Structural Funds has bought forth energy technology innovation, which has also resulted in energy technical improvement in the Baltic Sea states.
Figure 3. The trend of accumulative energy technical change in the EU-19 and EU-27 countries.
3.4. Energy efficiency change
In the DEA model, energy efficiency refers to how much closer a DMU can move to the production frontier. An improvement in energy efficiency implies a catching up effect that reflects a convergence toward the best-practice frontier. Conversely, a deterioration in energy efficiency implies a falling back effect that reflects a divergence from the best-practice frontier. The change in energy efficiency is used to compare the DMUs’ efforts or performances in terms of improvement in energy efficiency.
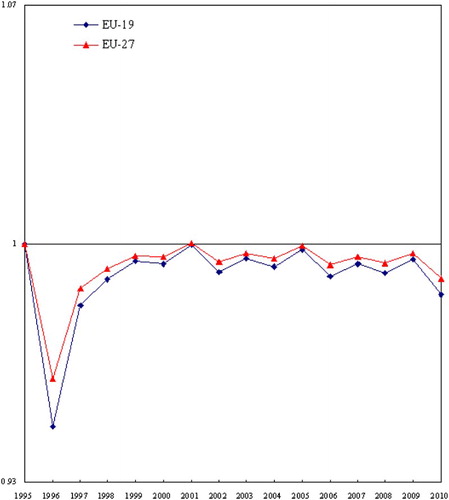
Given that the value of energy efficiency change in period 1 is 1, that is, EEC1 = 1, we can obtain the value of the accumulative energy efficiency change (AEEC) in period n by AEECn = EEC1
(see Wei et al., Citation2007). presents the scores for energy efficiency change for the EU-19 and EU-27 countries. A score for accumulative energy efficiency change lower (larger) than 1 indicates that a falling back (catching up) effect causes the gap to widen (close) between the best DMUs and non-best ones. In the case of the non-Baltic Sea states, the catching up effect only occurs in France and Ireland and their accumulative energy efficiency change values are 1.002 and 1.001, respectively. As for the Baltic Sea states, the falling back effect only occurs in Germany for which the accumulative energy efficiency change value is smaller than 1.
Table 4. Energy efficiency change in EU-19 and EU-27 states during 1995–2010.
indicates that the trend in accumulative energy efficiency change in the EU-27 countries is always superior to that in the EU-19 countries. If the accumulative energy efficiency of EU-19 involves the consideration of energy efficiency in the Baltic Sea states, then the trend curve of EU-19 will push up and become the trend curve of EU-27. This result indicates that the Baltic Sea states have positive energy efficiency change, making EU-27’s energy efficiency be higher than that of EU-19. The Baltic Sea states have a positive energy efficiency that pushes up the trend curve of energy efficiency from EU-19 to EU-27, but this power is so weak that the trend curve of EU-27 cannot move through the value of 1 in , meaning energy efficiency improvement. Some environmental and economic historical events have made energy efficiency in Baltic Sea states fluctuate, such as the Kyoto Protocol being signed at 1997 and going into effect in 2005, as well as the global financial crisis erupting in. The Kyoto Protocol’s signature and implementation caused energy efficiency improvement, while the financial crisis resulted in energy efficiency deterioration, no matter for EU-19, EU-27, or the Baltic Sea states.
Figure 4. The trend of accumulative energy efficiency change in the EU-19 and EU-27 countries.
Farinelli et al. (Citation2005) indicated that Estonia owns the highest share of shale oil in its energy budget in the world, and its energy system exhibits low energy efficiency. Recently, Estonia has paid a lot of attention on technology for the use of shale oil in order to improve its energy efficiency, such as pressurized fluid bed combustion, which is one type of combustion technology that is becoming the favourite future technology to replace traditional pulverized shale oil combustion in Estonia. Hence, energy technology improvement in Estonia is allowing it to leap out of its low energy efficiency to achieve and even to surpass the EU requirement.
Lithuania was a member of the Soviet Union before the Soviet Union’s dissolution in 1991. Energy prices, including crude oil and natural gas in Russia, subsequently sharply increased to converge to the world energy price, which also brought a shock to Lithuania’s energy market. In 1997, all energy prices in Lithuania were raised to fully respond to all production and supply costs, thus improving energy efficiency and causing energy intensity to decrease. Lithuania became a member of the EU in 2004 and then it used EU Structural Funds during the period 2004–2006 to upgrade and develop energy transmission and distribution networks and to introduce renewable energy sources for electricity and heat production, which have helped increase energy efficiency of Lithuania. Streimikiene, Ciegis, and Grundey (Citation2008) proved that the main reason for the decrease in energy intensity in Lithuania is caused by higher energy prices and implementation of EU Structural Funds.
Markandya, Pedroso-Galinato, and Streimikiene (Citation2006) investigated whether a convergent phenomenon of energy intensity exists between 12 transition countries of Eastern Europe and the other 15 EU members (EU-15). The empirical outcome supports the convergent result that the energy intensities of transition countries significantly converge to the EU-15 levels. Hence, the catching up effect of energy efficiency appears in 12 transition countries of Eastern Europe, and most of them are former communist countries. Markandya et al. (Citation2006) also found that the actual energy demand levels in them over the same period even saw a reduction in energy intensity, which implies that a sustainability development target of non-increasing energy consumption may be not applicable.
3.5. Discussion
According to the empirical results in –, the energy productivity change, energy technical change, and energy efficiency change in the UK are almost all greater than 1 over the period 1995–2010. Hence, it is particularly worthwhile studying the UK’s innovation system for new and renewable energy technologies. Foxon et al. (Citation2005) analysed the UK innovation system for new and renewable energy technologies such as solar, marine, wind, biomass, hydrogen, etc. and suggested that successful innovation requires that different actors, including the government, industry, and the research community, work together towards common goals. They also emphasized the importance of policy incentives to overcome system failure such as when technology does not easily progress from one stage to the next stage. Their study supports the view put forward by Bergek and Jacobsson (Citation2003) that policy-makers need to be aware of the complexity of innovation systems in order to improve the design of the mix of policy instruments.
The comprehensive result is that the accumulative energy technical change for all Baltic Sea states in is larger than 1. This result indicates that energy technology progression occurs in all Baltic Sea states and is caused by new energy technology and renewable energy source development. Roos et al. (Citation2012) pointed out that the Baltic Sea countries also follow the EU’s climate and energy package commitments to increase the share of renewable energy and to improve energy efficiency. EU Structural Funds have financed renewable energy technology development in some Baltic Sea states including Lithuania and Poland. Klevas, Streimikiene, and Grikstate (Citation2007) indicated that Lithuania used the EU Structural Funds to promote national sustainable energy development. Streimikiene, Klevas, and Bubeliene (Citation2007) suggested enhancing the use of EU Structural Funds for sustainable energy technology development in new EU members. The score for accumulative energy efficiency change indicates the existence of a catching up effect when AEEC ≥ 1 and a falling behind effect when AEEC < 1. shows that many EU states, including Austria, Greece, Italy, Malta, the Netherlands, Portugal, Spain, and Germany, have experienced the falling back effect; among them, only Germany is a Baltic Sea state. The overall effect, the energy productivity change (as shown in ), reveals that the scores for accumulative energy productivity change in all Baltic Sea states are larger than 1, but that there are three non-Baltic Sea states with scores for accumulative energy productivity change that are smaller than 1. This result implies that there has been obvious progress in terms of energy productivity in the Baltic Sea states. Furthermore, from we know that the improvement in energy productivity in the Baltic Sea states has mainly been caused by energy technical progress.
Some of the sample countries in this paper are former communist countries that belonged to the Soviet Union that dissolved in 1991. It is interesting to examine the subsample with countries having a communist past, because they had high subsidies on energy, which caused their energy prices to deviate from the world market price and made the use of energy highly inefficient. After two decades, these ex-communist countries have joined the free market EU system, meaning that the potential energy productivity or efficiency of these countries should be greater than those countries without a communist past. The study picks out 10 countries with a communist past from the EU-27 sample, creating a subsample of 10 former communist countries (FCC-10), in order to look into whether the potential energy productivity or efficiency of this group improved. The FCC-10 subsample includes Bulgaria, Czech Republic, Estonia, Latvia, Lithuania, Hungary, Poland, Romania, Slovakia, and Slovenia.
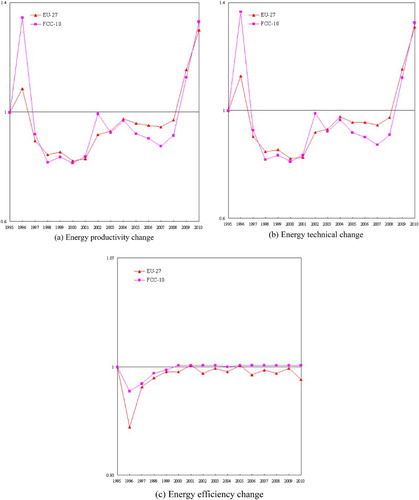
illustrates the analysis results on energy productivity change, energy technical change, and energy efficiency change for the FCC-10 subsample versus that of the EU-27 sample. Except for 1996–1999, the trend of energy efficiency change for the FCC-10 subsample in (c) is stable around unity, causing the trend of energy productivity change in (a) and the trend of energy technical change in (b) to be very similar. This result also implies that the main source of energy productivity change in FCC-10 is energy technical change. In addition, the energy efficiency changes in FCC-10 are always superior to those in EU-27, and the values of energy efficiency change are over unit from 2000 to 2010, which implies that there is a catching up effect on energy efficiency in FCC-10 during this period. It is an interesting result that energy technical progression in FCC-10 surpassed that in EU-27 in 1996, 1997, 2001, 2002, and 2010. Hence, the main source of energy productivity change in FCC-10 is the catching up effect on energy efficiency change, and energy technical progression in FCC-10 also has a positive effect on energy productivity improvement during part of the observation period. This result is different from the finding by Stern (Citation2012) that the energy efficiency in former communist countries is inferior to the English-speaking countries. Zhou, Levine, and Price (Citation2010) took China as an example of a post-communist state to claim that the explicit energy policies in China resulted in rapid development during the 1980s and 1990s.
Figure 5. The energy efficiency relation between the EU-27 and FCC-10 countries: (a) energy productivity change; (b) energy technical change and (c) energy efficiency change.
4. Conclusion
The EU actively participates in BASREC activities by providing a sustainable energy policy, sharing its own regional experience, and facilitating the transfer of know-how from highly developed states to less developed ones. Based on the Baltic Sea being an EU-internal sea, the EU now adopts a comprehensive strategy to develop the Baltic Sea region. There are 13 areas for territorial cooperation that cover all areas of the EU. The Baltic Sea region is one of the 13 areas of territorial cooperation and has received about EUR 55 billion over the 2007–2013 period from Cohesion Funds. Hence, the Baltic Sea region is an excellent test case for regional energy issues.
This study divides the sample into the EU-19 (non-Baltic Sea states in the EU) and EU-27 (all EU members including the Baltic Sea states) countries in order to estimate the impact from the Baltic Sea states. We use the Malmquist-DEA model to calculate the energy productivity change, energy technical change, and energy efficiency change for each EU member. We then compare these two datasets’ energy productivity change, energy technical change, and energy efficiency change from 1995 to 2010. The study result indicates that the scores for energy productivity change, energy technical change, and energy efficiency change in the UK are almost all larger than 1, implying that all three have continuously advanced. In addition, the scores for accumulative energy productivity change, accumulative energy technical change, and accumulative energy efficiency change in the Baltic Sea states are almost all larger than or equal to 1. This result indicates that the EU’s sustainable energy policy has had a positive impact on the Baltic Sea states.
The empirical results show that the energy productivity change and energy technical change in the Baltic Sea states reflect obvious progress; however, the energy efficiency change in the Baltic Sea states is not so obvious. This outcome indicates that the improvement in energy productivity in the Baltic Sea states has been caused by energy technical progression. However, the energy productivity analysis on the 10 former communist countries of the EU shows that the source of their energy productivity progress not only comes from energy technical progress, but also from energy efficiency improvement. These findings also imply that the production frontier in the Baltic Sea states has experienced a large upward shift; however, the cluster effect caused by energy efficiency in the Baltic Sea states is not readily apparent. In the 10 former communist countries of the EU, their production frontier also exhibits a large upward shift; in addition, they also have moved forward to the best-practice frontier, which implies that these 10 former communist countries present a stronger catching up effect, that is, the cluster effect, than the Baltic Sea states.
The Baltic Sea states have been characterized by their outstanding performance in energy productivity and energy technology through the EU’s comprehensive strategy for the Baltic Sea region. An evaluation of the energy productivity change, energy technical change, and energy efficiency change in the Baltic Sea states by comparing the EU-19 dataset with the EU-27 dataset can enable the effect of regional cooperation to be realized.
Disclosure statement
No potential conflict of interest was reported by the authors.
Notes on contributors
Ming-Chung Chang is Professor at the Department of Marketing, Kainan University, Taiwan. His research work focuses on enterprise risk management, productivity & efficiency, environmental & resource economics, and international technology licensing. His research studies have been published in some international journals, including Economic Modelling, Energy Policy, Applied Economics, International Journal of Information Technology and Decision Making, Polish Journal of Environmental Studies, Energy, Baltic Journal of Economics, Sustainability, Journal of Cleaner Production, etc.
Ching-Hua Yu is assistant professor at the Department of Marketing, Kainan University, Taiwan. Her research work focuses on microstructure, behaviour finance, and financial economics. Her research studies has been published in some journals, such as The Institute for Business and Finance Research, Journal of Data Analysis, Review of Securities and Futures Markets, International Research Journal of Finance and Economics, Journal of Financial Studies, etc.
References
- Banker, R. D., Charnes, A., & Cooper, W. W. (1984). Some models for estimating technical and scale inefficiencies in data envelopment analysis. Management Science, 30, 1078–1092. doi: 10.1287/mnsc.30.9.1078
- Banker, R. D., & Morey, R. C. (1986). Efficiency analysis for exogenously fixed inputs and outputs. Operations Research, 34, 513–521. doi: 10.1287/opre.34.4.513
- Bergek, A., & Jacobsson, S. (2003). The emergence of a growth industry: A comparative analysis of the German, Dutch and Swedish wind turbine industries. In J. S. Metcalfe & U. Cantner (Eds.), Change, transformation and development (pp. 197–227). Heidelberg: Physica Verlag.
- Chang, M. C. (2013). A comment on the calculation of the Total-Factor Energy Efficiency (TFEE) Index. Energy Policy, 53, 500–504. doi: 10.1016/j.enpol.2012.10.025
- Chang, T. P., & Hu, J. L. (2010). Total-factor energy productivity growth, technical progress, and efficiency change: An empirical study of China. Applied Energy, 87, 3262–3270. doi: 10.1016/j.apenergy.2010.04.026
- Charnes, A., Cooper, W. W., & Rhodes, E. (1978). Measuring efficiency of decision-making units. European Journal of Operational Research, 2, 429–444. doi: 10.1016/0377-2217(78)90138-8
- Coelli, T. J., Rao, D. S. P., O’Donnell, C. J., & Battese, G. E. (2005). An introduction to efficiency and productivity analysis (2nd ed.). New York, NY: Springer Science+Business Media.
- Cook, W. D., Tone, K., & Zhu, J. (2014). Data envelopment analysis: Prior to choosing a model. Omega, 44, 1–4. doi: 10.1016/j.omega.2013.09.004
- Färe, R., & Grosskopf, S. (1996). Intertemporal production frontiers: With dynamic DEA. Boston, MA: Kluwer Academic.
- Färe, R., Grosskopf, S., Norris, M., & Zhang, Z. (1994). Productivity growth, technical progress, and efficiency change in industrialized countries. American Economic Review, 84, 66–83.
- Farinelli, U., Johansson, T. B., McCormick, K., Mundaca, L., Oikonomou, V., Örtenvik, M., … Santi, F. (2005). ‘White and green’: Comparison of market-based instruments to promote energy efficiency. Journal of Cleaner Production, 13, 1015–1026. doi: 10.1016/j.jclepro.2004.12.013
- Farrell, M. J. (1957). The measurement of productive efficiency. Journal of the Royal Statistical Society. Series A (General), 120, 253–290. doi: 10.2307/2343100
- Foxon, T. J., Gross, R., Chase, A., Howes, J., Arnall, A., & Anderson, D. (2005). UK innovation systems for new and renewable energy technologies: Drivers, barriers and system failures. Energy Policy, 33, 2123–2137. doi: 10.1016/j.enpol.2004.04.011
- Han, Z. Y., Fan, Y., Jiao, J. L., Yan, J. S., & Wei, Y. M. (2007). Energy structure, marginal efficiency and substitution rate: An empirical study of China. Energy, 32, 935–942. doi: 10.1016/j.energy.2006.10.008
- Honma, S., & Hu, J. L. (2008). Total-factor energy efficiency of regions in Japan. Energy Policy, 36, 821–833. doi: 10.1016/j.enpol.2007.10.026
- Honma, S., & Hu, J. L. (2009). Total-factor energy productivity growth of regions in Japan. Energy Policy, 37, 3941–3950. doi: 10.1016/j.enpol.2009.04.034
- Hu, J. L., & Kao, C. H. (2007). Efficient energy-saving targets for APEC economies. Energy Policy, 35, 373–382. doi: 10.1016/j.enpol.2005.11.032
- Hu, J. L., & Wang, S. C. (2006). Total-factor energy efficiency of regions in China. Energy Policy, 34, 3206–3217. doi: 10.1016/j.enpol.2005.06.015
- IAEA. (2005). Energy indicators for sustainable development: Guidelines and methodologies. Vienna: Author.
- Klevas, V., & Antinucci, M. (2004). Integration of national and regional energy development programs in Baltic states. Energy Policy, 32, 345–355. doi: 10.1016/S0301-4215(02)00296-3
- Klevas, V., & Minkstimas, R. (2004). The guidelines for state policy of energy efficiency in Lithuania. Energy Policy, 32, 309–320. doi: 10.1016/S0301-4215(02)00293-8
- Klevas, V., Streimikiene, D., & Grikstate, R. (2007). Sustainable energy in Baltic states. Energy Policy, 35, 76–90. doi: 10.1016/j.enpol.2005.10.009
- Lithuanian Ministry of Economy. (2001). National energy consumption efficiency program. Staff Report, Vilnius.
- Lithuanian Ministry of Economy. (2002). National energy strategy. Staff Report, Vilnius.
- Liu, J. S., Lu, L. Y., Lu, W. M., & Lin, B. J. (2013). Data envelopment analysis 1978–2010: A citation-based literature survey. Omega, 41, 3–15. doi: 10.1016/j.omega.2010.12.006
- Malmquist, S. (1953). Index numbers and indifference surfaces. Trabajos de Estadstica, 4, 209–242. doi: 10.1007/BF03006863
- Markandya, A., Pedroso-Galinato, S., & Streimikiene, D. (2006). Energy intensity in transition economies: Is there convergence towards the EU average? Energy Economics, 28, 121–145. doi: 10.1016/j.eneco.2005.10.005
- Ministry of Economic Affairs and Communications of Republic of Estonia. (2003). National program for transport development for year 2000–2006 (Staff Report). Tallinn.
- Noailly, J., & Smeets, R. (2015). Directing technical change from fossil-fuel to renewable energy innovation: An application using firm-level patent data. Journal of Environmental Economics and Management, 72, 15–37. doi: 10.1016/j.jeem.2015.03.004
- Roos, I., Soosaar, S., Volkova, A., & Streimikene, D. (2012). Greenhouse gas emission reduction perspectives in the Baltic States in frames of EU energy and climate policy. Renewable and Sustainable Energy Reviews, 16, 2133–2146. doi: 10.1016/j.rser.2012.01.013
- Scarlat, N., Dallemand, J. F., Monforti-Ferrario, F., Banja, M., & Motola, V. (2015). Renewable energy policy framework and bioenergy contribution in the European Union – an overview from National Renewable Energy Action Plans and Progress Reports. Renewable and Sustainable Energy Reviews, 51, 969–985. doi: 10.1016/j.rser.2015.06.062
- Seiford, L. M., & Thrall, R. M. (1990). Recent developments in DEA: The mathematical programming approach to frontier analysis. Journal of Econometrics, 46, 7–38. doi: 10.1016/0304-4076(90)90045-U
- Shi, G. M., Bi, J., & Wang, J. N. (2010). Chinese regional industrial energy efficiency evaluation based on a DEA model of fixing non-energy inputs. Energy Policy, 38, 6172–6179. doi: 10.1016/j.enpol.2010.06.003
- Stern, D. I. (2012). Modeling international trends in energy efficiency. Energy Economics, 34, 2200–2208. doi: 10.1016/j.eneco.2012.03.009
- Streimikiene, D. (2007). Monitoring of energy supply sustainability in the Baltic Sea region. Energy Policy, 35, 1658–1674. doi: 10.1016/j.enpol.2006.05.011
- Štreimikienė, D. (2016). Review of financial support from EU structural funds to sustainable energy in Baltic states. Renewable and Sustainable Energy Reviews, 58, 1027–1038. doi: 10.1016/j.rser.2015.12.306
- Streimikiene, D., Ciegis, R., & Grundey, D. (2008). Promotion of energy efficiency in Lithuania. Renewable and Sustainable Energy Reviews, 12, 772–789. doi: 10.1016/j.rser.2006.10.002
- Streimikiene, D., & Klevas, V. (2007). Promotion of renewable energy in Baltic states. Renewable and Sustainable Energy Reviews, 11, 672–687. doi: 10.1016/j.rser.2005.03.004
- Streimikiene, D., Klevas, V., & Bubeliene, J. (2007). Use of EU structural funds for sustainable energy development in new EU member states. Renewable and Sustainable Energy Reviews, 11, 1167–1187. doi: 10.1016/j.rser.2005.07.006
- Wei, Y. M., Liao, H., & Fan, Y. (2007). An empirical analysis of energy efficiency in China’s iron and steel sector. Energy, 32, 2262–2270. doi: 10.1016/j.energy.2007.07.007
- Zhang, X. P., Cheng, X. M., Yuan, J. H., & Gao, X. J. (2011). Total-factor energy efficiency in developing countries. Energy Policy, 39, 644–650. doi: 10.1016/j.enpol.2010.10.037
- Zhou, N., Levine, M. D., & Price, L. (2010). Overview of current energy-efficiency policies in China. Energy Policy, 38, 6439–6452. doi: 10.1016/j.enpol.2009.08.015