ABSTRACT
The main objective of this study is to analyse the evolution of banking efficiency in the Baltic countries after their accession to the EU and during the financial crisis, and to check whether there are significant differences between these countries as a consequence of their particular characteristics. To that end, we have estimated the evolution of cost and profit efficiency in the Baltic countries in the context of the enlarged EU during the period 2000–2013 using Bayesian stochastic frontier models. Our results show the greater robustness of Estonian banking in terms of profits during the financial crisis in comparison to their neighbours. Additionally, Baltic banking has recovered its profit efficiencies very quickly after the financial crisis. However, cost efficiency is still at low levels in line with the other European countries.
1. Introduction
After several years of strong economic growth, Estonia, Latvia and Lithuania experienced very deep recessions in 2008/2009 after the outbreak of the international financial crisis. At first, the Baltic States suffered the effects of the Great Recession with the same high intensity as the leading European industrialized nations, but they were the first economies to overcome it (Hansson & Randveer, Citation2013). This fast recovery in the Baltic economies contrasts with other Central and Eastern European (CEE) countries and some developed European economies in which the impact of the crisis was felt for much longer. Since the financial and economic crisis in Europe, an ongoing question is how to strengthen the European banking systems to eliminate economic uncertainty in the region. As a consequence, the fast and strong recovery of the Baltic economies and Baltic banking after the financial crisis has drawn attention to the performance of their banks.
The Baltic States have often been presented as one homogeneous region due to their characteristics and historical antecedents (Melnikas, Citation2008). However, their banking sectors present some specific characteristics that have led them to face European integration and the financial crisis in different ways. As a consequence, banking performance has also been different across these countries during the recent years. The aim of this paper is to analyse the evolution of cost efficiency and profit efficiency in Baltic banking, especially after the outbreak of the financial crisis, and check whether differences exist among these banking sectors, and also between them and the rest of European banking.
Some papers have analysed the evolution of banking efficiency in the new European member states (including the Baltic countries) before and after their incorporation into the (EU) (Andries & Capraru, Citation2012; Fang, Hasan, & Marton, Citation2011; Gallizo, Moreno, & Salvador, Citation2015a; Kosak, Zajc, & Zoric, Citation2009). However, most of them do not include recent periods after the outbreak of the financial crisis and only a few have focused on the Baltic States (Barros, Managi, Matousek, & Sergi, Citation2014; Popovici, Citation2014; Titko & Jureviciene, Citation2014). In addition, the latter papers have estimated the efficiency of the Baltic banking sectors in the context of the Baltic region. We consider that in a European financial market that is increasingly integrated and with higher levels of competition, it is more realistic and important to estimate these efficiency levels in the wider context of the enlarged EU.
In this paper, we estimate banking efficiency in 29 European countries during the period 2000–2013. Our sample includes data corresponding to the EU-15 countries, the 12 countries that joined the EU in the enlargements of 2004 and 2007, and Croatia and Macedonia, which were negotiating their incorporation to the EU during this period.
To estimate banking efficiency we employ Bayesian stochastic frontier models (Koop & Steel, Citation2001; Koop, Osiewalski, & Steel, Citation1997) which provide some advantages over the techniques traditionally used in the literature (Banerjee, Citation2012; Berger & Humphrey, Citation1997; Tente, Citation2010; Weill, Citation2004). Bayesian inference permits making exact inferences about the parameters and latent variables of the model, without resorting to the use of asymptotic results. In addition, it allows us to compare different models that are not necessarily nested (as in our case) which make different assumptions about the distribution of the efficiency term and about the form of the frontier, taking into account the goodness of fit to the data and the parsimony level of the model, all of which provides more robust results.
This paper is organized as follows. In Section 2 we describe the structure and the evolution of banking in the Baltic States. In Sections 3 and 4, respectively, we describe the data and the methodology used to estimate banking efficiency. In Section 5, we present our results and, finally, Section 6 provides the conclusions. We also include an appendix where we provide some additional results (numerical and graphical) of the estimation process carried out in the paper.
2. Evolution of the banking system in the Baltic States
As a result of the economic transition from planned economies to market economies, the Baltic States (like other CEE countries) liberalized their financial systems and removed the restrictions to foreign ownership entry into their banking markets in compliance with European standards. As a consequence of these normative changes, a substantial influx of foreign investors took place (especially from Sweden, Finland and Denmark) to such an extent that foreign ownership became the dominant form. However, the presence of this ownership was not the same in these three countries (). The entry of foreign ownership was faster in Estonia than in Lithuania and Latvia and, at the end of the 1990s, foreign-owned banks held around 90% of the total banking assets. The presence of foreign ownership in Estonia has been even higher for the last 15 years, holding more than 95% of total assets. In Lithuania, the massive entry of foreign capital happened later. However, since 2002, more than 90% of banking assets correspond to foreign-owned banks. On the contrary, foreign presence in Latvia was significantly lower. Only around 50–70% of total banking assets have been foreign-owned in this country since 2000. Differences also exist in the presence of public ownership. Latvia is the only Baltic country where the State still has control of some commercial banks (state-owned banks represent around 4–5% of total assets before the outbreak of the financial crisis, 19.5% after the nationalization of Parex bank in 2008, and around 7–8% since then).
Table 1. Banking structure in the Baltic States.
It should be noted that many papers have analysed the influence of ownership form on bank performance in CEE countries. There is some consensus in the literature that the entry of foreign capital has provided stability, efficacy and effectiveness to these banking systems (Revoltella, Citation2006) and, as a result, it has improved the competitive environment and has provided more and improved services. Focusing on the influence of ownership on individual banks in these countries, some papers have signalled the greater efficiency of foreign banks in comparison to domestic banks (Bonin, Hasan, & Wachtel, Citation2005; Fries & Taci, Citation2005; Kasman & Yildirim, Citation2006) but also the lower efficiency of state-owned banks in comparison to private banks (Bonin et al., Citation2005). In accordance with these previous results, some differences in banking efficiency between the Baltic countries should be expected.
If we analyse their banking structures, other differences between these countries can be appreciated. As can be seen in , the number of banks was higher in Latvia, although the number of banks in Estonia and Lithuania has significantly increased in recent years. Another characteristic of these banking sectors is the high levels of concentration, which exceed the European average, especially in Estonia and Latvia. The domination of two Swedish banks (Swedbank and SEB), which control more than 50% of the banking assets of the entire Baltic region, should be highlighted.
The recent financial crisis had severe implications for the economies of many countries, but the Baltic States were among the most affected. In 2009, the Gross Domestic Product (GDP) fell by more than 14% in Lithuania; Estonia lost around 20% of its GDP between 2008 and 2009 and Latvia lost around 21% of its GDP between 2008 and 2010. However, these countries have had a faster recovery than the other European countries: all of them have experienced a positive GDP growth every year since 2011. At the beginning of the financial crisis, the shock was amplified by the neighbouring larger economies pulling out their investments from the Baltic States when funds were needed in their home countries (Karilaid, Talpsepp, & Vaarmets, Citation2014). Foreign direct investments were an important tool to promote economic growth in the Baltic countries until the beginning of the financial crisis (Yucel, Citation2014), but these levels of investment declined sharply after 2008. According to International Monetary Fund data, net inflows declined from 15.4% of GDP in Estonia in 2007 to 7.74% in 2008 and to 3.46% in 2013; in Lithuania it fell from 5.77% in 2007 to 0.05% in 2009; and, in Latvia, it declined from 8.80% in 2007 to negative levels (−0.12%) in 2009.
These banking sectors were well capitalized and mainly owned by strong foreign banks with good access to central bank liquidity assistance in their home markets (Hansson & Randveer, Citation2013). As a result, the money supply in the Baltic States (especially Estonia and Latvia) depended, to a high degree, on the actions of Swedish banks (Karilaid et al., Citation2014). As a consequence of this structure in their financial systems, the Baltic countries have had few banking problems, and the effects of suspensions of bank activities on the financial system were negligible (Balkevicius, Citation2014). The exception was the nationalization of Parex bank in Latvia in 2008. Later, other banks, like Snoras bank in 2011 (and its affiliate Latvijas Krajbanka in Latvia) and Ukio Bankas in 2012, also went bankrupt in Lithuania, although these cases are largely a result of years of bad management and little related to the global financial crisis. Since Estonia has no major domestic financial institutions, there was no need of the government funding to bail out the financial sector. The Scandinavian parent banks managed the crisis (Kaasik, Citation2009).
During the deep economic recession (2008–2010), the financial crisis dramatically affected the results of these banking sectors. The economic downturn, the end of the loan portfolio growth, the higher costs of financing and the need to make large provisions for doubtful debts, considerably reduced the profitability of banks. In Estonia, the average return on assets (ROA) decreased from 2.3% in 2007 to 1.4% in 2008 while, in 2009, this indicator fell to negative levels (−2.7%). Losses in 2009 and 2010 in Latvia were almost equal to the overall profits of banks since 2000 (Latvijas Banka, Citation2010). In 2009, the Lithuanian banking system bore a loss for the first time since 2001 and ROA dropped to −4.23%. Following the decrease in loan losses and a slump in prices for financial resources, the Lithuanian banking system reached a turning point in the middle of 2010, although its operational result was still negative (−0.34%) (Lietuvas Bankas, Citation2011).
If we focus on asset quality, the share of loans overdue in Estonia for more than 60 days rose from 0.8% to 5.7% in 2008 while, at the end of 2009, this share had risen to 7%. This trend was finally interrupted in 2010 when loans overdue for more than 60 days finished the year at 6.4%. In Lithuania, the definition of non-performing loans was changed from the middle of 2008Footnote1 so the data since then is not comparable with the data from previous periods. However, during the second half of 2008, the ratio of non-performing loans grew by 2.1–4.55%, and the situation worsened dramatically in 2009 when the ratio of non-performing loans reached 19.3%. Later, during 2010, the level of non-performing loans stabilized (19.7%) and loan impairment losses were six times lower in 2010 than in 2009. In Latvia, loans past due over 90 days represented ‘only’ 3.6% of the banking sector portfolio at the end of 2008. However, an important deterioration took place in the following years when these loans dramatically increased to 16.4% in 2009 and to 19% in 2010. Finally, the figures improved slightly in 2011 (from 19% to 17.5%).
In short, although the Baltic banking sectors have common characteristics, such as the high influence of Nordic banks and a high concentration, there have been some particularities, like foreign presence, public participation or risk exposure, which have probably determined their performance and efficiency, especially in times of crisis.
3. Data
Balance sheet and income data are taken from the Bureau Van Dijk’s BankScope database, which includes data from 30,000 banks around the world. The edition used in this study is from September 2014.
We selected the period 2000–2013 to analyse the evolution of banking efficiency in the Baltic States in the context of the enlarged EU. These years were chosen because of the historic changes that occurred during this period (privatization of the last big state-owned banks, European integration and the recent international financial crisis), which make them especially relevant in scientific terms.
Our sample contains the commercial banks for which data were available for all the variables considered in the study for at least four years. As in previous studies (Fang et al., Citation2011; Gallizo et al., Citation2015a, Citation2015b; Kasman & Yildirim, Citation2006), we focused on commercial banks because, as argued in Demirgüç-Kunt, Laeven, and Levine (Citation2004), this enhances the comparability of banks. In addition, we removed cases for which we had fewer than two observations country/year for cost efficiency or fewer than three observations country/year for profit efficiency (except for Malta, for which we had little data).
As a result, the sample consisted of 1062 banks from 29 European countries with 9745 observations for cost efficiency and 1042 banks from 29 European countries with 9366 observations for profit efficiency. In , we present the distribution of observations by country and by year.
Table 2. Number of observations by country, year and bank.
It can be noticed that Germany, France, the United Kingdom, Luxemburg and Austria are the countries which provided the largest number of observations, while Malta and Finland provided the fewest observations, so the inferences about this second group of countries should be taken with caution. We must also emphasize the high level of representativeness of this sample: the banks included in the study represent approximately 75% of total banking assets in these countries throughout the period analysed.
Focusing on the Baltic States, the sample includes 7 banks from Estonia, 20 from Latvia and 11 from Lithuania. Despite the small number of banks in Estonia, they represent approximately 70% of Estonian banking assets during this period, while Latvian and Lithuanian banks controlled more than 80% of banking assets in their, respectively, countries. A list of the Baltic banks included in this sample can be found in Appendix 1.
By years, we can appreciate that the number of observations grew until 2005 and then stabilized until 2011 when a significant decrease started as a consequence of the financial crisis.
4. Methodology
In the past, traditional accounting ratios were used to analyse bank performance due to their simplicity in obtaining efficiency measures. However, some authors criticized several aspects of accounting ratios (DeYoung, Citation1997; Moormann & Sottocornola, Citation2009). One of the main criticisms was that these measures are susceptible to changes in external prices and efficiency measures should only react to active management decisions (Fried, Lovell, & Schmidt, Citation2008). If environmental factors exert an influence, the measures lose their validity as an efficiency indicator (Tente, Citation2010). In our opinion, these performance indicators are also limited because they are one-dimensional measures which may be unsuitable for capturing the full complexity of the banking industry. It is better to use tools that capture the industry’s many dimensions, which is the approach we take in this study. Such multi-dimensional tools exist and have been used extensively in the study of efficiency in banking (Berger & Humphrey, Citation1992).
To carry out our analysis we have modelled efficiency using Bayesian stochastic frontier models (Koop et al., Citation1997; Koop & Steel, Citation2001) from two perspectives: cost and profit efficiency.Footnote2 Stochastic frontier models are regression models where the regression function (known as the frontier function of the model) estimates the cost (profit) of best-practice banks which produce a given amount of outputFootnote3 under comparable conditions with a minimum (maximum) level of cost (profit). Cost (profit) efficiency measures the cost (profit) differences between a bank’s actual cost (profit) and that of a best-practice bank which produces an identical amount of output.
Many studies have focused mostly on cost efficiency measures due to the difficulty in identifying the output prices (Fries & Taci, Citation2005; Kosak et al., Citation2009; Zajc, Citation2006). However, some empirical evidence has shown that profit efficiency is of greater quantitative importance than cost efficiency, suggesting that the most important inefficiency is on the revenue side. This may be due to the choice of a composition of production that is not the most suitable given the prices of services or to the establishment of a bad pricing policy (Kasman & Yildirim, Citation2006). In addition, the most cost efficient banks are not necessarily the most profit efficient ones and vice versa (Berger & Mester, Citation1997). For all these reasons, in this paper we analyse cost and profit efficiency together to achieve a more complete vision of this topic.
4.1. Intermediation approach vs. value-added approach
There is a discussion in the literature with regards to the consideration of deposits in the model, which have both input and output characteristics (Tortosa-Ausina, Citation2002). In recent papers, two main approaches have been predominant, the intermediation approach, which considers deposits as inputs, and the modified version of the value-added approach, proposed by Berger and Humphrey (Citation1992), which incorporates deposits as both inputs and outputs simultaneously.
In order to provide some empirical evidence for this discussion and taking advantage of the fact that the Bayesian approach provides tools for the comparison of non-nested models, we consider both approaches in our study. As a consequence, for models based on the intermediation approach, we use two outputs: loans (L) and other earning assets (G), and three input prices, the price of capital (PC) given by the ratio of other non-interest expenses than personnel expenses to fixed assets, the price of funds (PF) given by the ratio of financial expenses to total deposits and the price of labour (PL) given by the ratio of total personnel expenses to total assets.Footnote4 For models based on the modified version of the value-added approach, we include one additional output: the amount of deposits (D). In order to measure cost efficiency, we use the total costs (C) of the bank (sum of interest and non-interest costs) as a dependent variable. Therefore, both financial and operating costs are considered in estimating the cost function. To measure profit efficiency, we use profit before tax (PBT) as a dependent variable.
4.2. Model specification
Our dataset corresponds to a set of unbalanced panel series {yi,t; pi,t; xi,t; t ∈ Ti ⊆ {1, … , T}; i = 1, … , N} where yi,t = log (Ci,t) are the log total costsFootnote5 in the estimation of cost efficiency, and yi,t = log (PBTi,t + K) are the log profits before tax for profit efficiency where K = -min(i,t){PBTi,t} + 0.01 was chosen in order to make all the profits non-negativeFootnote6; pi,t = (log (PFi,t), log (PLi,t), log (PCi,t))′ are the input prices and xi,t = (log (Di,t), log (Li,t), log(Gi,t))′ are the outputs of the ith bank (for models based on the intermediation approach, we removed the deposits variable). T = 14 (2000–2013 is the observed period), Ti is the observed period for the ith bank and N = 1062 banks for cost efficiency and N = 1042 banks for profit efficiency. shows the distribution of {Ti; i = 1, … , N}. It can be seen that only 18.74% of the banks, in the case of cost efficiency, and 16.31%, in the case of profit efficiency, have complete series. The average number of observations by the bank is 9, with a standard deviation of 3.4, and 27.87% of the banks, in the case of cost efficiency, and 29.85%, in the case of profit efficiency, have less than 50% of observed periods.
We assume a common frontier for all countries with two different hypotheses about its evolution over time: (1) it remains constant and (2) it changes over time. In this way, we increase the degree of generalizability of this study. We also use exponential and half-normal distributions for the distribution of the log-efficiencies, which are the most common in the literature. For parsimony reasons, we use a Cobb–Douglas function to specify the frontier function. Finally, and in order to capture the possible influence of omitted variables in the frontier of the model related to the country such as macro-economic, demographic and institutional factors, we also include a set of fixed effects.
Next, we describe the mathematical specification of the models considered in the paper.
4.2.1. Models with a constant frontier
These models are given byFootnote7:
(1)
(2)
(3)
and (2) and (3) are mutually independent for (i,t) ≠ (i′,t′). This model corresponds to the use of a Cobb–Douglas function for the frontier with a fixed effect δcountry(i) which tries to capture the influence of omitted variables in the frontier (such as macro-economic, demographic and institutional factors) related to the country where the bank operates; effi,t = is the efficiency of the ith bank in the tth period, and Dcountry(i),t denotes the distribution of the inefficiencies ui,t that we assume to be dependent on the country where the bank was established (country(i)) and on the year analysed. With respect to Dcountry(i),t, we consider two possibilities: an exponential distribution Exp (λcountry(i),t) and a semi-normal distribution SN (
) ≡ NT (0,∞)(0,
).
4.2.2. Models with a dynamic frontier
The form for these models is given by expressions (1)–(3) but with (1) substituted by(4) where we assume that the elasticity coefficients and the frontier intercept are time-varying.
4.2.3. Models with a dynamic frontier and country-time fixed effects
The form of these models is given by expressions (1)–(3) but with (1) substituted by(5) This is the more general model where we assume that the elasticity coefficients are time-varying and we include, on the frontier, the country-time intercepts θcountry(i),t which try to capture the influence (which can be time-varying) of omitted variables related to the country where the bank operates on the frontier.
4.3. Estimation of the models
The estimation of the parameters of the models and the efficiencies of each bank are carried out using the Bayesian approach. The Bayesian analysis of a stochastic frontier function was first proposed by van der Broeck, Koop, Osiewalski, and Steel (Citation1994), and some authors used it successfully in their applied research (Kleit & Terrell, Citation2001; Koop & Steel, Citation2001; Koop, Osiewalski, & Steel, Citation2000). More recently, some studies have demonstrated the validity and advantages of using Bayesian inference to analyse banking efficiency (Assaf, Barros, & Matousek, Citation2011; Gallizo et al., Citation2015a, Citation2015b; Kumbhakar & Tsionas, Citation2005).
The Bayesian approach allows us to make exact inferences about the model parameters and the efficiency levels without resorting to asymptotic results which would provide unreliable results due to the reduced number of series in some countries. In addition, the Bayesian approach allows us to include prior information about the model parameters, particularly restrictions about their signs, all of which provide more flexibility and reliability to the estimation process.
Zhang (Citation2000) compared the performance of Bayesian and maximum likelihood estimation methods in terms of the mean square error criterion, showing the superiority of the former in estimating stochastic frontier models. Furthermore, the Bayesian methodology also provides some procedures for the comparison of non-nested models, taking into account the goodness of fit to the data and the parsimony level of the model, all of which provides more generality to the study.
In order to apply the Bayesian approach, it is necessary to provide a prior distribution of the model. In our case, for the models with a constant frontier, we used:(5)
(6)
(7)
(8)
For the models with a dynamic frontier, we used:(5′)
(6′) instead of priors (5) and (6).
Finally, for models with a dynamic frontier and country-year intercepts we used:(7′)
Also, for all the models, we used:(9) for models with normal efficiencies and
(10) for models with exponential efficiencies.
These distributions were fairly non-informative and they did not exert significant influence on the results.
The estimation of the model parameters and the efficiencies {effi,t; t∈Ti; i = 1, … .,N} was carried out from their posterior distribution calculated by using the Bayes theorem. Given that this distribution is not analytically tractable, we used Monte Carlo Markov Chain methods, namely, the Gibbs sampling algorithm described in Griffin and Steel (Citation2007), which provides a sample from the posterior distribution. The number of iterations of the algorithm for each model was 20,000 where the first 10,000 were discarded to reach convergence. With these samples we calculated a point estimation of each parameter and each effi,t using the posterior median and the 2.5 and 97.5 quantiles, respectively. All estimations were obtained using the statistical package WINBUGS 4.1.
As we noted above, the Bayesian approach allows us to make comparisons between different models that are not necessarily nested (as in our case) using criteria that combine the goodness of fit to the data and the degree of parsimony. In this paper, we use the information criterion (IC) proposed by Ando (Citation2011) which is a modification of the well-known deviation information criterion (DIC) of Spiegelhalter, Best, Carlin, and van de Linde (Citation2002) calculated by the software WINBUGS. The DIC criterion is given by the expression where
measures the lack of fit to the data with L(θ) being the model’s likelihood function, and
, known as the effective number of model parameters, measures their lack of parsimony, with
= E[θ|data]. As a consequence, the lower the DIC is, the less the deviation in the observed data and, thus, the greater the goodness of fit of the model to the data. However, one inconvenience of the DIC is that it assumes that the parametric family of models proposed includes, as a particular case, the true model, but this hypothesis is not necessarily true; in addition, because the observed data are used to build the posterior distribution and to evaluate the model, this criterion tends to an over-parameterized selection (Ando, Citation2007). To avoid these problems, Ando (Citation2011) developed the IC criterion based on analysing the posterior model’s predictive behaviour which is given by the expression
.
5. Results
In , we report the IC values for the 20 models for all the possible combinations of the intermediation/value-added approach, constant/dynamic frontier, with/without fixed effects, exponential/semi-normal distribution of the efficiencies and the dynamic frontier with/without country-year intercepts. The models with a better goodness of fit to the data (smaller values) correspond to dynamic frontier models which include country-year fixed effects along with a semi-normal distribution, in the case of cost efficiency, and time- invariant country fixed effects with an exponential distribution, in the case of profit efficiency. Regarding the input and output selection, the value-added approach provides a better goodness of fit for both cost and profit efficiency.
Table 3. IC values for each model analysed (boldface signals the best model).
In the rest of the paper, we only provide the results for the family of models with better goodness of fit for the sake of brevity.
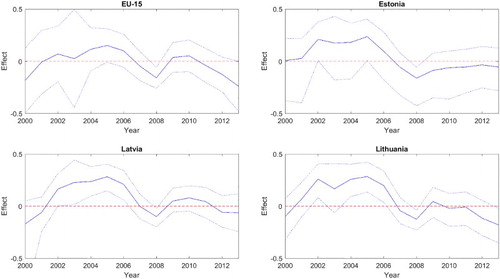
and in the Appendix show the evolution of the point estimations (posterior median) of the frontier parameters together with their 95% credibility bands calculated using the posterior 2.5 and 97.5 quantiles. shows the evolution of the Baltic State effects given by δcountry,t = which compare the country-year intercept θcountry,t with the average intercept of all the countries and years analysed in the paper.Footnote8 This figure also shows the evolution of the average effect of the EU-15. Finally, reports the estimated fixed effects by country and year for profit efficiency.
With respect to the cost frontier (see ), it can be seen that all the coefficients have the expected signs. Among the outputs, the amount of deposits was the explanatory variable with the greatest influence on the total cost with an elasticity which oscillated around 0.9. The influence of loans and other earning assets was significantly lower. Among the inputs, the PF and the PL were the more influential variables but with opposite trends: while the PF showed a decreasing influence, the PL had an increasing influence with the only exception of 2008. The influence of the PC was significantly lower with an elasticity which oscillated around 0.03. It should be noted that the main cost of banks are interest expenses (interest paid by banks represent around 63% of the total bank costs in our sample) so it is not surprising that the variables linked to deposits (volume and prices) appear as the most influential in estimating banking cost efficiency. As Ferreira (Citation2013) argues, this result reflects the current situation of the banking production process, which depends much more on borrowed funds than on the traditional production factors (capital and labour). Previous papers have also identified the greater influence of deposits on cost efficiency (Fries & Taci, Citation2005; Gallizo et al., Citation2015a; Rossi, Schwaiger, & Winkler, Citation2004).
With respect to the profit frontier (see ), it can be seen that all the coefficients have the expected signs. The influence of the outputs (amount of deposits, loans and other earning assets) on the total profits was very similar, with an increasing trend of their elasticity coefficients from around 0.05 in 2000 to 0.15 in 2013. With respect to the inputs, the PF and the PL were again the most influential with elasticities that oscillated around 0.08 and 0.15, respectively. On the contrary, the PC had no significant influence on profits during the period.
The estimated fixed effects in and show the influence of omitted explanatory variables in the frontier of the model related to the country (such as macro-economic, demographic and/or institutional factors) and the year. There are significant differences among countries for both costs and profits due to their specific environments. Thus, not all banks were competing under the same conditions because, depending on the country, they had to support higher or lower expected costs and profits which are related to the country and not to the management. results show that, before the enlargement of the EU, the EU-15 average effects tended to be lower than those of other countries. Previous papers, like Fang et al. (Citation2011), found strong evidence that a better institutional environment (proxy by progress in banking reforms, privatization and corporate governance restructuring) can lead to substantial gains in banking cost efficiency, so differences in the institutional environment could explain the lower expected costs for banks in EU-15 countries compared to Eastern countries. Analysing the dynamic evolution of cost effects (), it can be seen that all the countries analysed achieved a minimum cost level in 2008. This minimum level is explained by the strong adjustments made by all the banks after the beginning of the crisis to offset the falling interest incomes. After that, we can identify a rebound in 2009 when banks had to recognize greater costs associated with a dramatic increase in problematic loans. Since then, we can observe a downward trend showing the efforts made by banks to adjust their costs in recent years. This final trend is also explained by national policies adopted by the Governments to ensure financial stability.
On the profits side, we can see that the differences are less related to geographical areas and more to specific countries and years, showing that, despite the increased economic integration between some neighbouring countries, revenues still depend on local market conditions.
From 2004 to 2007 onwards, the estimated time effects are negative, revealing a decrease in the maximum profit levels for a specific combination of inputs and outputs, which is explained by the increasing competition and the higher orientation of the industry to volume instead of margin. In 2008 a positive time effect is observed, showing that the crisis did not affect all the banks and some of them kept its profits at high levels. This result explains the lost in efficiency observed on average for the whole sample because most of the banks suffered the effects of the crisis and reduced its profits (see –). Finally, we observe a negative effect in 2013, which is explained by the increasing competition which reduced the maximum level of profits but not the efficiency levels which improved this year.
Figure 1. Estimated evolution of the median cost and profit efficiencies of European banks.
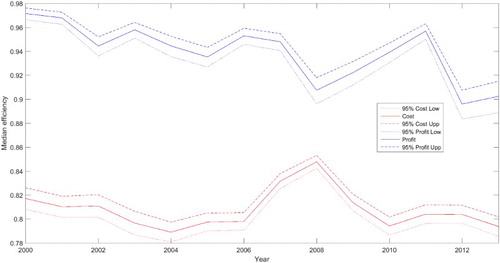
Figure 2. Estimated evolution of the median cost efficiency of EU-15 and the Baltic countries.
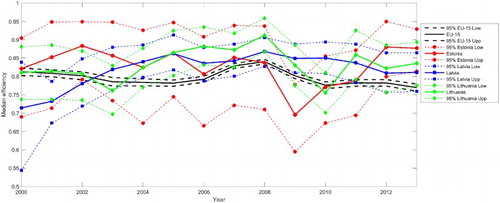
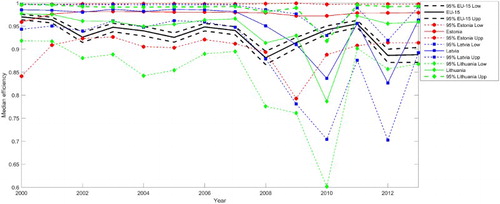
Figure 3. Estimated evolution of the median profit efficiency of EU-15 and the Baltic countries.
If we focus on the Baltic countries, we can see that the costs that could be attributed to the environment (and not to the bank management) tended to be higher in Latvia and Lithuania and lower in Estonia, although the differences among these countries were not significant after their entry into the EU. So it seems that operating in one or another Baltic country did not imply significant extra costs for banks. Regarding profits, we can see that Lithuania was one of the countries where it was most difficult for banks to generate profits. On the contrary, the results show the existence of better conditions for banking activity in Estonia because the profits attributed to the environment in this country are significantly higher than those in Lithuania and Latvia. Claessens, Demirgüç-Kunt, and Huizinga (Citation2001) found that foreign ownership has provided stability, efficacy and effectiveness to the banking system in CEE countries, leading to an enhancement of the competitive environment. So the earlier entry of foreign ownership and its massive presence in Estonia could explain these better conditions.
5.1. Evolution of banking efficiency
In we show the annual evolution of the median cost and profit efficiencies of all the European banks.
The median cost efficiency for the whole period was around 80.40%, indicating that banks could reduce their costs around 19.60% on average during these years. These levels of cost efficiency ranged from 78.90% in 2004 to 84.78% in 2008. On the profits side, there is an average level of 94.45%, which means that European banks could increase their profits around 5.55%. These levels ranged from 89.60% in 2012 to 97.15% in 2000. It should be noted that, for all periods, profit efficiency was always higher than cost efficiency.
For cost efficiency, we found a negative trend until 2004, a positive trend until 2008 and a negative trend after that; for profit efficiency, we observe a negative trend until 2008, a positive trend until 2011 and a negative trend after that. These results are in line with previous papers (Fang et al., Citation2011; Gallizo et al., Citation2015a, Citation2015b; Kosak et al., Citation2009) which identify a positive trend across European countries in cost efficiency as a consequence of the increasing efficiency in new EU members after their accession. These authors suggest that the reforms gradually implemented in these countries have provided a more solid institutional framework, increasing competition and the entry of foreign banks.
If we focus on the influence of the financial crisis on banking efficiency, we can appreciate the existence of a different effect for cost and profit efficiency at the outbreak of the financial crisis (2007–2008). For the first years of crisis, we can see a negative trend for profit efficiency and a positive trend for cost efficiency. The worsening profit efficiency was to be expected because the financial crisis caused a dramatic decrease in the revenues of a lot of banks and significant losses in the banking sector (on average, the ROE in the EU-28 banking sector fell from 10.6% in 2007 to −1.5% in 2008). The effects of the financial crisis were not immediately observed in cost efficiency, but when non-performing loans reached maximum levels, banks had to recognize higher costs (non-performing loans imply higher provisioning needs and also higher funding costs), worsening their cost efficiency.
and show the evolution of the median cost efficiency () and profit efficiency () in the Baltic countries in comparison to the EU-15 while and in the Appendix contain their numerical values.
With respect to cost efficiency ( and ), it can be seen that, in general, point estimations of cost efficiency levels were larger in the Baltic countries than in the EU-15. Exceptions to this rule were Latvia in 2000–2002, Lithuania in 2003 and 2010 and Estonia in 2009. In the latter case, it should be noted that, in spite of the efforts of Estonian Banks to reduce both interest and other operating expenses (as personnel expenses), cost efficiency worsened significantly as a consequence of the costs associated with the increasing levels of impaired loans (impaired loans increased more than 500% in Swedbank As and Versobank As in 2009, and more than 100% in some other important Estonian Banks such as, for example, the SEB Pank). In the case of Lithuania, almost all banks managed to reduce their total costs in 2010, although this reduction was achieved by significantly reducing their business volume (total earning assets of Lithuanian banks included in the sample decreased around 13% in 2010 while total deposits decreased around 14%), thus worsening their cost efficiencies.
With respect to profit efficiency ( and ), similar levels can be seen in the three Baltic countries until the outbreak of the financial crisis, these levels always being higher than the European average.
Although the financial crisis affected first and more intensely the leading industrialized nations than emerging markets (for whom the crisis was largely secondary in nature [IMF, Citation2010]), the Baltic countries suffered its effects at the same time and with similar intensity because of the strong links of their banking to foreign banks (especially Scandinavian banks). The decline in profit efficiency was dramatic and even higher in Lithuania and Latvia than in the rest of Europe, especially in 2010 and 2012 (in Latvia). After the outbreak of the financial crisis, profit efficiency reached its lowest level in Lithuania (0.7867) in 2010 after a first decline in 2008 and just after the peak of the economic crisis in this country (GDP fell by more than 14 points in 2009). Lithuanian banks were especially affected by this economic contraction. Ten of the 11 Lithuanian banks analysed had losses in 2009 and only two obtained profits in 2010, while non-performing loans increased fourfold. After 2011, with a favourable economic context, Lithuanian banks recovered their previous levels of profit efficiency.
Similarly, in Latvia, profit efficiency exhibited an abrupt decrease from 2008 to 2010 during the economic crisis (GDP fell by around 21%). However, in contrast to what we have observed in Lithuania, after an improvement in 2011, efficiency again fell sharply in 2012, reaching its minimum level (82.64%). This downturn was mainly as a consequence of the bad results obtained that year by Norvik Banka AS and Parex Bank. After the split of Parex into good (Citadele Banka) and bad banks in 2010, it continued to manage troubled and bad assets until March 2012 when it abandoned its banking license. In 2013, however, profit efficiency showed an important improvement, reaching near pre-crisis levels. In Estonia, profit efficiency, which never fell below 97%, remained almost the same throughout the period due to the limited effect of the financial crisis. The particular structure of this banking sector and its access to monetary resources from its foreign parent banks may explain this high efficiency.
Finally, it should be noted that, just as the Baltic economies stand out as among the fastest to recover after the crisis, the evolution of profit efficiency also shows that these banking sectors recovered their pre-crisis levels much more quickly than the other European countries. So our results confirm the effectiveness of the Baltic countries in overcoming the financial crisis.Footnote9
6. Conclusions
In this study we have analysed the characteristics of the Baltic banking systems and the evolution of their efficiencies, both in costs and profits, in the context of the enlarged European Union during the period 2000–2013. To estimate banking efficiency we have used Bayesian stochastic frontier models which allow us to make exact inferences about the model parameters and the efficiency levels for each bank-year. Bayesian inference also provides techniques for model comparison, which allow us to compare different non-nested models based on different assumptions about the frontier, the selection of outputs and the distribution of the inefficiency term, giving more statistical support to the results.
Although the Baltic States have often been presented as one homogeneous region, an exploratory analysis has revealed some differences in their banking structures (concentration, number of banks, ownership, etc.). Fixed effects estimations have also shown differences in the influence of the specific environment of each country for banking activity, namely the existence of better conditions for banks to obtain profits in Estonia and worse conditions in Lithuania.
Analysing the evolution of cost and profit efficiency, which are attributed to the management, we have identified a positive trend in cost efficiency during the banking integration process (2004–2007) both for Baltic countries and Europe as a whole, while the variations in profit efficiency were not significant. Focusing on the crisis period, both cost and profit efficiency experienced an important decrease in Baltic countries, with the exceptions of Latvia in cost and Estonia in profit, where the efficiency levels hardly changed. In spite of the great impact of the financial crisis on profit efficiency in Latvia and Lithuania, it should be noted that, at the end of this period, they have already recovered their pre-crisis levels.
In short, and in contrast with the EU-15 countries, results confirm the fast recovery of the banking systems in the Baltic countries after the financial crisis in terms of profit efficiency, showing the effectiveness of these countries in overcoming the financial crisis.
One of the ongoing questions is how to strengthen European banking systems to eliminate financial instability and further research is necessary to identify the factors that explain the soundness of the Estonian banking sector during the crisis period and the fast recovery of Baltic banking as a whole. Finally, it is necessary to include country-specific explanatory variables in the estimated stochastic frontier models which describe the macro-economic, demographic and institutional factors of the country of each bank. It is not clear, however, whether these variables should be included in the frontier equation or in the inefficiency distribution (in the line of the paper of Galán, Veiga, & Wiper, Citation2014). The same can be said with respect to the modelling of the dynamic effects of the stochastic frontier model where, perhaps, AR(1) models could be used to describe their evolution in a more parsimonious way (see, for instance, Galán, Veiga, & Wiper, Citation2015). These objectives are beyond the scope of the present paper and will be analysed in a future paper.
Acknowledgements
The authors would like to express our gratitude to anonymous referees for their helpful and constructive observations on earlier versions of this paper.
Disclosure statement
No potential conflict of interest was reported by the authors.
Notes on contributors
José Luis Gallizo is Professor of Financial Economics and Accounting at the Faculty of Law and Economics of the University of Lleida (Spain). His current research interests include international accounting, family business and empirical aspects of finance and banking.
Jordi Moreno is a postdoctoral researcher at the Faculty of Law and Economics of the University of Lleida (Spain). His main research interests include banking efficiency, family business and co-operative companies.
Manuel Salvador is Professor of Statistics at the Faculty of Economics and Business Studies of the University of Zaragoza (Spain). His current research interests include Bayesian inference and spatial and dynamic models in general with applications to economics and business.
Additional information
Funding
Notes
1 From the middle of 2008, non-performing loans are defined as the sum of non-impaired loans overdue more than 60 days and impaired loans (the ones for which specific provisions were made). Until the first quarter of 2008, non-performing loans in Lithuania were defined as loans with regular payments overdue more than 60 days (including the impaired loans overdue more than 60 days).
2 The use of parametric cost frontiers to estimate banking efficiency also presents some problems or disadvantages (a discussion of these can be found in Tente, Citation2010). The recent financial crisis has also demonstrated the necessity of taking into account the intertemporal nature of finance and risks inherent in credit activities, which is usually omitted in frontier models (recent papers such as Sarmiento & Galan, Citation2014 have worked on this issue).
3 There has been a discussion in the literature about what it is that banks produce. For an extensive review of this controversy see Berger and Humphrey (Citation1992) or Tortosa-Ausina (Citation2002). Some recent papers also support the incorporation of non-traditional activities as a banking output (Lozano-Vivas & Pasiouras, Citation2008).
4 We use total assets instead of the number of employers because there was more missing information for the latter in the database.
5 The log transformation is standard in the literature and is used to increase the normality degree of the dependent variables (total cost or total profits in our case) and to weaken the influence of outliers. We have included the constant K in the profits model in order to be able to apply the log transformation to all the observed cases.
6 One referee asks about the influence of K on the results. This is an interesting question that, to our knowledge, has not been analysed in the literature. If we have two constants K > K′, with K ≈ K′ and/or x >> K′ then:The following table shows some descriptive statistics of the profits of all the banks (in thousands of €) of the analysed sample:
7 One of the referees suggested that ui,t ∼ Di,t. This would be a more realistic way of modelling the inefficiency terms. We did not adopt this hypothesis because of the small number of observations for a non-negligible number of banks (see ) which would have increased the degree of imprecision of the estimations of ui,t. However, and given that the aim of the study is to analyse the country-year efficiencies, we conjecture that our assumption does not significantly bias our results.
8 We also calculate the effects for the other countries but they are omitted for the sake of brevity. However, they are available from the authors upon request.
9 All the results with respect to the cost and profit efficiencies in the Baltic States refer to their point estimations. However, the large width of their 95% credibility bands, due to the small number of banks in these countries (see ), mean that these results should be taken with caution.
References
- Ando, T. (2007). Bayesian predictive information criterion for the evaluation of hierarchical Bayesian and empirical Bayes models. Biometrika, 94(2), 443–458. doi: 10.1093/biomet/asm017
- Ando, T. (2011). Predictive Bayesian model selection. American Journal of Mathematical and Management Sciences, 31(1–2), 13–38. doi: 10.1080/01966324.2011.10737798
- Andries, A., & Capraru, B. (2012). Competition and efficiency in EU 27 banking systems. Baltic Journal of Economics, 12(1), 41–60. doi: 10.1080/1406099X.2012.10840510
- Assaf, G., Barros, C. P., & Matousek, R. (2011). Productivity and efficiency analysis of Shinkin banks: Evidence from bootstrap and Bayesian approaches. Journal of Banking and Finance, 35(2), 331–342. doi: 10.1016/j.jbankfin.2010.08.017
- Balkevicius, A. (2014). Baltic States banking sector evolution, scientific annals of the “Alexandru Ioan Cuza” University of Iasi. Economic Sciences, 61(2), 119–131.
- Banerjee, B. (2012). Banking sector efficiency in new EU member states: A survey. Eastern European Economics, 50(6), 81–115. doi: 10.2753/EEE0012-8775500604
- Barros, C. P., Managi, S., Matousek, R., & Sergi, B. S. (2014). The integration of Baltic banks into the EU banking market: Evidence from the pre-crisis period. Journal of Finance and Management in Public Services, 13(1), 1–22.
- Berger, A. N., & Humphrey, D. B. (1992). Measurement and efficiency issues in commercial banking. In Z. Grilches (Ed.), Output measurement in the service (pp. 245–279). Chicago, IL: The University of Chicago Press.
- Berger, A. N., & Humphrey, D. B. (1997). Efficiency of financial institutions: International survey and directions for future research. European Journal of Operational Research, 98, 175–212. doi: 10.1016/S0377-2217(96)00342-6
- Berger, A. N., & Mester, L. J. (1997). Inside the black box: What explains differences in the efficiencies of financial institutions. Journal of Banking and Finance, 21(7), 895–947. doi: 10.1016/S0378-4266(97)00010-1
- Bonin, J. P., Hasan, I., & Wachtel, P. (2005). Bank performance, efficiency and ownership in transition countries. Journal of Banking and Finance, 29(1), 31–53. doi: 10.1016/j.jbankfin.2004.06.015
- Broeck, J. V. D., Koop, G., Osiewalski, J., & Steel, M. F. J. (1994). Stochastic frontier models: A Bayesian perspective. Journal of Econometrics, 61, 273–304. doi: 10.1016/0304-4076(94)90087-6
- Claessens, S., Demirgüç-Kunt, A., & Huizinga, H. (2001). How does foreign entry affect domestic banking markets? Journal of Banking and Finance, 25, 891–911. doi: 10.1016/S0378-4266(00)00102-3
- Demirgüç-Kunt, A., Laeven, L., & Levine, R. (2004). Regulations, market structure, institutions, and the cost of financial intermediation. Journal of Money, Credit and Banking, 36, 593–622. doi: 10.1353/mcb.2004.0045
- DeYoung, R. (1997). Measuring bank cost efficiency: Don’t count on accounting ratios. Financial Practice and Education, 7(1), 20–31.
- Fang, Y., Hasan, I., & Marton, K. (2011). Bank efficiency in transition economies: Recent evidence from South-Eastern Europe. Economics of Transition, 19(3), 495–520. doi: 10.1111/j.1468-0351.2011.00420.x
- Ferreira, C. (2013). Banking efficiency and European financial integration. Applied Economics Quarterly, 59(2), 99–124. doi: 10.3790/aeq.59.2.99
- Fried, H. O., Lovell, C. A. K., & Schmidt, S. S. (2008). Efficiency and productivity. The measurement of productive efficiency and productivity growth (pp. 3–91). New York, NY: Oxford University Press.
- Fries, S., & Taci, A. (2005). Cost efficiency of banks in transition: Evidence from 289 banks in 15 post-communist countries. Journal of Banking and Finance, 29(1), 55–81. doi: 10.1016/j.jbankfin.2004.06.016
- Galán, J. E., Veiga, H., & Wiper, M. P. (2014). Bayesian estimation of inefficiency heterogeneity in stochastic frontier models. Journal of Productivity Analysis, 42, 85–101. doi: 10.1007/s11123-013-0377-4
- Galán, J. E., Veiga, H., & Wiper, M. P. (2015). Dynamic effects in the inefficiency: Evidence from the Colombian banking sector. European Journal of Operational Research, 240, 562–571. doi: 10.1016/j.ejor.2014.07.005
- Gallizo, J. L., Moreno, J., & Salvador, M. (2015a). Cost banking efficiency. Is there convergence in the enlarged European Union? Spanish Journal of Finance and Accounting, 44(4), 509–544.
- Gallizo, J. L., Moreno, J., & Salvador, M. (2015b). European banking integration: Is foreign ownership affecting banking efficiency? Journal of Business Economics and Management, 16(2), 340–368. doi: 10.3846/16111699.2013.769023
- Griffin, J., & Steel, M. (2007). Bayesian stochastic frontier analysis using Winbugs. Journal of Productivity Analysis, 27(3), 163–176. doi: 10.1007/s11123-007-0033-y
- Hansson, A., & Randveer, M. (2013). Economic adjustment in the Baltic countries (Working Papers of Eesti Pank No. 1/2013).
- IMF. (2010). Global Financial Stability Report. Washington, DC.
- Kaasik, Ü. (2009). Reserves can help – the case of Estonia. In Recent developments in Baltic countries – What are the lessons for Southeastern Europe? Workshops – proceedings OeNB workshops, No.15, 82.91, Wien.
- Karilaid, I., Talpsepp, T., & Vaarmets, T. (2014). Implications of the liquidity crisis in the Baltic-Nordig region. Baltic Journal of Economics, 14(1–2), 35–54. doi: 10.1080/1406099X.2014.949603
- Kasman, A., & Yildirim, C. (2006). Cost and profit efficiencies in transition banking: The case of new EU members. Applied Economics, 38(9), 1079–1090. doi: 10.1080/00036840600639022
- Kleit, A. N., & Terrell, D. (2001). Measuring potential efficiency gains from deregulation of electricity generation: A Bayesian approach. The Review of Economics and Statistics, 83(3), 523–530. doi: 10.1162/00346530152480162
- Koop, G., Osiewalski, J., & Steel, M. F. J. (1997). Bayesian efficiency analysis through individual effects: Hospital cost frontiers. Journal of Econometrics, 76, 77–105. doi: 10.1016/0304-4076(95)01783-6
- Koop, G., Osiewalski, J., & Steel, M. F. J. (2000). Modeling the sources of output growth in a panel of countries. Journal of Business and Economic Statistics, 18(3), 284–299.
- Koop, G., & Steel, M. F. J. (2001). Bayesian analysis of stochastic frontier models. In B. Baltagi (Ed.), A companion to theoretical econometrics (pp. 520–537). Oxford: Blackwell.
- Kosak, M., Zajc, P., & Zoric, I. (2009). Bank efficiency differences in the new EU member states. Baltic Journal of Economics, 9(2), 67–90. doi: 10.1080/1406099X.2009.10840462
- Kumbhakar, S., & Tsionas, E. (2005). Measuring technical and allocative inefficiency in the translog cost system: A Bayesian approach. Journal of Econometrics, 126, 355–384. doi: 10.1016/j.jeconom.2004.05.006
- Latvijas Banka. (2010). Financial stability report 2010. Riga. Retrieved from https://www.bank.lv/images/stories/pielikumi/publikacijas/FSR_2010-eng.pdf
- Lietuvas Bankas. (2011). Financial stability review 2011. Vilnius. Retrieved from http://old.lb.lt/frs_2011
- Lozano-Vivas, A., & Pasiouras, F. (2008). The impact of non-traditional activities on the estimation of bank efficiency: International evidence. Journal of Banking and Finance, 34(7), 1436–1449. doi: 10.1016/j.jbankfin.2010.01.006
- Melnikas, B. (2008). Integration processes in the Baltic region: The new form of regional transformations in the European Union. Engineering Economics, 60(5), 54–64.
- Moormann, J., & Sottocornola, M. (2009). Die Schattenseiten der cost-income-ratio. Schweizer Bank, 7, 24–25.
- Popovici, M. C. (2014). Banking integration and efficiency convergence in Baltic countries in post-crisis period. Timisoara Journal of Economics and Business, 7(2), 134–146. doi: 10.1515/tjeb-2015-0008
- Revoltella, D. (2006, September 6). The EU banking sector integration, cross border M&A and implications for the CEE. Pekao lecture ‘single market, M&A and European competitiveness in a globalized world’, Krynica.
- Rossi, S., Schwaiger, M., & Winkler, G. (2004). Banking efficiency in Central and Eastern Europe. Financial Stability Report, 8, 77–91.
- Sarmiento, M., & Galan, J. E. (2014). Heterogeneous effects of risk-taking on bank efficiency: A stochastic frontier model with random coefficients (Working Paper 14-20, Statistics and Econometric Series 13).
- Spiegelhalter, D. J., Best, N. G., Carlin, B. P., & van de Linde, A. (2002). Bayesian measures of model complexity and fit (with discussion). Journal of the Statistical Royal Society B, 64(4), 583–640. doi: 10.1111/1467-9868.00353
- Tente, S. D. (2010). Bank efficiency estimation. Methodology and the problem of adequation. Münster: Wirtschaftswissenchaftliche Fakultät der Westfalischen Wilhelms-Universität.
- Titko, J., & Jureviciene, D. (2014). DEA application at cross-country benchmarking: Latvian vs. Lithuanian banking sector. Procedia – Social and Behavioral Sciences, 110, 1124–1135. doi: 10.1016/j.sbspro.2013.12.959
- Tortosa-Ausina, E. (2002). Bank cost efficiency and output specification. Journal of Productivity Analysis, 18(3), 199–222. doi: 10.1023/A:1020685526732
- Weill, L. (2004). Measuring cost efficiency in European banking: A comparison of frontier techniques. Journal of Productivity Analysis, 21(2), 133–152. doi: 10.1023/B:PROD.0000016869.09423.0c
- Yucel, G. E. (2014). FDI and economic growth: The case of Baltic countries. Research in World Economy, 5(2), 115–134. doi: 10.5430/rwe.v5n2p115
- Zajc, P. (2006). A comparative study of bank efficiency in central and eastern Europe: The role of foreign ownership. International Finance Review, 6, 117–156. doi: 10.1016/S1569-3767(05)06006-1
- Zhang, X. (2000). A Monte Carlo study on the finite simple properties of the Gibbs sampling method for a stochastic frontier model. Journal of Productivity Analysis, 14(1), 71–83. doi: 10.1023/A:1007895912705
Appendix 1
Table A1. Baltic banks included in the sample
Table A2. Profits frontier effects δcountry for each country and δt = αt − αt−1 for each year (effects δ with P [δ ≥ 0|Data] less than 0.025 or greater than 0.975 were considered significantly negative or positive, respectively).
Table A3. Estimated evolution of median cost efficiencies of EU-15 and the Baltic States.
Table A4. Estimated evolution of median profit efficiencies of EU-15 and the Baltic States.
Figure A1. Estimated coefficients of the cost frontier.
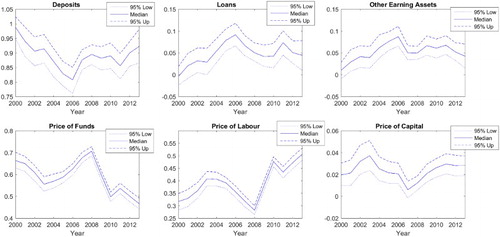
Figure A2. Estimated coefficients of the profit frontier.
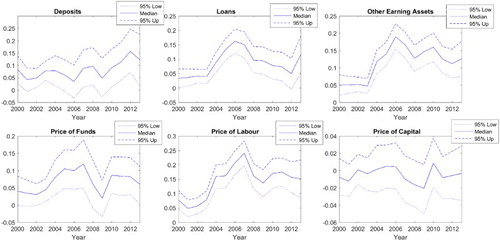
Figure A3. Dynamic evolution of the cost frontier effects of the European Union (calculated as the average of the country effects of the EU-15), Estonia, Latvia and Lithuania.