
 ?Mathematical formulae have been encoded as MathML and are displayed in this HTML version using MathJax in order to improve their display. Uncheck the box to turn MathJax off. This feature requires Javascript. Click on a formula to zoom.
ABSTRACT
This article analyses the effects of minimum wage on employment in the Czech and Slovak Republics based on 2005–17 EU-SILC data. Our results contribute to the scant literature on minimum wage effects in the Central and Eastern European (CEE) region. While prior empirical findings concurred with the effects of minimum wage on labour market outcomes in CEE countries when the minimum wage is relatively high, there is ambiguity when the minimum wage is relatively low. In Slovakia we find that regular minimum wage hikes had insignificant effects on employment. Similarly, we find no negative employment consequences from irregular hikes in the comparatively low minimum wage (MW) of the Czech Republic. Moreover, the groups assumed to be most affected by MW hikes did not experience greater negative consequences following hikes when compared to the overall population of workers in either country.
1. Introduction
The Czech and Slovak Federative Republic instituted a minimum wage (MW) in 1991. Since the dissolution of the state in 1993, the minimum wage dynamics of the two countries have diverged. While the MW has undergone regular annual increases in Slovakia (SK), inconsistent increases have been instituted in the Czech Republic (CZ), where policymakers have more discretionary power. In 2017, the MW relative to the average wage was 37.1% in CZ and 38.5% in SK (Eurostat, Minimum Wage Database). Both CZ and SK are on the lower tail of the MW distribution in the European Union. In 2017, CZ MW in relation to the average wage was the lowest in the union, and SK was a close second.
Minimum wage usually aims to protect low wage earners, improve their living conditions and combat poverty and income inequality. While these goals reach beyond the working population, MW can directly affect only the wages of those who work. Understanding the potential employment effects of MW is also important in order to anticipate the potential impacts on wages. As empirical evidence about the consequences of MW on the labour market in Central and Eastern European (CEE) countries is generally rather limited, this paper provides estimates of the effects on employment among low-wage workers in both Czech Republic and Slovakia, which have a shared history and similar socioeconomic backgrounds but have taken different approaches to setting the MW. Most countries in the CEE region have increased their MW substantially over the last decade, with an eye towards raising the persistently low overall wage levels to meet Western European standards (see, e.g. Drahokoupil, Citation2016). Knowledge of the effects of MW is therefore necessary when formulating policies intended to raise the overall wage level of the region.
This paper contributes to the literature in two ways. Firstly, it adds to the scant research on MW in CEE countries, which generally suggests MW has negative employment consequences (most recently in Harasztosi & Lindner, Citation2019; Vodopivec, Citation2015). In contrast to prior studies primarily focused on countries with relatively high MW, our article offers new insights from countries where it is relatively low. While there have been attempts to quantify the labour market consequences of the MW in CZ (most recently, Fialová and Mysíková, Citation2021; Grossmann et al., Citation2019), this paper is among the first to include SK. Secondly, our article contributes by comparing the impacts of different approaches to setting the MW in two countries with similar socioeconomic backgrounds and history. Given that the MW has been consistently higher in SK, we expect that the negative consequences of raising it further are more profound than rises in the CZ MW (see, e.g. Gorry, Citation2013). However, because the MW rises in SK have also been smaller and more regular, they may have had weaker effects than the larger, irregular MW hikes in CZ.
This article employs panel data methods on individual longitudinal data of heterogeneous MW increases from 2005 to 2017. Following previous research (Abowd et al., Citation1999; Currie & Fallick, Citation1996; Neumark et al., Citation2004), we use the wage rates of individual workers to identify those most likely to be directly affected by hikes in MW. We analyse whether these individuals are less likely to be employed after a MW increase compared to others. Overall, our results show no significant effect from MW hikes on the probability of retaining employment in either country.
2. Literature review
Minimum wages remain controversial. Even after decades of research, neither economic theory nor empirics provide a clear picture of its effects. From a theoretical perspective, we would expect negative employment effects from MW hikes, as many low-paid workers lose their jobs (Brown et al., Citation1983). Nevertheless, positive employment effects may also occur under a monopsonistic labour market structure (Card & Krueger, Citation1995); higher MW may attract workers who were not previously economically active or motivate low-paid workers to increase productivity (Cahuc & Michel, Citation1996) – a positive effect on productivity is also in accordance with the efficiency wages framework (Rebitzer & Taylor, Citation1995).
The magnitude of the effects of MW strongly depends on its level compared to the overall wage floor in the economy, how much it increases, and the particular economic context in which changes are implemented (Addison et al., Citation2013). Therefore, MW consequences may be highly country- and circumstance-specific. Several studies have aimed to identify a ‘safe’ or moderate level of MW, where negative consequences do not exceed its potential benefits. In its cross-country report on minimum wages in the CEE and South Eastern Europe, the IMF (Citation2016) identified a range whereby MW hikes may bring about stark trade-offs at about 40–50% of the average wages in the region. Similarly, Rutkowski (Citation2003) refers to 40% of the average wage threshold as a rule of thumb for a moderate MW in developing countries. A joint ILO, IMF, OECD and World Bank report (G20, Citation2012) considers a MW of 30%–40% the median wage the level at which to attain a suitable balance (roughly corresponding to 25%–35% for the average wage ratio).
Similar to the findings in theoretical studies, the extensive empirical literature on the effects of MW on employment has also thus far not reached a consensus (Brown, Citation1999; Neumark & Wascher, Citation2008; Sabia et al., Citation2016; among others). While some authors have found MW affects employment negatively, others have identified positive consequences, and many studies and several meta-analyses point to the relative insignificance of the effects (de Linde Leonard et al., Citation2014; Doucouliagos & Stanley, Citation2009). The empirics on the effect of MW on wages provide a much clearer picture, generally indicating a positive effect differing along the wage distribution: Whereas low-paid workers are impacted directly, higher-wage workers are affected indirectly by shifts in supply or relative demand (Lopresti & Mumford, Citation2016).
The employment effects of MW in developed countries have been studied extensively. Empirical literature on the employment consequences of MW in post-transition countries including CZ and SK remains limited, and the results are also mixed. In a meta-analysis of a large body of literature on emerging countries, Broecke et al. (Citation2015) found only a minimal (or no) effect of MW increases on employment. By contrast, a recent meta-analysis by Neumark and Corella (Citation2019) concluded that MW employment effects in emerging countries were more consistently negative when the MW was higher and binding within the formal sector and for vulnerable workers. Study results in the CEE region from Hungary (Harasztosi & Lindner, Citation2019; Kertesi & Köllõ, Citation2003) and Slovenia (Vodopivec, Citation2015) confirm this. These countries have a relatively high MW as a proportion of the average wage in the economy, which coincides with Neumark and Corella’s (Citation2019) conclusions.
However, the impact may differ in countries with relatively low MWs, where the evidence is not unanimous. In Estonia, Hinnosar and Rõõm (Citation2003) identified negative effects in the 1990s when the minimum to average wage ratio was below 30%. Conversely, Ferraro, Hänilane, et al. (Citation2018) found no significant impact in 2013–16 when the relative minimum wage increased to around 35% of the average wage. Similarly, in Poland in 1999–2010, when the minimum to average wage ratio was below 40%, Majchrowska and Żółkiewski (Citation2012) identified a negative effect of minimum wage on employment, especially among youth. In their later research, Majchrowska et al. (Citation2016) could not confirm a statistically significant employment effect of MW at the national level in the same period. On the regional level, the authors conclude that a MW may limit the growth of youth employment in less-developed regions of Poland.
In CZ, several studies show no significant employment effects (Buchtíková, Citation1995, data from the early 1990s; Grossmann et al., Citation2019, for the 2012–17 period) while some point to negative (Fialová & Mysíková, Citation2009, for the 1995–2005 period) or mixed effects (Eriksson & Pytlikova, Citation2004, on 1998–2002 data; Fialová & Mysíková, Citation2021, for the 2003–16 period). Similarly, the very limited empirical evidence on MW employment effects in SK presents an ambiguous picture (Eriksson & Pytlikova, Citation2004, on 1998–2002 data; Fialová & Mysíková, Citation2021, for the 2003–16 period).
3. Czech and Slovak minimum wage and labour market conditions
In both CZ and SK, the MW covers all workersFootnote1 and is set by legal governmental decree after consultation with social partners. However, the positions of employee and employer organizations in MW negotiations are very different, as is the (non)obligation of the government to raise the MW annually. The SK government is obliged to adjust the MW rate annually, either as agreed upon with the social partners or according to a formula stated by law and considering overall economic and social situations. The CZ government is not legally obliged to adjust the MW regularly or to try to reach agreement with social partners; when the MW is adjusted, wages and consumer prices should be taken into account, but this may not always occur. MW adjustments in the CZ have largely been influenced by political decisions reflecting the right/left orientation of the government.Footnote2
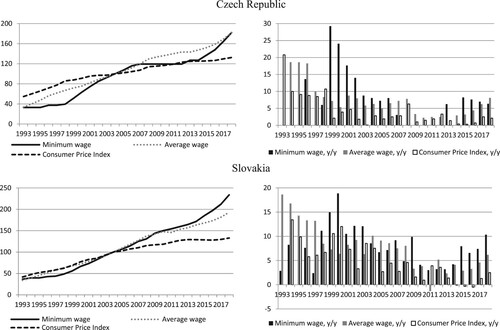
CZ and SK instituted a MW jointly in 1991, and, after the federative republic split in 1993, their MW dynamics followed similar trends until the early 2000s (), increasing unevenly in the early 1990s, then growing by double digits from the late 1990s before slowing somewhat after 2003. Later, their MW dynamics diverged. In CZ, the MW rose only marginally from 2007 to 2014, with more robust rises after 2015, reaching 37.1% of the average wage in the business economy in 2017. The relationship between MW rises and average wages and/or prices was very weak throughout this period (see the upper right panel of ). In SK, the MW increased annually at rates ranging from 3% to 9%. Unlike in CZ, the increases in the SK MW exceeded both the rate of inflation and the growth of average wages for most of the period (see the lower right panel of ). The MW relative to the average SK wage was 38.5% in 2017.
Figure 1. Minimum wage, average wage and consumer price inflation in the Czech Republic and Slovakia, 1993–2018 (2004 = 100 left panels, y/y changes in % right panels) Source: Ministry of Labor and Social Affairs of the Czech Republic, Czech Statistical Office, Ministry of Labor, Social Affairs and Family of the Slovak Republic, Statistical Office of the Slovak Republic, authors’ calculations.
The effect of MW legislation may be, to a certain extent, affected by specific labour market conditions, including the extent of informal employment. According to the estimations of Medina and Schneider (Citation2018), the shadow economy was relatively less prevalent in both CZ and SK when compared with the European average. As a proportion of GDP, the estimated shadow economy averaged 13% of GDP in both CZ and SK in the 2005–17, which is less when compared with other CEE region countries and generally more when compared with those of Western Europe – the European average was around 20% (for details on the MW effect on informality in the region, see also Fialová & Schneider, Citation2014). Moreover, the shadow economies in CEE usually do not involve total informality but rather underreporting of wages or hours worked (see European Commission, Citation2004; Williams, Citation2009). Therefore, the informal labour market may dampen the effect of MW on employment since hikes in the MW may lead to a reshuffling between the formal and informal pay of workers engaged simultaneously in both the formal and informal economies without a direct effect on employment and a weaker effect on the wage growth of the low-paid.
Minimum wage may also have a specific effect on non-standard forms of employment. In both CZ and SK, non-standard work is mainly represented by self-employment, which accounted for 15% and 16% of employment in SK and CZ in 2019, respectively (Eurostat LFS database; the European average stood at 13%), rather than temporary employment or part-time work (see also Hipp et al., Citation2015). Firms often hire the self-employed to do a job instead of offering a classical employment contract in order to save on taxes and mandatory insurance payments (for details on CZ, see Strielkowski, Citation2013). Such behaviour may be partially considered the result of the relatively high taxation of low incomes in the two countries, especially CZ. Nevertheless, such an employment relationship is not subject to MW regulation and its widespread utilization may also dampen the effect of MW in the economy (and vice versa, MW regulations may increase incentives for non-standard forms of employment such as self-employment or temporary contracts, Hipp et al., Citation2015).
4. Data
We employed household survey data from the European Union-Statistics on Income and Living Conditions (EU-SILC), covering 2005–17. EU-SILC is a four-year rotational panel and, thus, both cross-sectional and longitudinal datasets were available.Footnote3 Longitudinal data on detailed economic activity and wages were crucial to our analyses. We employed data for the full period in the CZ but limited the sample to 2008–14 for SK (see the full discussion on data representativeness in the online supplement 1). The data shows annual income variables and monthly economic activity during year t, while job characteristics and current economic activity relate to the time of the survey collection, t+1 (usually the beginning of the second quarter). The data contains information on yearly gross wages in tFootnote4; gross monthly wages are calculated according to the number of months worked in period t.Footnote5 Therefore, cross-sectional datasets include wage information in t and economic activity in t and t+1. For the panel model specification, we utilized the same structure of information for four consecutive years available in the longitudinal datasets; thus, there are four observations per individual.
We limited our samples to workers 16–64 years old who reported full-time (dependent) employment at the end of period t. We eliminated individuals who received sickness benefits in period t as this biases the construction of their monthly wage variable considerably. Only individuals who moved from full-time (dependent) employment at the end of period t to part-time and/or self-employment, unemployment or inactivity are included in the analyses.Footnote6 This leaves about 6,000 individuals per year and country in the cross-sectional datasets (for more details, see ). We excluded individuals reporting monthly wages of less than 50% of the MW and those whose wage is twenty times more than the MW. We compared employment status at the beginning of the second quarter of t+1 to the last month of t. This data design fits our purposes as hikes in the MW become effective in January.Footnote7
Table 1. Sample sizes and minimum wage status (MWSTj): distribution of individuals in cross-sectional datasets (%).
We limited our sample to individuals employed at the end of a year t and consider only the impact of the MW hike on the outflow from full-time employment to all other labour market states (part-time employment, self-employment, unemployment and inactivity). Both CZ and SK belong to countries with relatively high rigidity regarding labour market transitions (Flek & Mysíková, Citation2015). In the analysed periods, full-time employees mostly moved to unemployment (1.1% in CZ, 1.3% in SK), followed by transitions to inactivity (0.5% in CZ, 0.6% in SK), while only 0.2% in both countries moved to part-time employment and 0.1% in CZ and 0.2% in SK to self-employment. The mobility of low-paid workers (MWST1 to MWST2b, see later) is higher: transitions to unemployment remain the most frequent (2.9% in CZ, 2.8% in SK), followed by transitions to inactivity (0.8% in CZ, 1.3% in SK), part-time employment (1.0% in CZ, 0.5% in SK) and self-employment (0.2% in both countries). The low numbers prevent us from distinguishing outflows from full-time employment into separate models or from applying competing risk models.
Therefore, our estimates of the MW effect constitute a lower bound of the overall employment effect in the economy since we do not consider its impact on labour market inflow. Interpreting our results as measuring the overall labour market effect of the MW would be inaccurate.
We constructed a set of j dummy variables denoting an individual’s position in the wage distribution during the period t in relation to the MW: the minimum wage status groups .Footnote8 We considered eight levels of wage earners based on our assumption that higher wage workers are less likely to be affected by MW changes. The first interval includes workers whose gross wage in t (wit) is lower than the MW in t+1. Higher intervals are defined so that the shares of individuals they cover are made equivalent as much as possible. The second interval, including workers earning just above the MW, is divided in two to give a more detailed picture of the MW effects on low-paid workers. However, the distribution of wages relative to MW is different in CZ and SK, resulting in different shares of individuals in the intervals. The intervals are defined as follows:
describes the sizes of our selected cross-sectional samples and the distribution of individuals across the MW statuses defined above (MWSTj). The share of individuals earning around the MW is substantially higher in SK than in CZ – this holds fully for MWST1, MWST2a, MWST2b and MWST3. While in CZ, the average share of workers whose wage did not exceed the MW was 1.5% in 2005–17, this share was more than four times higher in SK, at an average of 6.6%. This reflects the higher SK MW as a proportion of the average wage.
Our analyses further included the following control variables: age in ten-year intervals, years of work experience and its square, education (secondary and tertiary), type of occupation (ISCO) and degree of urbanization of the area of residence (medium and thinly populated areas). We also added regional dummies (NUTS-2 level) and, to account for trends in the regional macroeconomic environment, we controlled for regional GDP per capita growth (in PPS), regional rates of unemployment (for persons aged 25+, from Labour Force Surveys), regional average wage growth and Bartik labour demand shocks (Bartik, Citation1991).
describes the main explanatory variables by MW status. The share of male workers markedly increases with higher MWST in accordance with the relatively high gender wage gaps in both CZ and SK. In CZ, workers aged 16–24 and 45–64 are overrepresented in the lowest MW status intervals, while in SK, only youth aged 16–24 are significantly overrepresented. Among the lowest-paid workers in both countries, the share of individuals with only primary or secondary education is substantially larger than in higher wage groups or in the total sample average, whereas the opposite holds for those with tertiary education. In both countries, more of the lowest paid workers are in occupational categories that do not demand higher qualifications: ISCO 5, 6 and 9 – service and sales workers, skilled agricultural, forestry and fishery workers and elementary occupations. The numbers of the lowest paid are moderately higher in thinly and medium-populated areas and lower in densely populated urban areas.
Table 2. Descriptive statistics and poverty characteristics, pooled sample, shares (%) in minimum wage status groups.
The households of the lowest-paid workers are substantially more often at risk of poverty and experiencing difficulties making ends meet in both countries.Footnote9 However, the numbers of workers in the first MWST group who live in households where members worked on average less than half the year do not differ statistically from the overall sample average. Low work intensity of household members is more common for the highest MWST group in both countries. Clearly, allocation of work within households is related to the wage levels of primary earners.
5. Methodology
Our research follows Abowd et al. (Citation1999), Currie and Fallick (Citation1996) and Neumark et al. (Citation2004), among others. Our model analyses how the interaction between MW rises and a worker’s position in the wage distribution affects that worker’s subsequent probability of retaining employment. Our analysis stems from an assumption based on competitive market theory: if worker productivity remains the same, hikes in the nominal wage render more low-paid workers unemployable (unless they increase their productivity). We use a fixed effects model on panel data which copes with the issue of the unobserved heterogeneity of workers.Footnote10 Following Neumark et al. (Citation2004), we estimate the following equation (Model 1):
(1)
(1)
where dependent variable Zi,t+1 takes the form of change in employment status,Footnote11 vector Xi includes all control variables and the term µi represents an individual-specific heterogeneity constant over time and reflects the workers’ employment history from previous periods. We also account for time fixed effects (Yt).
The MWSTj dummies reflect different probabilities of retaining employment at different positions in the distribution of wages that are unrelated to the effect of the MW, and the coefficients reflect this effect of membership in a particular MWST group. Workers whose wages were too high to be directly affected by the MW hike (MW status group MWST7) represent the reference group. The particular MWST interval can differ for each individual in the panel setting over time according to her/his actual wage in a respective year t. The parameters βj capture the effect of an increase in the MW for each interval of the wage distribution defined by the set of dummy variables MWST1–6 compared to the baseline changes for unaffected workers (MWST7). An interaction of the MWST variable with the ratio of an individual’s wage to the MW in t is represented by parameter δj. This term offers a more flexible specification of developments in wages as it allows changes to differ within the intervals defined by MWST. The model allows for different effects of the MW across the distribution of wages while controlling for other potential factors.
The panel consists of pooled longitudinal data and is unbalanced. The overall time span is 2005–17 for CZ and 2008–14 for SK (as regards t+1). Fixed effects estimates of the linear probability model are employed using the standard fixed effects (‘within’) estimator, with standard errors robust to heteroscedasticity.Footnote12 This specification estimates the contemporaneous effect of the MW on their probability of retaining employment.
However, previous literature has concluded that a substantial part of the MW effect follows with a one-year lag (Baker et al., Citation1999; Neumark et al., Citation2004). Therefore, we advanced our approach to a specification that estimates both the contemporaneous and lagged effects of the MW, conditional upon the position of a worker’s wage relative to the MW. The model takes the following form (Model 2):
(2)
(2)
where dependent variable Zi,t+1 takes the form defined above. Further, while parameters βj still capture the contemporaneous effect of the MW hike, we also account for a lagged effect incorporating the term . The panel consists of pooled data for all longitudinal data sets covering 2006–17 for CZ and 2008–14 for SK (t+1). For each individual in the sample, we have up to three observations in subsequent years – the reduction in the number of observations comes from the utilization of lagged effects.
6. Results and discussion
shows the main results for both the specification focusing on contemporaneous MW effects (model 1; cols. 1, 3) and the one adding lagged effects (model 2; cols. 2, 4).Footnote13 Neither specification indicates significant contemporaneous or lagged employment effects from MW increases in SK. In CZ, from the contemporaneous perspective only, MW hikes seem to drive significant negative employment effects for the lowest-paid workers, but these are not confirmed by the specification including the lagged perspective. Overall, the results indicate that, in the period examined, the MW did not negatively impact the employment of low-paid populations in CZ and SK.
Table 3. Panel data estimation results.
Furthermore, we studied the persistence of MW employment effects among the individual subgroups of employees defined by gender, age and education level (Tables A.3–A.5 in online supplement 3).Footnote14 We aimed to assess the MW impacts on the subgroups that are generally considered more vulnerable to the potential negative consequences of MW hikes in the literature (females, workers with primary education, younger and older workers). Our results do not point to more pronounced or even significant employment effects of MW increases among vulnerable groups in either country.
We ran several different robustness checks to test the validity of our results. First, we employed the data weighted using longitudinal weights designed by Eurostat to account for potential deficiencies in sampling design or data attrition. Second, we re-estimated the model on the sample unrestricted for too-low or too-high wages. Third, we estimated the model only for workers paid less than a 1.45-multiple of the MW in t. Fourth, we split the MWST1 category into two subcategories, MWST1a and MWST1b, according to the relation of the worker’s wage in t to the MW in t – that is, not only according to the relation to the MW in t+1 – to separate the effects of workers earning less than the MW even before the MW hike.Footnote15 Working for lower than official MW may signal some special labour market status that may be more prone to the negative effects of a MW hike. Fifth, we worked with various sub-periods. For CZ, we focused on periods of MW increases (2005–7 and 2014–17) as the variance in our main variable of interest may be largely defined by differences between periods of constant and increasing MW. For SK, we used the 2010–14 period to eliminate any potential bias in the economic hardships of 2008–9. Lastly, we checked the robustness of our results to include control variables since they exhibit only a limited variation over time, and, therefore, their contribution in a time-series setting with individual fixed effects may be questioned. The robustness checks’ results (Tables A.6–A.7 in online supplement 4) generally confirm our previous findings about the insignificance of the MWST variable on employment retention in both countries.
The literature mostly finds negative employment consequences from MW rises in the CEE region, but most prior studies focused on countries with a relatively high MW. The two countries with a comparable MW to CZ and SK and with available empirical results are Estonia (2013–16; Ferraro, Meriküll, et al., Citation2018) and Poland (1999–2010; Majchrowska et al., Citation2016) where, as in our study, negative employment consequences were not found. Our findings are also consistent with recent estimates by Grossmann et al. (Citation2019) for CZ. We therefore argue that it is the burden of the MW relative to the average wage that drives potential negative employment effects in the CEE region.
7. Conclusion
This article contributes to understanding the role of minimum wage by providing empirical estimations of its employment effects in two Central European economies with relatively low MWs – those of the Czech and Slovak Republics. The data shows that a larger share of employees work for MW in SK than in CZ, possibly due to the relatively higher MW in SK. In both countries low-wage earners are generally characterized by youth (in CZ, workers aged 45–64 are also overrepresented), are more likely to be female, and have lower education levels. The lowest paid in both countries also tend to live in households with significantly higher at-risk-of poverty rates and more difficulty in making ends meet.
We find that in SK regular MW growth has not driven negative employment effects. Similarly, we do not find negative employment consequences from irregular and unsystematic MW hikes in CZ. Our findings also indicate that, in general, the groups assumed to be the most affected by MW hikes in the literature (youth, older workers, women, workers with primary education) do not show larger negative consequences when compared to the results of the overall population in either CZ or SK.
Our results suggest that MWs lower than 40% of the average wage level in both CZ and SK are still below the threshold, above which negative consequences outweigh the potential benefits of a MW. The governments of both countries have often considered raising the MW to improve the situation of low-income households and to increase their relatively low wage levels when compared with Western European standards. Although our results indicate that past MW hikes have not had negative employment effects, it does not mean that such a relationship will also hold in the future were the MWs to be raised even further. Economic research has shown that the impacts of a low MW can be very different from those when it is high. The overall economic context and institutional background need to be considered in any decision about MW growth in the future.
Supplemental Material
Download Zip (161 KB)Disclosure statement
No potential conflict of interest was reported by the author(s).
Additional information
Funding
Notes on contributors
Kamila Fialová
Kamila Fialová is a researcher at the Institute of Sociology of the Czech Academy of Sciences. Her specialisation covers macroeconomic and labour market research and her main academic interest is the labour market institutional environment, informal employment, low-wage employment, part-time work, poverty, inequality and well-being.
Martina Mysíková
Martina Mysíková is a senior researcher at the Institute of Sociology of the Czech Academy of Sciences. Her field of specialisation is poverty and income inequality, well-being and job satisfaction, household economics, and labour economics. She participated in various national and European research projects focused mainly on poverty, living conditions and satisfaction of individuals and households, work and job values, or (un)employment.
Notes
1 Sub-minimum wage tariffs for young and disabled workers were used to supplement the system in both countries; these rates were introduced in 1991 and were valid until 2007 in SK and 2012 in CZ. The sub-minima for disabled workers were reintroduced in 2015 in CZ and cancelled again in 2017.
2 Zero growth in MW has roughly corresponded with more right-wing oriented governments. Rises prior to 2008 occurred under social democratic governments and, after 2013, under a primarily social democratic government followed by a caretaker government appointed by President Miloš Zeman, who previously belonged to the Czech Social Democratic Party, and a populist government without a clear right/left orientation headed by Andrej Babiš.
3 We use data from Eurostat, cross-sectional EU-SILC – Cross UDB 2005–17 and longitudinal EU-SILC – Long 2008–17 (2017 is available for CZ only), March 2019 version.
4 The effects of MW increases are assumed to be driven by the demand side, for which the gross value rather than the net value is relevant. Moreover, the data does not provide information on net wages for SK.
5 Months worked part-time were counted at a weight of 0.5—the modal value of hours worked part-time is 20.
6 Movements into disability were excluded as this is obviously independent of labour market conditions.
7 In the Czech Republic, MW increased in a month other than January twice: in 2006, both in January and in July, and in 2013 in August but not in January. To account for this irregularity, the calculations of minimum wage status groups use the weighted-average values of the MW in these years.
8 The thresholds were adjusted for youth according to their sub-minimum wage tariffs in relevant years.
9 At-risk-of-poverty rate is an official indicator used by Eurostat. Inability to make ends meet is the share of respondents living in households reporting (great) difficulty making ends meet (the two lowest categories). Low work intensity is defined differently than in Eurostat; here, the indicator captures the share of respondents living in a household where members aged 16–64 worked on average less than half the year in period t.
10 Even without MW hikes, low-wage earners have lower subsequent employment probabilities than workers who are higher in the wage distribution (see, e.g., Stewart, Citation2007). Low-wage workers are more likely to be high-turnover workers for unobserved reasons, probably the same reasons they earn low wages.
11 It takes the value of 1 if the individual remained employed full-time and 0 if she/he changed to part-time employment, self-employment, unemployment or dropped out of the labour force in t+1.
12 We have not estimated a logit or probit model for employment effects as the number of observations for each individual is small and the estimations would yield inconsistent results (Heckman, Citation1981, p. 134). A further disadvantage of logit fixed-effects (FE) estimates is that they ignore individuals for whom the dependent variable does not change through the sample period. The appropriateness of the FE model stems from the nature of the data and the rationale behind the subject. From the methodological point of view, our data fails to meet the basic assumption of random-effects (RE) models, that unobserved random variables and observed explanatory variables are not correlated. The feasibility of the FE model was tested using the Durbin-Wu-Hausman test; the results rejected the null hypothesis of consistency among both the FE and RE estimators at the 1% significance level.
13 shows only the coefficients for the main MW variables of interest. The coefficients for the full list of independent variables of the baseline regressions are presented in online supplement 2.
14 Note the very small sample sizes in the case of workers with only primary education and workers aged 15–24.
15 The intervals are defined as follows: for wit < MWt and
for MWt ≤wit ≤ MWt+1. We relax the downward restriction on the sample (0.5MWt) so that the category MWST1a covers all full-time workers in t. Note the low number of observations in both MWST1a (568 in CZ, 960 in SK) and MWST1b (200 in CZ, 379 in SK).
References
- Abowd, J., Kramarz, F., & Margolis, D. (1999). Minimum wages and employment in France and the United States. NBER Working Paper Series, no. 6996.
- Addison, J., Blackburn, M. K. L., & Cotti, C. D. (2013). Minimum wage increases in a recessionary environment. Labour Economics, 23, 30–39. https://doi.org/10.1016/j.labeco.2013.02.004
- Baker, M., Benjamin, D., & Stanger, S. (1999). The highs and lows of the minimum wage effect: A time-series cross-section study of the Canadian law. Journal of Labor Economics, 17(2), 318–350. https://doi.org/10.1086/209923
- Bartik, T. (1991). Who benefits from state and local economic development policies? W.E. Upjohn Institute for Employment Research.
- Broecke, S., Forti, A., & Vandeweyer, M. (2015). The effects of minimum wages on employment in emerging economies: A literature review. National Minimum Wage Research Initiative, University of Witwatersrand.
- Brown, C. (1999). Minimum wages, employment and the distribution of income. In O. Ashenfelter & D. Card (Eds.), Handbook of Labor economics (pp. 2101–2163). Elsevier Science/North-Holland.
- Brown, C., Gilroy, C., & Kohen, A. (1983). Time-series evidence of the effect of the minimum wage on youth employment and unemployment. The Journal of Human Resources, 18(1), 3–31. https://doi.org/10.2307/145654
- Buchtíková, A. (1995). Have minimum wages Hit employment in the Czech transformation? In G. Standing & D. Vaughan-Whitehead (Eds.), Minimum wages in Central and Eastern Europe: From protection to destitution (pp. 102–115). Central European University Press.
- Cahuc, P., & Michel, P. (1996). Minimum wage, unemployment and growth. European Economic Review, 40(7), 1463–1482. https://doi.org/10.1016/0014-2921(95)00035-6
- Card, D., & Krueger, A. B. (1995). Myth and measurement: The new economics of the minimum wage. Princeton University Press.
- Currie, J., & Fallick, B. C. (1996). The minimum wage and the employment of youth evidence from the NLSY. The Journal of Human Resources, 31(2), 404–428. https://doi.org/10.2307/146069
- de Linde Leonard, M., Stanley, T. D., & Doucouliagos, H. (2014). Does the UK minimum wage reduce employment? A meta-regression analysis. British Journal of Industrial Relations, 52(3), 499–520. https://doi.org/10.1111/bjir.12031
- Doucouliagos, C. H., & Stanley, T. D. (2009). Publication selection bias in minimum-wage research? A meta-regression analysis. British Journal of Industrial Relations, 47(2), 406–428. https://doi.org/10.1111/j.1467-8543.2009.00723.x
- Drahokoupil, J. (2016). What role can minimum wages play in overcoming the low-wage model in central and eastern Europe? ETUI WP 2016/09.
- Eriksson, T., & Pytlikova, M. (2004). Firm-level consequences of large minimum-wage increases in the Czech and Slovak Republics. Labour, 18(1), 75–103. https://doi.org/10.1111/j.1121-7081.2004.00259.x
- European Commission. (2004). Undeclared work in an enlarged union. An analysis of undeclared work: An in-depth study of specific items.
- Ferraro, S., Hänilane, B., & Staehr, K. (2018). Minimum wages and employment retention: A microeconometric study for Estonia. Baltic Journal of Economics, 18(1), 51–67. https://doi.org/10.1080/1406099X.2018.1485422
- Ferraro, S., Meriküll, J., & Staehr, K. (2018). Minimum wages and the wage distribution in Estonia. Applied Economics, 50(49), 5253–5268. https://doi.org/10.1080/00036846.2018.1486017
- Fialová, K., & Mysíková, M. (2009). The minimum wage: Labor market consequences in the Czech Republic. Czech Journal of Economics and Finance, 59(3), 255–274.
- Fialová, K., & Mysíková, M. (2021). Minimum wage and youth employment in regions of the visegrád countries. Eastern European Economics, 59(1), 82–102. https://doi.org/10.1080/00128775.2020.1816474
- Fialová, K., & Schneider, O. (2014). Labor institutions and their impact on shadow economies in Europe. Review of Economics and Institutions, 5(1), 1–40. https://doi.org/10.5202/rei.v5i1.146
- Flek, V., & Mysíková, M. (2015). Unemployment dynamics in central Europe: A labor flow approach. Prague Economic Papers, 24(1), 73–87. https://doi.org/10.18267/j.pep.501
- G20. (2012). Boosting jobs and living standards in G20 countries. A Joint Report by the ILO, OECD, IMF, and the World Bank. http://www.ilo.org/global/publications/books/WCMS_183705/lang–en/index.htm
- Gorry, A. (2013). Minimum wages and youth unemployment. European Economic Review, 64, 57–75. https://doi.org/10.1016/j.euroecorev.2013.08.004
- Grossmann, J., Jurajda, Š., & Smolka, V. (2019). Dopady zvyšování minimální mzdy v letech 2013–2017 na zaměstnanost a mzdy v České republice. IDEA WP4. Národohospodářský ústav AVČR. (In Czech only).
- Harasztosi, P., & Lindner, A. (2019). Who pays for the minimum wage? American Economic Review, 109(8), 2693–2727. https://doi.org/10.1257/aer.20171445
- Heckman, J. (1981). Statistical models for discrete panel data. In C. F. Manski & D. McFadden (Eds.), Structural analysis of discrete data with econometric applications (pp. 114–178). MIT Press.
- Hinnosar, M., & Rõõm, T. (2003). The impact of minimum wage on the labour market in Estonia: An empirical analysis. WP8 of Eesti Bank. Eesti Bank.
- Hipp, L., Bernhardt, J., & Allmendinger, J. (2015). Institutions and the prevalence of nonstandard employment. Socio-Economic Review, 13(2), 351–377. https://doi.org/10.1093/ser/mwv002
- IMF. (2016). Cross-country report on minimum wages. (IMF Country Report No. 16/151). International Monetary Fund.
- Kertesi, G., & Köllõ, J. (2003). Fighting “low equilibria” by doubling the minimum wage? Hungary’s experiment. (IZA DP no. 970). IZA.
- Lopresti, J. W., & Mumford, K. J. (2016). Who benefits from a minimum wage increase? ILR Review, 69(5), 1171–1190. https://doi.org/10.1177/0019793916653595
- Majchrowska, A., Broniatowska, P., & Żółkiewski, Z. (2016). Minimum wage in Poland and youth employment in regional labor markets. Emerging Markets Finance & Trade, 52(9), 2178–2194. https://doi.org/10.1080/1540496X.2015.1068611
- Majchrowska, A., & Żółkiewski, Z. (2012). The impact of minimum wages on employment in Poland. Investigaciones Regionale, 24, 211–239.
- Medina, L., & Schneider, F. (2018). Shadow economies around the world: What did we learn over the last 20 years? (Working Paper No. WP/18/17). IMF.
- Neumark, D., & Corella, L. F. M. (2019). Do minimum wages reduce employment in developing countries? A survey and exploration of conflicting evidence. NBER Working Paper Series, no. 26462.
- Neumark, D., Schweitzer, M., & Wascher, W. (2004). Minimum wage effects throughout the wage distribution. Journal of Human Resources, 39(2), 425–450. https://doi.org/10.2307/3559021
- Neumark, D., & Wascher, W. (2008). Minimum wages. MIT Press.
- Rebitzer, J., & Taylor, L. (1995). The consequences of minimum wage laws: Some new theoretical ideas. Journal of Public Economics, 56(2), 245–255. https://doi.org/10.1016/0047-2727(93)01411-3
- Rutkowski, J. (2003). The minimum wage: Cure or curse?, Human development economics, Europe and Central Asia Region. The World Bank.
- Sabia, J. J., Burkhauser, R. V., & Hansen, B. (2016). When good measurement goes wrong. ILR Review, 69(2), 312–319. https://doi.org/10.1177/0019793915610557
- Stewart, M. B. (2007). The interrelated dynamics of unemployment and low-wage employment. Journal of Applied Econometrics, 22(3), 511–531. https://doi.org/10.1002/jae.922
- Strielkowski, W. (2013). Undeclared work in the Czech Republic and its implications for the Czech labor market. Central European Business Review, 2(4), 7–14. https://doi.org/10.18267/j.cebr.59
- Vodopivec, M. (2015). The employment and wage spillover effects of Slovenia’s 2010 minimum wage increase. European Scientific Journal, Special edition, 82–109.
- Williams, C. C. (2009). The commonality of envelope wages in Eastern European economies. Eastern European Economics, 47(2), 37–52. https://doi.org/10.2753/EEE0012-8775470203