
 ?Mathematical formulae have been encoded as MathML and are displayed in this HTML version using MathJax in order to improve their display. Uncheck the box to turn MathJax off. This feature requires Javascript. Click on a formula to zoom.
ABSTRACT
This article investigates the extent to which personality traits and cognitive skills can be seen as potential determinants of overeducation, and can explain the overeducation wage penalty. Using a representative survey of the Polish working-age population with well-established measures of cognitive skills and personality traits, I find that accounting for personality and cognitive skills does not change the size and the statistical significance of overeducation wage penalty estimates. My results also demonstrate that personality is one of the contributors to the risk of being overeducated among workers aged 18–29, but not among workers aged 30–68. Among younger workers, agreeable individuals are more likely to be overeducated, while conscientious individuals are less likely to be overeducated. Moreover, lower numeracy skills are associated with higher probability of being overeducated.
1. Introduction
In the last three decades, many countries have experienced rapid improvements in human capital. After Poland transitioned from having a centrally planned economy to having a market economy, tertiary education expanded quickly in the country. The share of university graduates among the working-age population increased from 12% in 2000 to 28% in 2015. Among the youngest cohorts (25–34 years old), almost 43% had tertiary education in 2015.Footnote1 On the one hand, this investment in human capital is viewed as positive for the economic development of the country. It has, for example, been argued that having a highly educated workforce would facilitate Eastern Europe’s economic convergence with Western Europe (Caselli & Tenreyro, Citation2006). On the other hand, this rapid expansion of higher education raises concerns about the capacity of the economy to make good use of the growing highly skilled workforce.
Overeducation, which arises when a worker’s qualifications are higher than the qualifications required by his or her job, can have serious consequences both for individuals and societies. The literature provides consistent evidence that overeducation is associated with wage penalties (Caroleo & Pastore, Citation2018; Korpi & Tåhlin, Citation2009; Montt, Citation2017; Rubb, Citation2003) and job dissatisfaction (Green & Zhu, Citation2010; Verhaest & Omey, Citation2006). From the perspective of policymakers, especially in countries where tertiary education is financed by the state, overeducation can be considered a waste of resources, as public investments in schooling are not being put to productive use. The issues surrounding the costs of overeducation and the potential policy responses to it are becoming even more relevant as the incidence of overeducation has increased or remained unchanged in almost all of EU countries over the 2001–2011 period (McGuinness et al., Citation2018). The upward trend in overeducation in Poland has been confirmed by Baran (Citation2018) over the 2006–2014 period.
The aims of this article are to explore the relationships between cognitive and non-cognitive skills and the probability of being overeducated, and to investigate the role of these skills in explaining the overeducation wage penalty. While there is a large literature on the incidence and consequences for wages of overeducation, analyses accounting for the heterogeneity of skills among workers with the same level of education are sparse. Recently, the impact of non-cognitive skills on labour market outcomes has been increasingly recognised (for reviews, see Almlund et al., Citation2011; Borghans et al., Citation2008). Non-cognitive skills include a variety of character skills, such as personality traits, preferences, and motivations. Previous research has provided solid evidence that non-cognitive skills predict wages (e.g. Heckman & Kautz, Citation2012; Lindqvist & Vestman, Citation2011), but research on the relationship between non-cognitive skills and overeducation is limited, with the exceptions of Blázquez and Budría (Citation2012), Kupets (Citation2016), and Sohn (Citation2010).
There are, however, reasons to expect that non-cognitive skills are related to the probability of being overeducated. An extended job search model (Caliendo et al., Citation2015) can potentially explain a mechanism behind this relationship. Unlike standard job search models in which unemployed individuals have perfect information about the payoffs of their search efforts, this model assumes that each individual has subjective beliefs about the potential payoffs of his or her job search that depend on the person’s non-cognitive skills. If the skills negatively related to the probability of being overeducated are also productivity-enhancing, accounting for the heterogeneity of these skills among workers with the same level of education would partially explain the overeducation wage penalty.
Unobserved heterogeneity has been identified in the literature as one of the main challenges facing researchers attempting to causally estimate the overeducation wage penalty (Leuven & Oosterbeek, Citation2011). Workers with a given level of education may differ with respect to their skills, motivations, or on-the-job training. The main contribution of this paper is to rule out some of these usually unobserved factors: namely, workers’ cognitive and non-cognitive skills. The second contribution is to explore the relationships between workers’ cognitive and non-cognitive skills and their probability of being overeducated. The results show that the differences in cognitive and non-cognitive skills among workers with the same level of education do not explain the overeducation wage penalty, but they are related to being overeducated. Cognitive skills are measured by standardized achievement tests (collected in the Programme for International Assessment of Adult Competencies – PIAAC) that assess numeracy and problem-solving in technology-rich environments. Non-cognitive skills are measured by the Grit Scale and the Big Five framework,Footnote2 which Kautz et al. (Citation2014, p. 9) described as providing ‘the longitude and latitude of non-cognitive skills, by which all more narrowly defined skills may be categorized’. Using the propensity score matching (PSM) approach allows me to check whether the results obtained using linear regression are or are not attributable to common support problems.
The remainder of this paper is structured as follows. Section 2 provides a summary of the relevant theoretical and empirical literature. Section 3 describes the data used, the different measures of overeducation proposed in the literature, and the methodology applied. Section 4 presents the main results, and the findings of a sensitivity analysis that corroborate the results. Section 5 concludes.
2. Related literature
2.1. Theoretical explanations for overeducation
There are several competing labour market theories that seek to explain the differences in wages between workers. Human capital theory (Becker, Citation1964; Schultz, Citation1961) assumes that wages are solely determined by the productivity of workers. In its simplest version, it argues that workers’ wages depend solely on their attained education, and that returns to years of overeducation should therefore be equal to the returns to years of required education. However, empirical research on the earnings effects of being mismatched provides robust evidence that overeducated individuals earn less than well-matched individuals with the same level of education. Many authors have pointed out that individuals with a given level of education have heterogenous endowments of other productive characteristics, such as cognitive or non-cognitive skills, and that these differences in characteristics could help to explain the overeducation wage penalty (Chevalier, Citation2003; Green & McIntosh, Citation2007). If the concept of human capital is broadened to include often unobserved characteristics, such as cognitive and non-cognitive skills or additional vocational training, the observed overeducation penalties may be consistent with the human capital model. Thus, these penalties may actually be generated by the unobserved differences between workers in other dimensions of human capital.
On the other hand, Thurow’s job competition theory (Thurow, Citation1972) assumes that wages are determined solely by the characteristics of the job, and that a worker’s education only determines his or her position in the queue for the best jobs. However, the empirical regularities are not explained by Thurow’s job competition theory. Assignment models (for reviews, see Sattinger, Citation1993, Citation2012) are often seen as being better able to explain the wage consequences of educational mismatch. These models assume that wages are determined by the characteristics of both the job and the worker, and are a solution to the problem of the allocation of heterogeneous workers to heterogeneous jobs.
The career mobility model (Sicherman & Galor, Citation1990) suggests that workers might choose a position for which they are overeducated if the position offers them a higher probability of being promoted by providing on-the-job training and experience. This theory implies that overeducation is a temporary phenomenon. Matching theory (Jovanovic, Citation1979) also predicts that overeducation is temporary. This model posits that mismatch arises because of imperfect information about the quality of the match, and that with increasing tenure, the mismatch between a worker and an employer is detected, and the worker is able to improve the match through a job search.
This analysis relies on the human capital model, which defines human capital as all skills that contribute to production. Cognitive and non-cognitive skills are therefore considered dimensions of human capital alongside traditional measures of human capital, such as years of schooling or experience. Thus, the analysis investigates whether accounting for the heterogeneity of these skills among workers with the same level of education can partially explain the overeducation wage penalty: i.e. whether the differences in wages between overeducated and well-matched individuals are generated by the differences in their productive characteristics other than education: namely, their cognitive and non-cognitive skills.
2.2. Empirical evidence on the overeducation wage penalty
The research on the wage consequences of overeducation has extensively used a modification of the Mincerian earnings equation introduced by Duncan and Hoffman (Citation1981). The so-called ORU model decomposes actual years of education into the three categories of overeducation, required education, and undereducation. The results of empirical studies on the effects of overeducation on wages have been very consistent across the geographical locations and the time periods analysed: namely, that overeducated individuals earn less than well-matched workers with the same level of education, but more than well-matched workers in the same type of job. The meta-analysis by Rubb (Citation2003) estimated that the average rate of return to required years of education is 9.6%, the return to a year of overeducation is 5.2%, and the penalty for every year of undereducation is −4.8%. Another approach is to estimate the wage penalty for overeducation by comparing workers with the same level of education by means of a dummy variable (Verdugo & Verdugo, Citation1989). Across studies using a dummy variable, the average overeducation wage penalty has been estimated at 15.3% (McGuinness, Citation2006). Wincenciak (Citation2016) applied comparable specifications to Poland, and obtained similar results: an overeducation wage penalty of 14.3% for the latter model; and values of 4.6%, 11%, and −5.6%, respectively, for the ORU specification.
There are different approaches to overcoming the problem of unobserved heterogeneity when estimating the overeducation wage penalty. First, several studies have used fixed effects (FE) models in order to address this problem. Bauer (Citation2002) showed that the wage penalty becomes smaller when controlling for individual fixed effects. However, it was later demonstrated that when measurement error is accounted for, panel estimates of overeducation on wages are close to ordinary least squares (OLS) (Dolton & Silles, Citation2008; Verhaest & Omey, Citation2012). Moreover, the FE approach was criticized because the effects were identified from only a small fraction of individuals changing their educational match; and because the strict exogeneity assumption may not hold, as the unobserved characteristics of individuals are likely to change with their educational match status (Leuven & Oosterbeek, Citation2011). Second, instrumental variables are used to account for unobserved heterogeneity (Kleibrink, Citation2016; Korpi & Tåhlin, Citation2009). As Leuven and Oosterbeek (Citation2011) pointed out, these instruments are weak, and might not fulfil exclusion restrictions. Finally, proxies of skills (Allen & Van der Velden, Citation2001; Chevalier, Citation2003; Green & McIntosh, Citation2007) and direct measures of skills (Kleibrink, Citation2016; Levels et al., Citation2014; Sohn, Citation2010) are included to account for differences in ability between individuals with the same level of education. Non-cognitive skills have so far been analysed in the context of the overeducation wage penalty only by Sohn (Citation2010). In his study, the inclusion of locus of control in the OLS wage regression hardly changed the returns to required education, overeducation, and undereducation. However, the analysis included only a single dimension of personality: namely, locus of control.
While most of the existing analyses of the overeducation wage penalty used OLS, several studies used non-parametric methods. For example, McGuinness (Citation2008) and McGuinness and Sloane (Citation2011) found that PSM estimates of the overeducation wage penalty were close to OLS estimates based on samples of graduates from Northern Ireland and the UK, respectively. Similarly, Lamo and Messina (Citation2010) used PSM to assess the impact of overeducation on wages in the Estonian working-age population. They also concluded that these estimates are in line with those generated by OLS. The evidence showing that OLS and PSM produce comparable results suggests that there is no common support problem. However, none of these studies investigated the role of personality traits as a confounding factor, and only McGuinness (Citation2008) used an ability measure in his model.
2.3. Overeducation and personality traits
Non-cognitive skills might affect the probability of being overeducated in multiple ways. The most important channel seems to be the job search effort. An extended job search model (Caliendo et al., Citation2015) assumes that each individual has subjective beliefs about the potential payoffs of a job search that depend on individual’s personality: namely, locus of control. Individuals with an internal (as opposed to an external) locus of control trust that life events depend on their own actions (Almlund et al., Citation2011). Therefore, these individuals can be expected to send out more job applications and to have a higher reservation wage. Empirical evidence supports the predictions of the model that the number of job applications and the reservation wage of each individual depends on his or her locus of control (Caliendo et al., Citation2015; McGee, Citation2015). These results might suggest that workers with a greater internal locus of control have a wider choice of job offers, and are less likely to accept a position with requirements below their qualification levels. Neuroticism – which is characterized by emotional instability, vulnerability to stress, and a lack of self-confidence (Almlund et al., Citation2011) – and having an external locus of control are strongly correlated. Moreover, these characteristics are indicators of a higher order trait: namely, core self-evaluation (Judge et al., Citation2005, Citation2002). Thus, it seems reasonable to expect that neurotic individuals are more likely to be overeducated. Other personality traits may also be positively related to individuals’ job search efforts, including conscientiousness, which is the tendency to be organized, responsible, and hardworking; and grit, which is defined as perseverance and passion in pursuing long-term goals. Therefore, I assume that there is a negative relationship between these traits and the probability of being overeducated.
Other potential mechanisms linking personality traits and overeducation include negotiations and social networks. Agreeable individuals who have the tendency to act in a cooperative, unselfish manner are more likely than their less agreeable counterparts to accept unfair offers (Nguyen et al., Citation2011). Therefore, it seems reasonable to assume that agreeableness is positively related to being overeducated, as agreeable individuals are more prone to accept job offers below their qualification levels. Extraverts typically have broader social networks (Heineck & Anger, Citation2010), which could be helpful in finding a job that matches their qualifications. Open individuals are typically curious, imaginative, and have a wide range of interests. The relationship between openness and being overeducated is ambiguous. In line with these conceptual considerations, I expect to find that neuroticism and agreeableness are positively associated with being overeducated; while conscientiousness, extraversion, and grit are negatively associated with being overeducated. Some of these traits are also related to wages. For Poland, it has been shown that conscientiousness is positively associated with wages, while neuroticism and agreeableness are negatively associated with wages (Palczyńska & Świst, Citation2018).
To the best of my knowledge, there are only three economic papers on the relationship between personality traits and overeducation. The first of these studies used panel data from Germany to show that conscientiousness, extraversion, and having an external locus of control decrease the probability of remaining overeducated, while openness increases it (Blázquez & Budría, Citation2012). The second study showed that in the United States, the locus of control is not related to the probability of being overeducated (Sohn, Citation2010). The third study analysed four non-EU transition economies (Armenia, Georgia, Macedonia, and Ukraine), and showed that conscientiousness and grit are not related to the probability of being overeducated, with the exception of an unexpected finding of a positive relationship between conscientiousness and overeducation in Ukraine and in the pooled sample of countries (Kupets, Citation2016).
3. Data and methods
3.1. Data
This study uses data from the Polish Follow-up Study to the Programme for International Assessment of Adult Competencies (postPIAAC). The dataset combines information for Poland from the international PIAAC study, which was coordinated by the OECD and conducted in 2011/2012, with information from the country follow-up conducted in 2014/2015. The main goals of postPIAAC were to gather longitudinal information on PIAAC respondents in Poland, and to collect additional background information that was not available in the international study. The postPIAAC sample is made up of PIAAC respondents who were living in Poland during the postPIAAC fieldwork. The sample size is 5224 completed interviews with individuals who were among the 9366 Polish participants in PIAAC in 2011/2012. The data collection for postPIAAC was carried out from October 2014 to February 2015. This implies that the interval between the interviews for each individual respondent ranged from 2.5 to 3.5 years.
A unique feature of the PIAAC dataset is that it includes direct measures of cognitive skills. The respondents performed exercises in literacy, numeracy, and problem-solving in technology-rich environments. As the last domain was designed only for people with computer experience, instead of the level of skills, group indicators are included in the analysis: no computer experience or failed a basic test; refused to take the assessment on the computer; below level 1, level 1, and level 2/level 3. The postPIAAC study contains self-report scales of personality from the Big Five Inventory– Short (BFI-S) (Gerlitz & Schupp, Citation2005; John et al., Citation1991) and the Short Grit Scale (Grit-S) (Duckworth & Quinn, Citation2009), which are not available in the PIAAC study. The analysis uses the factor scores from the six-factor oblique model, with an additional factor loading the reverse-worded items for the Big Five questions, as it is the best-fitted model obtained in the psychometric analysis of the scale (Palczyńska & Świst, Citation2016); and the factor scores from the unidimensional model for Grit-S, as Grit-S is often used as a single factor (Eskreis-Winkler et al., Citation2014). The scores for the BFI-S subscales and the Grit-S are standardized with a mean of zero and a standard deviation of one within the total working-age population.
The analyses are restricted to people in paid employment (excluding the self-employed) who answered all the relevant questions. The top and the bottom 1% of the observations with respect to working hours are removed. In the main specification, undereducated workers are excluded from the sample, as the focus of this analysis is on overeducation. In a sensitivity analysis, undereducated individuals are included in the analysis, and are treated as well-matched. The overrepresentation of people aged 19–26 in the PIAAC sample allows for a separate analysis for younger (aged 18–29) and older (aged 30–68) workers. Younger workers face different constraints in the labour market, and have a higher risk of persistent overeducation (Kiersztyn, Citation2013). The sample size does not allow for a more detailed heterogeneity analysis with respect to age.
3.2. Educational mismatch measures
The empirical application of the educational mismatch concept requires a measure of the required level of education for a job. In the literature, three ways of measuring the required level of education have been proposed. First, some studies rely on the evaluation of each occupation by a professional job analyst (JA). This provides an exogenous measure of the required education. However, such evaluations are available for a limited number of countries only, and are updated infrequently. The second method uses the self-assessment (SA) of workers about the level of education required to do or, alternatively, to get their job. This measure allows for heterogeneous education requirements within the same occupation. The third measure is derived from realized job matches (RM) (Verdugo & Verdugo, Citation1989). For each occupation, the required education level is defined as the mean of the completed years of schooling of all workers in the same occupation. A worker is considered to be overqualified if his or her level of education exceeds the mean in his or her occupation by at least one standard deviation. Kiker et al. (Citation1997) proposed an alternative measure based on realized matches. In their approach, the required level of education is the mode of completed schooling among people working in the same occupation.
Although research on overeducation has been conducted for more than three decades, there is no agreement in the literature about how required education should be measured.Footnote3 The measures used in these analyses were chosen mainly based on their availability, and not on their properties. Many of these studies examined whether the results of the earnings equation were sensitive to the measure used, and concluded that the results were independent of the measure of required education used (Chiswick & Miller, Citation2010; Cohn & Khan, Citation1995; Groot & van den Brink, Citation2000; Kiker et al., Citation1997). Only a few of these studies attempted to validate these measures. van der Velden and van Smoorenburg (Citation2000) evaluated a SA and a JA measure within one wage equation, and concluded that the self-assessment method gave more accurate estimates. Verhaest and Omey (Citation2006) compared JA, RM, and two types of SA measures using the same method of evaluation, but did not report that one of these methods of measurement was superior to the others. According to Hartog (Citation2000), JA is ‘conceptually superior’, but its measurement is often flawed. Therefore, there are no clear guidelines in the literature regarding the appropriate measure of required education.
This analysis uses workers’ self-assessments of educational job requirements. The information was collected using the question: ‘Still talking about your current job: If applying today, what would be the usual qualifications, if any, that someone would need to GET this type of job?’ The possible answers correspond to those in the question on the highest completed level of education. The answers to both questions were converted into years of education (the correspondence table can be found in Table A1 in the appendix). These two questions combined give the indicator of being overeducated:
where EDUi is individual i's years of completed education, and REQi is the required years of completed education in individual i's job.
3.3. Method
In this paper, I examine the role of cognitive and non-cognitive skills in the overeducation wage penalty by comparing the estimates from two specifications: without and with these characteristics. In terms of the methodological approach, I use matching methods. Additionally, I also estimate the overeducation wage penalty using linear regression, for the sake of comparison with the previous literature that used this method.
I use matching estimation based on the propensity score (Rosenbaum & Rubin, Citation1983). The propensity score is the conditional probability of receiving the treatment given a vector of pre-treatment covariates. The identifying assumption of this estimation method is the unconfoundedness or conditional independence assumption (CIA), which states that conditional on observable variables that influence selection into treatment, the treatment status is assumed to be randomized. The parameter of interest in the analysis is the average treatment effect on the treated (ATT). In the available data, the non-cognitive skills measures are contemporaneous to the outcomes. Thus, the data do not allow me to rule out the reverse causality problem in the selection model. However, the causal interpretation of the results is supported by previous evidence showing that personality traits are stable over time (Cobb-Clark & Schurer, Citation2012), and that a major work-related life event, such as an involuntary job loss, tends to have a very limited or temporary impact on personality (Anger et al., Citation2017; Preuss & Hennecke, Citation2018).
To empirically investigate whether often unobserved variables such as cognitive skills and personality traits affect estimators based on the CIA assumption, I follow an approach analogous to that of Caliendo et al. (Citation2017), who assessed the impact of often unobserved characteristics on the estimated effectiveness of active labour market programmes in Germany. I compare the results when these characteristics are included in the model (full specification), and when they are not included in the model (base specification).
I estimate the propensity score using a logit model:
where
is the treatment indicator for working in a job for which one is overeducated, and Xi is a vector of individual characteristics. The control group (
) consists of well-matched individuals (
). I also check the sensitivity of the results when undereducated individuals
are included in the control group (with well-matched individuals). In the base specification, the vector of individual characteristics includes the following: age, age squared, gender, level of education, field of education, a dummy for still in education, experience, experience squared, a dummy for living with a partner, a dummy for having children aged 0–6, mother’s level of education, number of books in the home when the respondent was age 16, and the registered unemployment rate in 2014 (on the county level). In the full specification, the individual characteristics additionally include numeracy skills, ICT skills level, and personality traits. These equations are run for the whole sample, and separately by age groups (18–29 and 30–68) and by education levels: upper secondary and post-secondary non-tertiary (ISCED 3–4, according to ISCED-97Footnote4) and tertiary (ISCED 5–6, according to ISCED-97) in the younger age group. For the base and the full specifications for tertiary graduates (ISCED 5–6), a dummy for attending a private university is added. Job characteristics are not included in the model, as they are most likely intermediate outcomes. Thus, if job characteristics were included in the model, a downward bias would likely influence the overall effects of overeducation on wages. The differences in the mean characteristics between overeducated and matched individuals are shown in Table A2 in the appendix.
I consider two matching algorithms with different parameters: nearest neighbour (NN) matching (one and four nearest neighbours) and Epanechnikov kernel matching (bandwidths: 0.02, 0.06 and 0.2). Common support is imposed. Matching quality is assessed by comparing the mean absolute standardised bias (MSB) before and after matching and pseudo R2 from probit estimation of the propensity score on all the variables on raw and matched samples. Standardised bias (SB) for each covariate X is defined as the difference of sample means among the treated and matched controls as a percentage of the square root of the average of sample variances in both groups:
where
is the mean of the control group,
is the mean of the treatment group,
is the variance of the control group, and
is the variance of the treatment group (Caliendo & Kopeinig, Citation2008). I present the overall MSB for all variables, and for different specifications, before and after matching.
Finally, I also estimate a wage equation using a modification of Mincerian wage equation with a dummy for overeducationFootnote5:
where wi is individual i’s gross hourly wage, OVERi is a dummy for overeducation, Xi is a vector of individual characteristics, and ui denotes the error term. The vector of individual characteristics includes the same variables as the aforementioned PSM model.
3.4. Educational mismatch incidence
In the analysed data, one-third of Polish dependent workers are overeducated, while 14% are undereducated (). Overeducation is more common among workers under age 30 (43%), and in this group, tertiary graduates are more likely to be overeducated (47%). Wincenciak (Citation2016), who used the RM approach to measure educational mismatch in Poland in 2013, obtained lower estimates of overeducation incidence (25%) and higher estimates of undereducation incidence (25%).
Table 1. Incidence of the educational mismatch.
In the analysed sample, after removing observations with missing values in the variables of interest, and after limiting the sample to well-matched and overeducated individuals, 40% of the population are found to be overeducated (). A larger share of the younger individuals aged 18–29 (48%) than of the older individuals aged 30–68 (36%) are shown to be overeducated. The educational level is not found to be associated with the incidence of overeducation.
Table 2. Incidence of overeducation in a reduced sample.
4. Results
There are three main findings. First, personality plays a significant role in selection into being overeducated among younger workers aged 18–29, but not among people aged 30–68. Among the younger workers, agreeable individuals are more likely to be overeducated, while conscientious individuals are less likely to be overeducated. Second, lower cognitive skills are associated with being overeducated, and this result is mainly driven by workers aged 30–68. Third, accounting for personality and cognitive skills does not change the size and the statistical significance of overeducation wage penalty estimates.
The effects of personality on selection into overeducation among younger workers are driven by the tertiary education graduates (ISCED 5–6) (). As expected, conscientiousness decreases the risk of being overeducated, while agreeableness is associated with a higher risk of overeducation. These traits are not related to being overeducated among people aged 30–68. A potential explanation for the differences observed between the age groups is that these traits are expected to be important when entering the labour market: i.e. when applying for a job and negotiating wages. Relationships between the risk of overeducation and the other personality traits are not observed. In addition, the level of ICT skills is not related to being overeducated. Only individuals who refused to take the ICT test are more likely to be overeducated than individuals who never used the computer or who failed the test in the 18–29 age group. This finding might be related to the tendency to avoid competition, rather than to the ICT skills level itself. Lower numeracy skills are associated with being overeducated, and this result is mainly driven by workers aged 30–68.
Table 3. Selection into overeducation.
The overall measures of covariate imbalance suggest that the kernel matching algorithm with the bandwidth of 0.06 provides the best balance of covariates after matching (appendix Table A4). However, there is a problem when attempting to find a good balance between treated and controls in the four models: the base and the full specification for the total population and for the 18–29 age group (ISCED 3–4). For these models, the mean standardised bias is in the 5%–7% range, and thus is slightly above the 5% threshold for empirical studies (Caliendo & Kopeinig, Citation2008). Statistics on the quality of the matching for all of the algorithms used are reported in Table A4, and the distributions of propensity scores before and after matching are displayed in Figure A1 in the appendix.
The inclusion of cognitive skills and personality traits leads to only a marginal or no reduction in the overeducation wage penalty (comparing the full specification and the base specification) (). The reduction is the biggest for the 18–29-year-olds with secondary education. For this group, the overeducation penalty is reduced from 15.1% to 13.3% in the OLS model, and from 12.8% to 10.3% in the PSM model, but none of the differences are statistically significant. When individuals with different educational levels are analysed separately, the effects are more heterogenous in the PSM model than in the OLS model. In the PSM model, the overeducation wage penalty is 10% for individuals with secondary education and 17% for tertiary graduates; while in the OLS model, the corresponding values are 13% and 16%.
Table 4. Estimates of the overeducation wage penalty: OLS and PSM results.
As a sensitivity analysis, I estimate models in which undereducated individuals are treated as matched, and are included in the control group (). The main results described above are shown to hold, as the inclusion of cognitive skills and personality traits leads to no reduction in the overeducation wage penalty. When undereducated individuals are included in the control group, the estimates of the overeducation wage penalty are slightly higher. This is to be expected, as undereducated individuals earn more than matched individuals with the same level of education. Thus, including undereducated individuals in the control group increases the average wage in the control group.
Table 5. Estimates of the overeducation wage penalty: OLS and PSM results (undereducated in the control group).
5. Discussion and conclusions
The aim of this paper was to investigate whether heterogeneity in cognitive and non-cognitive skills explains the likelihood of being overeducated and the overeducation wage penalty. Thus, it has extended research on the consequences of overeducation by showing that differences in other dimensions of human capital, such as cognitive and non-cognitive skills, do not explain the overeducation wage penalty. These characteristics are often unobserved, and are suspected to be the source of omitted variable bias. However, the results of this analysis suggest that matching inefficiencies, and not differences in these dimensions of human capital, account for the overeducation wage penalty.
Some personality traits – namely, agreeableness and conscientiousness – were found to be related to the probability of being overeducated among workers aged 18–29; but no personality traits were shown to be related to being overeducated among workers aged 30–68. The reason for this difference between the age groups might be that these traits are probably important at the job application stage, when workers are entering the labour market, but with time, workers manage to improve the match between their position and their qualifications within the company, or by using professional networks they have built with experience. As expected, agreeableness was shown to be positively related to overeducation, while conscientiousness was found to be negatively related to overeducation. These findings are consistent with earlier results reported by Blázquez and Budría (Citation2012) for conscientiousness, though they found agreeableness to be unrelated to overeducation. Lower cognitive skills were shown to be associated with being overeducated, and this result was mainly driven by workers aged 30–68.
Even though these skills were found to be related to being overeducated, the overall impact of including them in the model estimating overeducation wage penalty was insignificant. This might be because only some of the analysed skills were found to be related to being overeducated, and only in some subpopulations. Thus, the overall effects appeared to be limited. It is also possible that these skills are related to overeducation in occupations or industries in which wages are rigid, and are not related to cognitive and non-cognitive skills.
The analysis also uncovered heterogeneity in the overeducation wage penalty among educational groups, with overeducated workers with tertiary education experiencing a higher penalty than overeducated workers with secondary education. Similar results were obtained for the skills match in Poland by Liwiński and Pastore (Citation2021), who showed that the quality of the skills-job match is related to the wages of tertiary education graduates, but not to the wages of secondary education graduates. This pattern may be attributable to the differences in the education premium between these levels of education. The differences in wages are bigger between workers with tertiary and secondary education than they are between workers with secondary and lower than secondary education (Strawiński et al., Citation2018).
The results also indicated that the differences between OLS and PSM estimates are quite substantial for some subpopulations, and are even in the opposite directions: i.e. for workers with secondary education, the PSM estimate of the overeducation wage penalty was found to be smaller than the OLS estimate, while for workers with tertiary education the PSM estimate was shown to be higher than the OLS estimate.
This study is not without limitations. The sample sizes were small, and did not allow for a more detailed heterogeneity analysis with respect to age. Moreover, the cognitive and non-cognitive skills were not measured pre-treatment (before becoming overeducated). Thus, I was unable to rule out the reverse causality problem in the selection model. There is some evidence that mismatch causes cognitive decline (de Grip et al., Citation2008), which could explain the lower cognitive skills observed among the overeducated older workers.
The measure of overeducation used in the analysis was based on workers’ self-assessments. If the bias in the self-assessments was systematically related to the levels of cognitive skills, this could explain the observed relationship between overeducation and cognitive skills. If workers with lower cognitive skills have a greater tendency to systematically understate the requirements of their jobs than individuals who have the same level of education, and are doing the same job, but with higher skills, overeducated individuals would appear to have lower cognitive skills, but only because of the differences in the self-assessments of educational requirements. In my opinion, this is very unlikely. First, the phrasing of the requirements question used in the analysis limits this problem. As the respondents were asked about the recruitment standards – i.e. about the usual qualifications for getting this type of job – and not about the qualifications needed to perform the job, the job requirements should be more objective, and easier for the respondents to assess. Second, there are no conceptual considerations suggesting that workers with lower cognitive skills would understate the educational requirements of their job, the opposite tendency seems more probable.
Thus, the results of the analysis suggest that the heterogeneity in cognitive and non-cognitive skills analysed does not explain the differences in wages between overeducated and matched workers. Leuven and Oosterbeek (Citation2011) identified the omitted variable bias as one of the main challenges of the overeducation literature. Omitted variables are important as long as we can name potential candidates. Workers with a given level of education can have different skills and abilities, additional training, and different work trajectories (Meroni & Vera-Toscano, Citation2017). This paper has ruled out some of these potential sources: namely, basic cognitive skills and personality traits, as measured by the Big Five and the Grit Scale. The analysis did not include all of the potential sources of heterogeneity among workers. For example, motivations or vocational skills may also be relevant for the consequences of overeducation. Further research on this issue is needed.
Acknowledgements
I would like to thank two anonymous referees for their useful comments and suggestions. I also wish to thank Jan Baran and Iga Magda for their insightful comments, and Jan Gromadzki for calculating the LFS statistics. I also want to thank the participants of the 2016 EALE conference and Warsaw International Economic Meeting 2019 for their discussion and remarks. This publication was created as part of the ‘Youth Employment PartnerSHIP’ project, financed by Iceland, Liechtenstein and Norway through the EEA and Norway Grants Fund for Youth Employment, which seeks to combat unemployment among young people. It measures the effectiveness of instruments to support young people who are not working or studying in four countries: Poland, Spain, Italy, and Hungary.
Disclosure statement
No potential conflict of interest was reported by the author(s).
Correction Statement
This article has been republished with minor changes. These changes do not impact the academic content of the article.
Additional information
Funding
Notes on contributors
Marta Palczyńska
Marta Palczyńska is an economist at the Institute for Structural Research (IBS, Warsaw) and a PhD candidate at the Warsaw School of Economics. Her work focuses on the role of cognitive and non-cognitive skills in the labour market, educational mismatches, and the evaluation of the youth labour market policies. Previously, she worked at the Educational Research Institute (IBE, Warsaw), where she was involved in research projects on the situations of youth in the labour market (EXCEPT), and on the assessment of adults competences (PIAAC). She also cooperated with the OECD in the field of non-cognitive skills measurement.
Notes
1 Eurostat Labour Force Survey (LFS) data.
2 The Big Five model defines personality on five dimensions: openness to experience, conscientiousness, extraversion, agreeableness, and neuroticism (the opposite of emotional stability) (McCrae & Costa, Citation1999). Grit is defined as perseverance and a passion for pursuing long-term goals (Duckworth et al., Citation2007).
3 For a detailed discussion of the advantages and disadvantages of the different measures, see: e.g., Hartog (Citation2000) and Leuven and Oosterbeek (Citation2011).
4 International Standard Classification of Education 1997 (UNESCO Institute for Statistics Citation2012).
5 The choice not to include undereducated individuals and the undereducation dummy in the main specification is mainly driven by the aim to estimate OLS and PSM models on the same sample. I estimate the model with two dummies, for overeducation and for undereducation, as a sensitivity analysis (Table A6 in the appendix).
References
- Allen, J., & Van der Velden, R. (2001). Educational mismatches versus skill mismatches: Effects on wages, job satisfaction, and on-the-job search. Oxford Economic Papers, 53(3), 434–452. https://doi.org/10.1093/oep/53.3.434
- Almlund, M., Duckworth, A. L., Heckman, J., & Kautz, T. (2011). Personality psychology and economics. In E. A. Hanushek, S. J. Machin, & L. Woessmann (Eds.), Handbook of economics of education (Vol. 4, pp. 1–181). Elsevier BV.
- Anger, S., Camehl, G., & Peter, F. (2017). Involuntary job loss and changes in personality traits. Journal of Economic Psychology, 60, 71–91. https://doi.org/10.1016/j.joep.2017.01.007
- Baran, J. (2018). A side effect of a university boom: Rising incidence of overeducation among tertiary educated workers in Poland. Economics and Business Review, 4(18)(2), 41–63. https://doi.org/10.18559/ebr.2018.2.3
- Bauer, T. K. (2002). Educational mismatch and wages: A panel analysis. Economics of Education Review, 21(3), 221–229. https://doi.org/10.1016/S0272-7757(01)00004-8
- Becker, G. S. (1964). Human capital: A theoretical and empirical analysis, with special reference to education. University of Chicago Press.
- Blázquez, M., & Budría, S. (2012). Overeducation dynamics and personality. Education Economics, 20(3), 260–283. https://doi.org/10.1080/09645292.2012.679338
- Borghans, L., Duckworth, A. L., Heckman, J. J., & Ter Weel, B. (2008). The economics and psychology of personality traits. Journal of Human Resources, 43(4), 972–1059. https://doi.org/10.3368/jhr.43.4.972
- Caliendo, M., Cobb-Clark, D. A., & Uhlendorff, A. (2015). Locus of control and job search strategies. Review of Economics and Statistics, 97(1), 88–103. https://doi.org/10.1162/REST_a_00459
- Caliendo, M., & Kopeinig, S. (2008). Some practical guidance for the implementation of propensity score matching. Journal of Economic Surveys, 22(1), 31–72. https://doi.org/10.1111/j.1467-6419.2007.00527.x
- Caliendo, M., Mahlstedt, R., & Mitnik, O. A. (2017). Unobservable, but unimportant? The relevance of usually unobserved variables for the evaluation of labor market policies. Labour Economics, 46, 14–25. https://doi.org/10.1016/j.labeco.2017.02.001
- Cameron, A. C., & Trivedi, P. K. (2009). Microeconometrics using stata. Stata Press.
- Caroleo, F. E., & Pastore, F. (2018). Overeducation at a glance. Determinants and wage effects of the educational mismatch based on AlmaLaurea data. Social Indicators Research, 137(3), 999–1032. https://doi.org/10.1007/s11205-017-1641-1
- Caselli, F., & Tenreyro, S. (2006). Is Poland the next Spain? In R. H. Clarida, J. Frankel, F. Giavazzi, & K. D. West (Eds.), NBER international seminar on macroeconomics 2004 (pp. 459–533). MIT Press.
- Chevalier, A. (2003). Measuring over-education. Economica, 70(279), 509–531. https://doi.org/10.1111/1468-0335.t01-1-00296
- Chiswick, B. R., & Miller, P. W. (2010). Does the choice of reference levels of education matter in the ORU earnings equation? Economics of Education Review, 29(6), 1076–1085. https://doi.org/10.1016/j.econedurev.2010.06.001
- Cobb-Clark, D. A., & Schurer, S. (2012). The stability of big-five personality traits. Economics Letters, 115(1), 11–15. https://doi.org/10.1016/j.econlet.2011.11.015
- Cohn, E., & Khan, S. P. (1995). The wage effects of overschooling revisited. Labour Economics, 2(1), 67–76. https://doi.org/10.1016/0927-5371(95)80008-L
- de Grip, A., Bosma, H., Willems, D., & van Boxtel, M. (2008). Job-worker mismatch and cognitive decline. Oxford Economic Papers, 60(2), 237–253. https://doi.org/10.1093/oep/gpm023
- Dolton, P. J., & Silles, M. A. (2008). The effects of over-education on earnings in the graduate labour market. Economics of Education Review, 27(2), 125–139. https://doi.org/10.1016/j.econedurev.2006.08.008
- Duckworth, A. L., Peterson, C., Matthews, M. D., & Kelly, D. R. (2007). Grit: Perseverance and passion for long-term goals. Journal of Personality and Social Psychology, 92(6), 1087–1101. https://doi.org/10.1037/0022-3514.92.6.1087
- Duckworth, A. L., & Quinn, P. D. (2009). Development and validation of the Short Grit Scale (GRIT–S). Journal of Personality Assessment, 91(2), 166–174. https://doi.org/10.1080/00223890802634290
- Duncan, G. J., & Hoffman, S. D. (1981). The incidence and wage effects of overeducation. Economics of Education Review, 1(1), 75–86. https://doi.org/10.1016/0272-7757(81)90028-5
- Eskreis-Winkler, L., Shulman, E. P., Beal, S. A., & Duckworth, A. L. (2014). The grit effect: Predicting retention in the military, the workplace, school and marriage. Frontiers in Psychology, 5(36). https://doi.org/10.3389/fpsyg.2014.00036
- Gerlitz, J.-Y., & Schupp, J. (2005). Zur Erhebung der Big-Five-basierten persoenlichkeitsmerkmale im SOEP. DIW Research Notes 4, 2005.
- Green, F., & McIntosh, S. (2007). Is there a genuine under-utilization of skills amongst the over-qualified? Applied Economics, 39(4), 427–439. https://doi.org/10.1080/00036840500427700
- Green, F., & Zhu, Y. (2010). Overqualification, job dissatisfaction, and increasing dispersion in the returns to graduate education. Oxford Economic Papers, 62(4), 740–763. https://doi.org/10.1093/oep/gpq002
- Groot, W., & van den Brink, H. M. (2000). Overeducation in the labor market: A meta-analysis. Economics of Education Review, 19(2), 149–158. https://doi.org/10.1016/S0272-7757(99)00057-6
- Hartog, J. (2000). Over-education and earnings: Where are we, where should we go? Economics of Education Review, 19(2), 131–147. https://doi.org/10.1016/S0272-7757(99)00050-3
- Heckman, J. J., & Kautz, T. (2012). Hard evidence on soft skills. Labour Economics, 19(4), 451–464. https://doi.org/10.1016/j.labeco.2012.05.014
- Heineck, G., & Anger, S. (2010). The returns to cognitive abilities and personality traits in Germany. Labour Economics, 17(3), 535–546. https://doi.org/10.1016/j.labeco.2009.06.001
- John, O. P., Donahue, E. M., & Kentle, R. L. (1991). The big five inventory—Versions 4a and 54. University of California, Berkeley, Institute of Personality and Social Research.
- Jovanovic, B. (1979). Job matching and the theory of turnover. Journal of Political Economy, 87(5, Part 1), 972–990. https://doi.org/10.1086/260808
- Judge, T. A., Bono, J. E., Erez, A., & Locke, E. A. (2005). Core self-evaluations and job and life satisfaction: The role of self-concordance and goal attainment. Journal of Applied Psychology, 90(2), 257–268. https://doi.org/10.1037/0021-9010.90.2.257
- Judge, T. A., Erez, A., Bono, J. E., & Thoresen, C. J. (2002). Are measures of self-esteem, neuroticism, locus of control, and generalized self-efficacy indicators of a common core construct? Journal of Personality and Social Psychology, 83(3), 693–710. https://doi.org/10.1037/0022-3514.83.3.693
- Kautz, T., Heckman, J. J., Diris, R., ter Weel, B., & Borghans, L. (2014). Fostering and measuring skills: Improving cognitive and non-cognitive skills to promote lifetime success (Working Paper No. 20749). National Bureau of Economic Research.
- Kiersztyn, A. (2013). Stuck in a mismatch? The persistence of overeducation during twenty years of the post-communist transition in Poland. Economics of Education Review, 32, 78–91. https://doi.org/10.1016/j.econedurev.2012.09.009
- Kiker, B. F., Santos, M. C., & de Oliveira, M. M. (1997). Overeducation and undereducation: Evidence for Portugal. Economics of Education Review, 16(2), 111–125. https://doi.org/10.1016/S0272-7757(96)00040-4
- Kleibrink, J. (2016). Inept or badly matched? — Effects of educational mismatch in the labor market. Labour (committee. on Canadian Labour History), 30(1), 88–108. https://doi.org/10.1111/labr.12065
- Korpi, T., & Tåhlin, M. (2009). Educational mismatch, wages, and wage growth: Overeducation in Sweden, 1974–2000. Labour Economics, 16(2), 183–193. https://doi.org/10.1016/j.labeco.2008.08.004
- Kupets, O. (2016). Education in transition and Job mismatch: Evidence from the skills Survey in Non-EU transition economies. The Journal of Comparative Economic Studies, 11, 117–150. http://www.ces.kier.kyoto-u.ac.jp/jces_11.html
- Lamo, A., & Messina, J. (2010). Formal education, mismatch and wages after transition: Assessing the impact of unobserved heterogeneity using matching estimators. Economics of Education Review, 29(6), 1086–1099. https://doi.org/10.1016/j.econedurev.2010.06.002
- Leuven, E., & Oosterbeek, H. ( (Eds.), 2011). Overeducation and mismatch in the labor market. In E. A. Hanushek, S. Machin, & L. Woessmann, Handbook of the Economics of education (Vol. 4, pp. 283–326). Elsevier.
- Levels, M., van der Velden, R., & Allen, J. (2014). Educational mismatches and skills: New empirical tests of old hypotheses. Oxford Economic Papers, 66(4), 959–982. https://doi.org/10.1093/oep/gpu024
- Lindqvist, E., & Vestman, R. (2011). The labor market returns to cognitive and noncognitive ability: Evidence from the Swedish enlistment. American Economic Journal: Applied Economics, 3(1), 101–128. https://doi.org/10.1257/app.3.1.101
- Liwiński, J., & Pastore, F. (2021). Are school-provided skills useful at work? Results of the wiles test. Research in Higher Education, 62, 72–97. https://doi.org/10.1007/s11162-019-09569-5
- McCrae, R. R., & Costa, P. T., Jr. (1999). A five-factor theory of personality. In L. A. Pervin & O. P. John (Eds.), Handbook of Personality: Theory and Research (2, pp. 139–153). The Guilford Press.
- McGee, A. D. (2015). How the perception of control influences unemployed job search. Industrial & Labor Relations Review, 68(1), 184–211. https://doi.org/10.1177/0019793914556245
- McGuinness, S. (2006). Overeducation in the labour market. Journal of Economic Surveys, 20(3), 387–418. https://doi.org/10.1111/j.0950-0804.2006.00284.x
- McGuinness, S. (2008). How biased are the estimated wage impacts of overeducation? A propensity score matching approach. Applied Economics Letters, 15(2), 145–149. https://doi.org/10.1080/13504850600721999
- McGuinness, S., Bergin, A., & Whelan, A. (2018). Overeducation in Europe: Trends, convergence, and drivers. Oxford Economic Papers, 70(4), 994–1015. https://doi.org/10.1093/oep/gpy022
- McGuinness, S., & Sloane, P. J. (2011). Labour market mismatch among UK graduates: An analysis using REFLEX data. Economics of Education Review, 30(1), 130–145. https://doi.org/10.1016/j.econedurev.2010.07.006
- Meroni, E. C., & Vera-Toscano, E. (2017). The persistence of overeducation among recent graduates. Labour Economics, 48, 120–143. https://doi.org/10.1016/j.labeco.2017.07.002
- Montt, G. (2017). Field-of-study mismatch and overqualification: Labour market correlates and their wage penalty. IZA Journal of Labor Economics, 6(2), 1–20. https://doi.org/10.1186/s40172-016-0052-x.
- Nguyen, C. M., Koenigs, M., Yamada, T. H., Teo, S. H., Cavanaugh, J. E., Tranel, D., & Denburg, N. L. (2011). Trustworthiness and negative affect predict economic decision making. Journal of Cognitive Psychology, 23(6), 748–759. https://doi.org/10.1080/20445911.2011.575773
- Palczyńska, M., & Świst, K. (2016). Measurement properties of non-cognitive scales in the Polish follow-up study on PIAAC (POSTPIAAC) (OECD Education Working Paper, No. 149).
- Palczyńska, M., & Świst, K. (2018). Personality, cognitive skills and life outcomes: Evidence from the Polish follow-up study to PIAAC. Large-Scale Assessments in Education, 6(1), 1–23. https://doi.org/10.1186/s40536-018-0056-z.
- Preuss, M., & Hennecke, J. (2018). Biased by success and failure: How unemployment shapes locus of control. Labour Economics, 53, 63–74. https://doi.org/10.1016/j.labeco.2018.05.007
- Rosenbaum, P. R., & Rubin, D. B. (1983). The central role of the propensity score in observational studies for causal effects. Biometrika, 70(1), 41–55. https://doi.org/10.1093/biomet/70.1.41
- Rubb, S. (2003). Overeducation in the labor market: A comment and re-analysis of a meta-analysis. Economics of Education Review, 22(6), 621–629. https://doi.org/10.1016/S0272-7757(02)00077-8
- Sattinger, M. (1993). Assignment Models of the distribution of earnings. Journal of Economic Literature, 31(2), 831–880.
- Sattinger, M. (2012, April). Assignment models and quantitative mismatches. In: Prepared for the expert workshop “Skill mismatch and firm dynamics: Integrating skills with the world of work”.
- Schultz, T. W. (1961). Investment in human capital. The American Economic Review, 51(1), 1–17.
- Sicherman, N., & Galor, O. (1990). A theory of career mobility. Journal of Political Economy, 98(1), 169–192. https://doi.org/10.1086/261674
- Sohn, K. (2010). The role of cognitive and noncognitive skills in overeducation. Journal of Labor Research, 31(2), 124–145. https://doi.org/10.1007/s12122-010-9082-5
- Strawiński, P., Majchrowska, A., & Broniatowska, P. (2018). Wage returns to different education levels. Evidence from Poland. Ekonomista, (1), 25–49.
- Thurow, L. C. (1972). Education and economic equality. The Public Interest, 28, 66–81.
- UNESCO Institute for Statistics. (2012). International standard classification of education: ISCED 2011. UNESCO Institute for Statistics.
- van der Velden, R., & van Smoorenburg, M. (2000). The measurement of overeducation and undereducation: self-report vs. job-analyst method. Les Cahiers du Lasmas, Serie Seminaire (pp. 9–17).
- Verdugo, R. R., & Verdugo, N. T. (1989). The impact of surplus schooling on earnings: Some additional findings. The Journal of Human Resources, 24(4), 629–643. https://doi.org/10.2307/145998
- Verhaest, D., & Omey, E. (2006). The impact of overeducation and its measurement. Social Indicators Research, 77(3), 419–448. https://doi.org/10.1007/s11205-005-4276-6
- Verhaest, D., & Omey, E. (2012). Overeducation, undereducation and earnings: Further evidence on the importance of ability and measurement error bias. Journal of Labor Research, 33(1), 76–90. https://doi.org/10.1007/s12122-011-9125-6
- Wincenciak, L. (2016). Educational mismatches and earnings in Poland: Are graduates penalised for being overeducated? . Ekonomia. Rynek, Gospodarka, Społeczeństwo, 46, 145–167.
Appendix
Figure A1. Propensity score distribution. Notes: The graphs present kernel densities (bandwidth=0.06) of the propensity score before and after matching, in the base and the full specification. The base specification includes only socio-demographics, and the full specification includes socio-demographics and cognitive and non-cognitive skills. aInternational Standard Classification of Education 1997 (UNESCO Institute for Statistics, Citation2012).
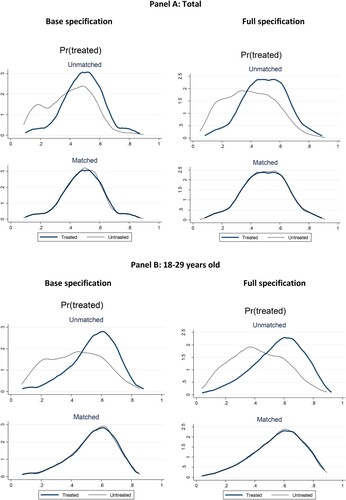
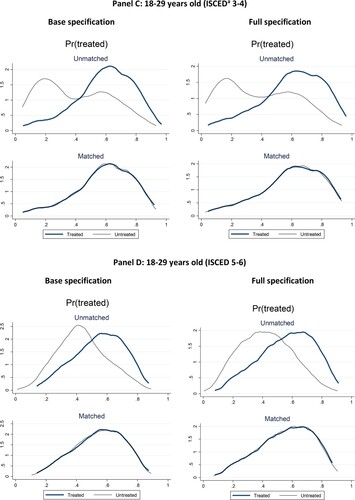
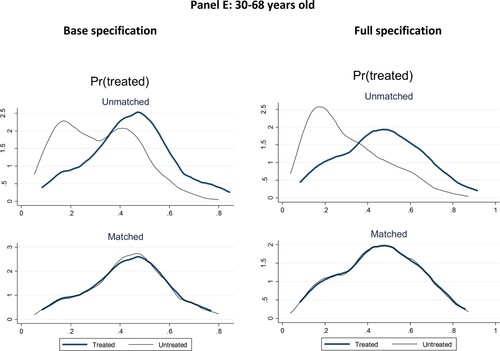
Table A1. Correspondence table between survey questions on the completed level of education and the required level of education and years of education.
Table A2. Differences in mean characteristics between overeducated and matched individuals, full results.
Table A3. Selection into overeducation (logit coefficients), full results.
Table A4. Matching quality.
Table A5. OLS results.
Table A6. OLS results: specification with an undereducation dummy.