
 ?Mathematical formulae have been encoded as MathML and are displayed in this HTML version using MathJax in order to improve their display. Uncheck the box to turn MathJax off. This feature requires Javascript. Click on a formula to zoom.
ABSTRACT
This study investigates the role of intergenerational mobility in explaining the native-immigrant income gap in Estonia. A rich registry dataset on yearly earnings and different background characteristics for the period of 2007–2017 is used. We find that an increase of 1 percentile in parent income rank is associated with on average 0.2 percentile increase in child income rank for both natives and second-generation immigrants. Results from a detailed Blinder-Oaxaca decomposition indicate that up to 21% of the gap between income ranks of second-generation immigrants and natives is related to differences in parental background. Once we control for education, family, residence and industry related choices, differences in the parental income rank account for around 8% of the overall gap. The results indicate that although the intergenerational income mobility is relatively high in Estonia both for natives and children of foreign-born, the native-immigrant earnings gap has not decreased for the second generation.
1. Introduction
The inferior labour market performance and consequent lower earnings of the first generation of immigrants compared to their native counterparts have long been documented in Europe (e.g. Beyer, Citation2016; Chiswick, Citation1980; Hammarstedt, Citation2003). However, in the long-term perspective of costs and benefits of migration, it is the labour market integration of the next generation that matters. If the first generation of immigrants are at a disadvantage in the host country’s labour market and the level of intergenerational mobility is low, then the disadvantages are likely to persist into the next generation. This study investigates the level of intergenerational mobility of immigrants and the role of parental background in explaining the earnings gap between natives and second-generation immigrants in Estonia.
The foreign-born and mainly Russian-speaking community in Estonia is shown to have lower labour market outcomes than natives (Leping & Toomet, Citation2008). The gap in earnings and in entering the employment exists also for the younger generation of the Russian-speaking minority (Leping & Toomet, Citation2008; Lindemann, Citation2014). As at least a fifth of the economic advantages and disadvantages are shown to be carried on from parents to their children in Western Europe and Scandinavia (see Corak, Citation2006 for an overview), we will expect that in Estonia the gap in earnings between second-generation immigrants and their native peers can be partly explained by the economic situation of their parents.
There are different reasons why economic advantages or disadvantages persist from one generation to the next, restricting intergenerational mobility. Becker and Tomes (Citation1979, Citation1986) develop theoretical models explaining how children’s economic outcomes depend on what resources their families have available to invest in their human and non-human capital. Besides investments in the child, parents can also pass on other endowments to the child, such as genetically determined characteristics, family reputation, connections, knowledge, skills, goals, etc. The inheritability of these endowments and the propensity to invest in one’s children affect the degree of intergenerational mobility. This approach is further developed by Solon (Citation2004), adapting it so as to better facilitate international comparisons of mobility as well as its development over time.
Empirical studies have confirmed the importance of family background to economic attainment. One channel of family influence is parents’ impact on the educational attainment of the child. For example, Landersø and Heckman (Citation2017) find that although intergenerational mobility is higher in Denmark than in the US, it is largely due to the country’s redistributive and wage-compressing policies, while the effect of family on educational attainment remains strong – educational mobility in the two countries is roughly equal despite the very different cost structures in the provision of education. This indicates that differences in parental financial resources for human capital investment is not the only factor in the intergenerational transmission of educational attainment. In addition, one must also consider differences in parental engagement – a number of studies have found that time spent on parenting activities in disadvantaged families is lower than in advantaged families (Guryan et al., Citation2008; Kalil et al., Citation2012; Mayer et al., Citation2019). Thus, one source of persistence of economic disadvantage from one generation to the next can be low parental endowments in human capital, resulting in their children having similarly low endowments.
At the same time, the income level of the first generation of immigrants might not reflect their whole level of ability, as they often face difficulties in the host country’s labour market due to lack of language skills or other country-specific human capital (Aydemir et al., Citation2009). If these challenges are less pronounced for the second generation of immigrants and the transmission of genetic ability is high, then intergenerational mobility might be higher among immigrants than among native population.
In addition to the inheritability of cognitive and human capital endowments, it is also important how these endowments are valued in the labour market. For example, if returns to education are high and parents with higher human capital endowments pass on more investment in human capital (as well as such characteristics as values and goals related to education), this could lead to less generational mobility (Corak, Citation2013). If the human capital endowments of immigrant and native parents differ systematically, then this could result in different degrees of intergenerational mobility. In addition, differences in cultural values could lead to parental investments in the child’s human capital to differ even for the same level of parental human capital.
Moreover, returns to education in the labour market could be different for immigrants and natives, leading to differences in parents’ incentives to invest in their children’s human capital. Indeed, Leping and Toomet (Citation2008) find that returns to education are lower for minority males than for ethnic Estonian males, while Ridala and Toomet (Citation2019) find that ethnic Russian men’s cognitive skills are undervalued in the labour market compared to that of Estonian men. There can be several different explanations for the differential valuation of ethnic groups’ characteristics in the labour market – an obvious possibility is discrimination (which has been demonstrated to exist in Estonia by correspondence studies, e.g. Lõgina, Citation2013; Uudmäe, Citation2012). Other possible explanations include hiring through different contact networks, which leads to a segregation of employees to Russian- or Estonian-language dominated firms (Leping & Toomet, Citation2008), or the pervasive effect of different language skills – insufficient official language skills can be expected to affect returns to education and other skills as well. Whatever its causes, lower valuation of ethnic minorities’ characteristics in the labour market can also be expected to lower their intergenerational economic mobility.
While the channel of inherited human capital endowment is important in intergenerational transmission of economic advantage, there are also others. Büchner et al. (Citation2012) demonstrate using data from the Netherlands that the social capital of the neighbourhood and parents’ cultural capital also play a role (although less important than that of cognitive skills and schooling). Other potential factors include the transmission of time preferences, which could affect economic behaviour: Brenoe and Epper (Citation2019) demonstrate substantial intergenerational transmission of patience, moderated by parenting values (authoritarian vs permissive parenting styles). Kreiner et al. (Citation2020) find that financial behaviour is to some extent inherited – the propensity to default on a loan is higher for people whose parents have a history of defaulting, even controlling for income and other important variables. Intergenerational transmission has also been demonstrated for portfolio choice (Knüpfer et al., Citation2017) and financial literacy (Brown et al., Citation2018).
This study asks two questions. First, how much of the earnings advantage or disadvantage is carried on from foreign-born and native parents to their children? Second, to what extent does parental background explain the difference in the earnings of these two groups? By answering these questions, the paper contributes to the literature in two main ways.
Firstly, although the labour market situation of the children of immigrants and how it relates to that of their parents have been investigated to an extent in the US (Borjas, Citation1992, Citation1993), Canada (Aydemir et al., Citation2009) and Europe (see e.g. Nielsen et al., Citation2003; Schnitzlein, Citation2012 for Denmark, Hammarstedt, Citation2009; Hammarstedt & Palme, Citation2012 for Sweden, Hermansen, Citation2016 for Norway), much less is known about the situation of second-generation immigrants in the former Soviet Union. We contribute to the literature by investigating the intergenerational earnings mobility of immigrants in a country, where the share of immigrant population is substantial. In 2014, 21% of the working age population (15–64) in Estonia was native-born with at least one foreign-born parent, making it the country with the highest share of second-generation immigrants in the European Union (Eurostat, Citation2021, Table lfso_14pcobp). The situation of second-generation immigrants in Estonia is somewhat exceptional compared to Western European countries: their parents, who arrived in Estonia as labour migrants during the Soviet era in the 1970s and 1980s, were not negatively selected in terms of their education (Lindemann & Saar, Citation2012). However, after the collapse of Soviet Union, they have experienced difficulties in finding positions matching their level of education, leading to lower returns from educational attainment (Leping & Toomet, Citation2008).
As discussed above, there are different reasons, why intergenerational earnings mobility might differ between natives and immigrants. On the one hand, ability channel would predict intergenerational earnings mobility to be higher for the mainly Russian-speaking second generation (if we assume that their parents are working on positions not reflecting their ability). However, earlier studies have shown that second-generation immigrants in Estonia are more likely to experience educational downward mobility, resulting in their average education level being lower than among Estonians (see Lindemann & Saar, Citation2012; Oberdabernig & Schneebaum, Citation2017). Thus, the ability channel might not result in higher mobility for second-generation immigrants than natives in our sample.
On the other hand, it is possible that second-generation immigrants are restricted by some of the same challenges as their parents, namely insufficient official language skills and limited contact networks, limiting their ability to reach higher education and higher-paying positions.Footnote1 Overall, this could lead immigrant population to have higher correlation between parents’ and children’s incomes (lower mobility) than natives.
Our second contribution results from investigating the role of parental background in explaining the native-immigrant income gap at the level of second generation. While the earlier studies have tried to explain the mean earnings differences between natives and immigrants by the differences in returns to education (Leping & Toomet, Citation2008), in cognitive skills (Ridala & Toomet, Citation2019), in official language skills (Lindemann, Citation2014; Toomet, Citation2011) and in the use of skills at work (Tverdostup & Paas, Citation2017), a significant proportion of the gap is still left unexplained. Parental education and occupation have been included to explain the education gap between Estonian and Russian youth (see Lindemann & Saar, Citation2012), however, to the best of our knowledge, parental income has not been in focus in earlier studies to explain the earnings gap between natives and immigrants in Estonia.
Earlier studies argue that the unexplained proportion of the gap could relate to social network segregation and hiring through different contact networks (e.g. Leping & Toomet, Citation2008). We argue that parental background may account for some of these network-specific effects as besides parental influence on human capital investments of the child, a proportion of social capital is also inherited from the parents (see e.g. Büchner et al., Citation2012). Social and ethnic networks shared by the different generations often results in the children of immigrants working in the same sectors as their parents (Kogan, Citation2007). The lack of proper contact networks would therefore lead both first-generation immigrants and their children at a disadvantage in the local labour market. Thus, we expect that parental background (manifested in earnings) will contribute to the explanation of the income rank gap even after controlling for the child’s educational attainment and employment sector.
We estimate the level of relative mobility for children of native and foreign-born parents and use the Oaxaca–Blinder decomposition to explain the differences in the mean income rank of children from native and foreign households. We find that the level of intergenerational mobility in Estonia is comparable to that of the Nordics, with an increase of 1 percentile in the parent income rank being associated with a 0.2 percentile increase in the child income rank on average. The level of intergenerational mobility is around the same magnitude for natives and for second-generation immigrants. As the income position is partly inherited from the parents, the differences in parental background explain 8% to 21% of the income rank gap between second-generation immigrants and natives. The results indicate that although intergenerational mobility is relatively high, the differences in earnings between natives and foreign-born do not decrease in their children’s generation.
The rest of the paper is organized as follows. Section 2 describes the data, while Section 3 introduces the methodological approach. The results are presented and discussed in Section 4 and Section 5 concludes the paper.
2. Data
This study uses a dataset that includes (among other characteristics) information on age, gender, level of education, region of residence, country of birth and yearly earnings of all people residing in Estonia in the period 2007–2017. In order to create the dataset, the Estonian Population Register first selected all individuals who had been issued personal identification codes before 2017. To this sample of individuals, relevant data was then linked from registries of the Tax and Customs Board, the Ministry of Education and Research, the Police and Border Guard Board, the Unemployment Insurance Fund, the Health Insurance Fund and the Social Insurance Board.Footnote2
The data is from the time period 2007–2017. As the longitudinal component of the data covers only 11 years, it is not possible to observe the income of a child’s parents at the time of their birth or early childhood, while retaining the ability to observe the income of the child in the later stages of his or her life. A solution used in this study is to focus on young people that have mostly completed their education and are entering the labour market (24–26 year olds in the year 2007). This allows us to look at their income 10 years after their labour market entry, when they are aged 34–36. This leaves sufficient time for potential inequalities to become apparent – based on the pseudo cohort data, 34–35 is roughly the age in the Estonian labour market at which the income relative to other age groups is the highest (Anspal et al., Citation2011).
This means that we observe the parental income not at the birth or early childhood of the child but when they are aged 24–26 instead. It is possible that the economic status of parents changes over that time. However, this change has some desirable characteristics. One might argue that for young parents (aged 20–25) the income at the time of their child’s birth would be misleading as a proxy for the economic living conditions during the whole of childhood. People in their early twenties still participate in studies that may be rewarded with higher income in the future, but hinder full-time participation in the labour market at the time and, thus, result in a lower income during studies. It might be wise to look at parents’ income at a more mature stage of their labour market experience.
Our focus is on the intergenerational economic mobility of individuals with native and with foreign-born parents. We construct a family type for each person based on the data available about the person’s parents in the Estonian Population Register. There are six possible outcomes based on the birth country of parents and the availability of data (see ). Altogether, in 2007, there were 58,244 persons in the age group 24–26. For 1736 persons in the age group 24–26 (in 2007) there is no information on their parents. For 12,085 persons, information on one of the parents is missing. The missing data on parents means that either there is no information on the parent at all or there is no information on their country of birth.
Table 1. Sample size by family type and the child’s age in 2007.
We are interested in the income position of the individuals who were 24–26 years old in 2007 (we refer to them as children) in two different earnings hierarchies. First, we find the earnings position of the child based on child’s parents’ income in 2007. We find parent income as a summed income of the mother and father of the child. Income is defined as a sum of pre-tax annual wages, income from self-employment and capital income (social welfare transfers are not included).Footnote3 We then rank the parents relative to other parents of the children in the same birth cohort. As we are interested in the parent income rank among the whole population of parents, we include all pairs of parents irrespective of their country of birth in this ranking (parents from all six family types are included). Based on this ranking we calculate the income percentile and the income quintile of the parents for each child (we refer to these variables as parent income rank and parent income quintile). Among the dataset we have 9% of children whose summed parent income is zero, meaning that both mother and father are either unemployed or inactive. As ranking the parents is arbitrary in the first 9 percentiles (all of them have zero income), we opt for ranking them all in the middle percentile of this interval, meaning that these children are ranked as having parent income in the 5th percentile.Footnote4
Second, we calculate the income position of the children 10 years later, in 2017, based on their own income. Child income is defined similarly as for the parents, including pre-tax annual wages, income from self-employment and capital income.Footnote5 The children are ranked based on their income relative to other children in the same birth cohort (similar to parents we include children from all six family types in this ranking). Again, we find the percentile and quintile in the income distribution for each child and refer to them as child income rank and child income quintile. Among the children, 9% are either unemployed or inactive having zero income. We use similar solution as for the parents, ranking them in the 5th income percentile.
Out of the 58,244 individuals who were aged 24–26 in 2007, 8323 (14.3%) were not in the dataset in 2017. This means that for these individuals the data provided by our source registers did not include any information on earned income, services used or benefits received in 2017. In all likelihood, most of them did not reside in Estonia in 2017.Footnote6 As there is no information on their income, we will have to exclude them and focus on the remaining 49,921 observations.
As we are interested in estimating the intergenerational mobility by the birth country of parents in the following analysis, we focus on individuals for whom information on the country of birth is available for both of their parents. Thus, we exclude 11,320 observations, in which case information on one or both of the parents is missing.Footnote7 This leaves us with 26,224 observations, where both of the parents are born in Estonia (we refer to them as natives), 5213 individuals, whose both parents are born abroad (we refer to them as foreign households) and 7164 observations, in which case one of the parents is born abroad and one is born in Estonia (we refer to them as mixed households).
The data sources and descriptions of variables included in the analysis are given in . Descriptive statistics for the variables included in the analysis are presented in in Appendix. The descriptive statistics for our sample confirm earlier observations in the literature for the second-generation immigrants in Estonia. The children from foreign households have on average lower income rank and come from a family with on average lower income rank. They also have on average lower educational attainment than natives. The second-generation immigrants are more likely to live in capital region Harjumaa and minority-populated region Ida-Virumaa and more likely to work in less knowledge-intensive services and low-technology manufacturing than natives. The children from mixed families remain between natives and children from foreign families in terms of most descriptive statistics. The table also reports educational attainment of mother and father (not included in the subsequent analysis),Footnote8 confirming that the first generation of immigrants were positively selected in terms of their education.
3. Methodology
To investigate the level at which economic advantages and disadvantage persist over generations, we first measure the level of relative intergenerational mobility. We follow the income percentile rank approach introduced by Chetty et al. (Citation2014) and applied for different ethnic groups by Chetty et al. (Citation2020), and calculate the income percentile rank of the child in his or her birth cohort and the income percentile rank of the parent among the parents of the same child cohort. To estimate the intergenerational mobility for each family type m we regress the income rank of the child on the rank of the parent:
(1)
(1) where
is the income percentile rank of the child i relative to that of other children in the same birth cohort,
is the income percentile rank of the parent of child i, m denotes the family type and
is the random error term with zero expectation. The parameters
and
denote the family-type-specific rates of absolute and relative income rank mobilities respectively.
and higher value of
indicates lower level of intergenerational mobility.
To investigate the channel of parental influence and to control for the choices related to family, education, employment sector and residence, a model with control variables is also estimated:
(2)
(2) where
is the parent income rank parameter,
is a vector of control variables,
is the vector of parameters corresponding to the control variables and the rest of the notation is as defined above.
To investigate the gap in the income percentile rank between natives and second-generation immigrants, this study adopts the Oaxaca–Blinder decomposition approach (Blinder, Citation1973; Oaxaca, Citation1973). The approach enables the differential in the mean earnings rank to be decomposed into two parts: the component related to differences in the average level of characteristics (endowment effect or explained component) and the component related to differences in returns to those characteristics (coefficient effect or unexplained component).
The native-foreign differential in the mean income percentile rank can be decomposed as follows:
(3)
(3) where
and
denote the mean income ranks of children from native and foreign families,
and
are the mean values of the explanatory variables for those two groups and
and
mark the estimated parameters from separate regression models for both of the family types. The first term expresses the differences in the mean income rank resulting from differences due to different endowments of observable characteristics and the second term reflects the difference in the mean outcome variable resulting from differences in the return to those characteristics.
Both terms can be further decomposed to investigate the contribution of each explanatory variable k:
(4)
(4)
(5)
(5)
For categorical regressors, the results of the detailed decomposition of the coefficient effect have been found to depend on the choice of the reference category (Oaxaca & Ransom, Citation1999). We opt for the solution of the identification problem by Yun (Citation2005) and compute the decomposition based on the effects that are expressed as deviation contrasts from the grand mean, the so-called ‘normalised’ effects.
4. Results
4.1. Descriptive evidence
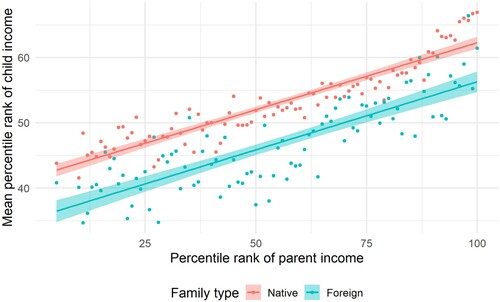
We measure the level at which the income positions are passed on to the children by using the rank-rank specification. We first focus on the individuals, whose both parents are born in Estonia (natives) and those, whose both parents are born abroad (children from foreign households), discussing the results for children with one native-born and one foreign-born parent (mixed families) later. presents the relationship between the mean child income rank versus the income percentile rank of their parents by the two groups. There is a clear linear relationship between the income rank of children and their parents – children from higher income families tend to have higher income themselves. We can also observe that for the same level of parental income the income rank of children from foreign households tends to be on average lower than the income rank of children from native households. Lastly, the figure indicates that the rise in parental income is associated with a rise of similar magnitude in the income of children for native and foreign households, i.e. the slopes of the linear regression are similar for natives and immigrants.
Figure 1. Mean child income rank versus parent income rank by family type. Note: The figure displays mean percentile income rank of the children versus the percentile income rank of their parents for different family types. As 9% of the parents in the sample have a summed income of zero, the percentiles 0–9 are gathered and displayed as one point per group, set at the 5th percentile. The results are robust to alternatives of setting the attributed value to 1st and 9th percentile.
Perhaps a more intuitive alternative to rank–rank plot is to measure the upward mobility by plotting the probabilities of reaching top cohort income quintile. displays the probability of children from each family quintile to reach the fifth income quintile of their peers by family type (see also ).
Figure 2. Probability of reaching cohort top income quintile by family type and parent income quintile.
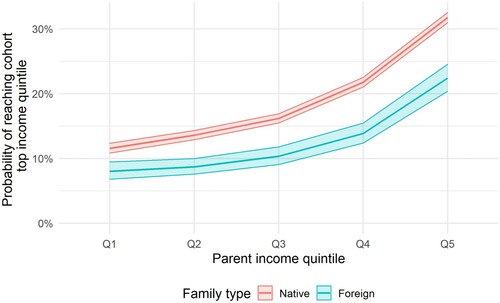
As expected, there is a positive correlation between the parent income quintile and the probability of reaching the fifth quintile of the cohort income distribution. For example, persons who were, based on their parents’ income, in the fifth quintile of income distribution in 2007 and whose both parents were born in Estonia, had 2.7 times higher probability of reaching the fifth quintile of the cohort income distribution in 2017 than their peers from the first quintile of the parent income distribution. For families where both parents were born abroad the children from fifth parent income quintile were around 2.8 times more likely to reach the top cohort quintile than those coming from the first quintile of the parent income distribution. This is roughly the same as for families where both parents were born in Estonia. However, there are significant differences between family types in probabilities of reaching the top cohort income quintile and these hold across all parent income quintiles.
Overall, the evidence so far indicates, that the disadvantage of having parents at the lower end of the income distribution compared to being a child of parents with a higher income is similar for natives and children from foreign households.
It can be noted though, that probability of (reaching) a high-income position is higher for natives than second-generation immigrants over the whole income distribution of parents. Thus, the difference in average income between second-generation immigrants and natives does not only result from second-generation immigrants coming from families with on average lower parental income (this would be the case, if the two curves would coincide). Rather, besides parental background other factors also play a role in creating the income differences at the level of second generation. As mentioned above these factors could include differences in cognitive skills, use of skills at work or lower returns to education.
One heavily discussed matter is the role of language skills. We try to test for the role of official language proficiency by reporting the results for mixed families. The assumption is that children with at least one native-born parent would be fluent in Estonian. and in Appendix report the results for mixed families. Children from mixed families have a slightly steeper slope of the rank-rank curve, therefore the relationship between parent and child income seems to be slightly stronger for mixed families than for two other family types. At the lower levels of parental income, the children from mixed families perform similarly to children from foreign families, while at the top of the parental income distribution children with one native-born and one foreign-born parent are closer to the children of natives. These results indicate that part of the difference between family types could result from differences in language skills, although we cannot rule out other explanations, such as children from mixed families having better social networks or attending better quality schools.
4.2. Regression and decomposition results
In the previous subsection, we examined the relationship between the income position of the child and the income position of the parents. In the next section, we present the results of regression and decomposition analyses to uncover the role of parental background in the economic success of the child and examine to what extent differences in parental background explain the gap between children from foreign and native households.
4.2.1. How much does parental income matter in the labour market success of the child?
The descriptive evidence above indicates that some proportion of the parental income position is carried on to the children. We next study it more formally by estimating the relative mobility parameter . First row of presents the estimated relative mobility parameter
from equation (1). The rate of relative mobility indicates that for around 1 percentile higher income rank of the parents, children of natives have on average around 0.2 percentile higher income rank. In other words, around a fifth of the income (dis)advantage is carried on to the next generation. The rate of relative mobility is similar for children with both foreign-born parents. Children from mixed families have a slightly higher point estimate for the rate of relative mobility, however this difference is not statistically significant.
Table 2. Estimated rate of relative mobility .
To check for the robustness of the results, relative mobility parameter is estimated using the income rank of the father and income rank of the mother and reported in the 2nd and 3rd row of . Relationship between mother income rank and child income rank is slightly stronger than the relationship between father income rank and child income rank for native and mixed families. In both cases, the estimates are lower than in the case of the combined parent income rank. This is to be expected, while studying mother and father income separately does not give advantage to the three studied groups for whom the information on both parents is available over the families for whom information on one parent is missing. Overall, the main conclusions remain the same, as the rate of relative mobility is similar for native, foreign and mixed families.
The estimates from could be seen as the maximum estimates of parental influence on the labour market outcomes of the child. As explained above, one of the main channels of parental influence on the child’s economic success is parental investment in the child’s human capital. Thus, including the educational attainment of the child would be expected to decrease the estimated parental income rank coefficient . Parental investment in some specific skills of the child could also impact the child’s employment sector. In addition, we could assume that parental background would be, to some extent, associated with the child’s residence region and family-related choices.
In order to study the channels of parental influence, models controlling for family, residential, educational and occupational covariates are estimated by equation (2) and reported in the 2nd to 6th row of . The relative mobility parameter from equation (1) is reported in the 1st row for reference. Adding the gender and the number of children only modestly reduces the relationship between the earnings of two generations. Adding the region of residence lowers the parent income rank parameter further and the most significant drop can be seen once the education is added in. Lastly, including the employment sector also has a slight effect on the parent income rank parameter.
Table 3. Estimated parent income rank parameter .
Once the educational, occupational and residential choices are accounted for, the relationship between child and parent income rank is around 40%, 60% and 50% of the initially estimated intergenerational mobility for native, foreign and mixed families, respectively. These results indicate that although part of parental influence is carried on through the impact of parental background on the child’s education and choice of residential region, around half of the relationship between the earnings of two generations still remains significant after controlling for these factors.
Note that once we control for different background characteristics, does not reflect the pure relative intergenerational mobility anymore. While different channels (e.g. human capital transmissions) are now controlled for, the parameter of parent income rank reflects only part of the relationship between parents and children. Thus, although statistically significant (small in magnitude) differences in the estimates of the parent income rank parameter can be detected between the native, foreign and mixed families in case of a model with all the covariates, they should not be interpreted as differences in the rate of relative mobility between different family types.
4.2.2. How much of the immigrant-native income rank gap does parental background explain?
So far, we have shown, that the parental income rank impacts the income position of the child. The relationship between parental and child income positions is of the same magnitude for children from native households and those from foreign households.
These results indicate that if the parents of second-generation immigrants are worse off than comparable natives, then a proportion of their disadvantage will persist into the next generation. shows the income rank distribution of the second generation and their parents by family type.Footnote9 The children of foreign-born are less represented in the higher percentiles of the income distribution and more represented in the lower income ranks compared to the natives. The same holds for their parents in comparison with native parents. Comparing the mean income ranks of children and parents by family type, it is found that foreign parents have 7.6 points lower mean income rank than native parents, while children from foreign households have 7.7 points lower income rank than children from native households (). Overall, these results confirm that the parents of second-generation immigrants are indeed economically less successful than the parents of native households. Their children also lag behind native children with an income rank gap very similar to that of their parents’ generation.
Figure 3. Income rank distribution of the second generation and their parents by family type.
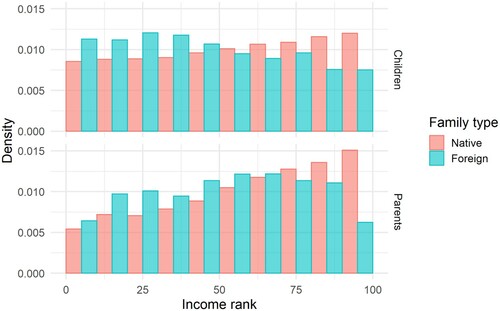
Table 4. Income statistics for the second generation and their parents.
We next examine how much of the native-immigrant income rank gap could be explained by the differences in the average characteristics of parental background, the differences in the magnitude of influence of that background and how much is explained by other factors.
To investigate the characteristics that could explain the gap, the Blinder–Oaxaca decomposition is applied as outlined in equation (3). shows the results for the native-foreign gap decomposition. We report the results for two different model specifications. In the baseline model, we only include parent income rank and exogenous variables that cannot be influenced by parental background. In the full model, we include variables related to family, education, residential region and employment, which are likely to be influenced by parents to some extent.
Table 5. Overall decomposition results.
According to the baseline model, the mean income rank of children from native households is estimated to be on average 7.7 percentile points higher than the mean income rank of children from foreign households. This is identical to the raw difference in rank reported in . 1.7 points (22%) of the gap is explained by the differences in endowments (characteristics), while 6.0 points (78%) can be assigned to the differences in coefficients (returns to characteristics).
The full model reports similar estimates, finding the gap of 7.8 points, where 21% (1.65/7.84) is explained by the differences in the average characteristics of the two groups and 79% (6.18/7.84) by the differences in the returns to those characteristics.
In the baseline model, the differences in the parent income rank account for ca 1.6 points of the gap and for most of the endowment effect (). Thus, when assuming that the child’s choices in education, family planning, region of residence and the employment sector are fully influenced by their parents, the differences in parental background explain around 95% (1.61/1.70) of the endowment effect or 21% of the gap.
Table 6. Endowment detailed decomposition results.
Once controlling for educational, residential, occupational and family choices, differences in the parent income rank account for ca 37% (0.61/1.65) of the endowment effect or 8% of the overall gap. The estimates of parent income rank from baseline and full model can be seen as minimum and maximum estimates of the explanatory power of parental background.
Based on earlier evidence we can assume that a large proportion of parental influence is mechanized through the impact parents have on their children’s education. In addition, it is probable that parents influence occupational and, to a smaller extent, residential and family-related choices of their children. We will next comment briefly on those aspects.
Educational attainment is the biggest part of the endowment effect, as differences in education levels explain 80% of the endowment effect and 17% of the overall gap. Children from foreign families tend to have on average lower education levels than natives, which seems to hinder their success in the labour market (see also ).
The region of residence tends to contribute to the gap negatively as children from foreign households are overrepresented in the capital region of Harjumaa, where labour market conditions are more favourable, and underrepresented in other regions. At the same time, there is an overrepresentation of second-generation immigrants in the mainly minority populated region of Ida-Virumaa, which has a positive effect on the gap. However, the summed effect of regional location is still negative.
Differences in the employment sector do not have a substantial role in explaining the gap as a summed effect. However, contributions of some specific sectors account for larger proportion of the gap. Namely, the underrepresentation in the knowledge-intensive services sector contributes to the gap positively, while the overrepresentation in low-technology manufacturing contributes to the gap negatively.
The difference in the number of children seems to contribute to the gap around 2% negatively for females (−0.12/7.84) and 4% positively for males (0.32/7.84).
The female-male proportion does not differ considerably by different family types, consequently, it does not have a significant role in explaining the gap.
The differences described so far result from differences in the average characteristics of second-generation immigrants and natives. However, as shown above, ca 79% of the gap in the mean income rank is due to differences in coefficients, i.e. differences in the returns to characteristics included in the model and due to differences in unobserved characteristics (represented by differences in the constant variable).
The returns to parental income ranks are not statistically significantly different in the baseline model (see ). Thus, in the baseline model, most of the coefficient effect is left unexplained.
Table 7. Coefficient detailed decomposition results.
Full model specification shows that differences in the return to parental income rank contribute negatively to the gap, accounting for ca 22% of the gap. Thus, we can assume that for otherwise similar individuals second-generation immigrants benefit more from the rise in parental income than children from native households.
We again focus on the different channels of parental influence. First, we detect that education is not a significant part of the coefficient effect, i.e. children from native and foreign households do not have significantly different returns to education (see also estimated coefficients of the regression models for the two groups in ).
Differences in the returns to industry, however, contribute to the gap significantly. The return to employment in specific sectors accounts for 3.5 percentiles or 44% of the overall gap. Overall, natives tend to earn more on average in most sectors. This difference is most evident in the sectors of low knowledge-intensive and knowledge-intensive services, while it is marginal in the high-technology manufacturing sector. At the same time, employment in the primary sector seems to be more beneficial for second-generation immigrants than for natives.
The difference in the returns to region of residence accounts for around 29% of the gap explained by coefficients (23% of the overall gap). Natives tend to benefit more from living in the capital region, while second-generation immigrants have higher returns to living in other regions of Estonia than natives. There seems to be no significant difference in returns to living in Ida-Virumaa, which might be explained by the small share of native population in the region and the relative unimportance of official language skills in determining labour market success in this region.
Other factors included in the models account for only a small proportion of the gap. 46% of the gap in the coefficients (or 36% of the overall gap) seems to stem from the differences in the returns to characteristics not included in our model (represented by the differences in the constant variable).
4.2.3. Discussion of results
Our estimates of relative intergenerational mobility are in the range similar to earlier findings for the Nordics. In the case of Estonia, about 20% of any economic advantage or disadvantage is passed on from parent to a child. Corak (Citation2016) reports roughly the same level of mobility for Finland and Norway, while Italy, UK and the US have a much higher estimate of intergenerational earnings elasticity (around 0.5). Our estimates show higher mobility for the mainly Russian-speaking immigrant population in Estonia compared to intergenerational mobility reported for Russians in Russia (Borisov and Pissarides (Citation2020) estimate intergenerational earnings correlation of around 0.35 for Russia). Thus, although these two groups might share some similarities in how common values are transmitted from parents to children (see Borjas, Citation1992 for the idea of ethnic capital), the differences in the institutional background in the two countries have resulted in different mobility levels for the groups.Footnote10 Overall, our results indicate that Estonia is a relatively mobile society. The fundamental changes in the society 30 years ago have not (yet) led to a high degree of income position inheritability.
We report second-generation immigrants to have around the same level of relative intergenerational mobility in Estonia as natives. The ability transmission channel combined with parents working on positions not matching their level of education, might in some cases lead to higher intergenerational mobility for immigrants. As expected, we do not detect this relationship for the case of second-generation immigrants in Estonia. In addition, our results indicate, that while second-generation immigrants share some of the challenges in the labour market with their parents (lower language skills, segregated contact networks), these do not lead second-generation immigrants to be any more restricted by the income levels of their parents than natives would be.
The level of mobility is relatively high both for natives and second-generation immigrants. However, comparing the earnings of natives and immigrants we find the earnings gap between natives and foreign-born to be of the same magnitude for both the first and the second generation. Thus, it appears that the same level of disadvantage between natives and immigrants has persisted into the next generation.
Our focus is on the role of differences in parental background in explaining that gap. Parental resources are shown to have a clear role in explaining the gap. After including the educational attainment of the child, the explanatory power of parental income decreases substantially, confirming the importance of intergenerational transmissions in human capital attainment. Children from lower income families tend to have lower educational attainment, which in turn decreases the income level of the children in their adulthood.
While we do find differences in education level between natives and second-generation immigrants to explain part of the gap, contrary to earlier findings for Estonia (Toomet, Citation2011), we do not detect differences in the returns to education. However, we do find returns to employment in specific sectors to be higher for natives than second-generation immigrants. It is possible that formal education levels do not reflect the whole range of cognitive skills needed and used at work. Ridala and Toomet (Citation2019) find the Russian-speaking minority in Estonia to have on average lower skills, however, inclusion of skill measures only has a moderate effect in explaining the gap. In addition, Tverdostup and Paas (Citation2017) find that including the level of skills and the use of skills at work along demographics, occupational variables and other controls explains the immigrant-native wage gap in almost all the EU member states, whereas significant differences remain in the case of Estonia. Thus, differences in skills and returns to skills, could only explain small amount of the native-immigrants earnings gap in the case of Estonia.
Part of the relationship between the income of children and parents is mediated through the region of residence. Different returns to region account for a considerable proportion of the gap in income rank between natives and second-generation immigrants. We find that the regional returns disadvantage is especially significant in relation to living in the capital city of Tallinn, where second-generation immigrants do not manage to benefit as much from the labour market conditions as natives. These results are in line with findings of Lindemann (Citation2014) and Leping and Toomet (Citation2008), who also find considerable differences in returns to living in the capital region. While official language skills are less essential in the minority-populated Ida-Virumaa and the second generation that lives outside of the capital or Ida-Virumaa has generally better official language skills, we would expect language skills to be one of the reasons for regional disadvantage. However, Lindemann (Citation2014) finds that ethnic Russians experience a disadvantage in the capital region’s labour market irrespective of their language skills. The results of Toomet (Citation2011) and Kivi et al. (Citation2020) indicate that although official language skills are important for the lower end of the wage distribution for avoiding unemployment, they are not associated with finding better positions. Thus, differences in language skills might not be the decisive factor behind different returns to regions.
While the above-described channels of human capital and regional background are important in creating the relationship between the income of parents and children, theoretical considerations and earlier empirical evidence (see e.g. Büchner et al., Citation2012) lead us to assume that some proportion of parental influence could be related to parents’ social capital. Indeed, we find that although including the educational attainment and sector of employment of the child reduces the estimate of parental contribution considerably, the contribution of parental background remains significant in explaining the gap between natives and children of foreign-born. Controlling for other factors, differences in parental income account for around 8% of the gap in income rank. While we cannot rule out other factors, that could lead to this relationship (e.g. lower official language skills, labour market discrimination or lower motivation of both generations of immigrants), it is likely that at least part of this gap is related to poorer quality of social networks of the foreign-born parents that would leave both themselves and their children at a disadvantage in the host country’s labour market.Footnote11
5. Conclusions
The aim of this study is to investigate the role of intergenerational mobility in explaining the labour market success of second-generation immigrants in Estonia and the income gap between children from native and immigrant households.
We show that although first-generation immigrants were positively selected at their arrival in Estonia, changes in the society have led them to fare worse in the labour market than natives. We also find that their children, i.e. second-generation immigrants, are at lower income positions than their native counterparts.
The level at which children in Estonia inherit their income positions from their parents appears to be similar to that of Scandinavian countries. Relative intergenerational mobility does not differ considerably for natives and immigrants.
As the income position is partly inherited from parents, it is shown that differences in parental background explain up to 21% of the gap in income rank between second-generation immigrants and natives. In the large part, parental influence operates through the effect on their child’s educational attainment and choice of employment sector. We find that while controlling for these factors the remaining parental influence accounts for around 8% of the gap.
In conclusion, although we would assume the second generation to have a higher level of country-specific human capital and their assimilation into the labour market be smoother than their parents, in reality the positions of second-generation immigrants in the income hierarchy have not improved compared to their parents. Second-generation immigrants are still faring worse in the labour market than natives. As we have identified in this study, this is partly a consequence of the fact that the parental ‘legacy’ of second-generation immigrants is poorer than that of the locals and it is passed on to the children of foreign-born with similar intensity than to the locals.
Acknowledgements
The authors are grateful for the helpful comments and suggestions of two anonymous reviewers. We would like to thank the participants of the PhD summer school of Doctoral School in Economics and Innovation in Narva-Jõesuu in 2021 and the participants of the Paris School of Economics summer school for their advice and comments. The authors take sole responsibility for all errors and omissions.
Disclosure statement
No potential conflict of interest was reported by the author(s).
Additional information
Funding
Notes on contributors
Laura Helena Kivi
Laura Helena Kivi works as a researcher at the Estonian Center for Applied Research (CentAR). She is working towards a PhD degree in Economics at the University of Tartu. Her research areas cover the issues of labour market integration of migrants and regional labour markets.
Janno Järve
Janno Järve works as a senior researcher at the Estonian Center for Applied Research (CentAR). He received his PhD from the University of Tartu in 2011. His main areas of expertise are financial analysis, labour market and education.
Sten Anspal
Sten Anspal is senior researcher at the Estonian Center for Applied Research (CentAR). He received his PhD from the University of Tartu in 2015. He works on topics related to the labour market, social protection, and health.
Marko Sõmer
Marko Sõmer works as a researcher at the Estonian Center for Applied Research (CentAR). His main research areas are social protection, labour market and education.
Indrek Seppo
Indrek Seppo is senior researcher at the Estonian Center for Applied Research (CentAR). His main areas of expertise are labour market, financial analysis and social protection.
Notes
1 For the children, these challenges are likely to arise from the separation of the Estonian school system to Estonian- and Russian-language track.
2 The construction of the dataset was a part of the project ‘Migration dependency and integration challenges for Estonia, employers, communities and educational system’ that was approved by the Estonian Research Council and funded from the RITA programme that was supported by the European Regional Development Fund [project number RITA1/01-03-11].
3 Our focus is on analysing if children from foreign-born families have equal opportunities in the labour market. Thus, we exclude social welfare transfers to have a clear signal of the labour market success of the child.
4 The results are robust to alternatives of defining the unemployed and inactive parents as having the lowest income percentile rank of the interval (rank is defined as 1) or the highest income percentile rank of the interval (rank is defined as 9).
5 Note that capital income is earned only by 5% of children from native families, 2% of children from foreign families and 3% of children from mixed families, thus the results are expected to be robust to exclusion of the capital income.
6 The observations that were not included in the dataset in 2017 have on average lower parental income rank by around 5 percentiles. The average education level at the age of 24–26 (in year 2007) of this group is also lower than the average education level of those who remain in the dataset in 2017. Thus, it is possible that this group represents emigration of low-skilled workers. While exclusion of these observations can somewhat downward bias the estimates of intergenerational income persistence, the comparison of the mobility estimates between different family types (those with native and with foreign-born parents) is likely to be less affected by this exclusion, as differences of similar magnitude in parental income rank and child education (leavers being negatively selected in terms of these variables) can be noted within each of the studied family type.
7 The excluded observations where one parent is born in Estonia and the birth country of other is unknown are very similar in their characteristics to the children from mixed families in our sample. The children from two other groups with missing parental information have on average lower incomes than the observations included in the final sample. While the latter two family types form are relatively small group (2% of all the children who were in the dataset in 2017 in case information on both parents is missing and 5% in case one parent is foreign-born and information on the other is missing), excluding them should not lead to a significant bias in our estimates.
8 We find that once we control for parental income the differences in parental education or differences in return to parental education do not have a significant role in explaining the difference in income rank gaps between natives and children of foreign-born. Thus, the results reported in this study focus on income rank of the parents and do not include parental education.
9 Note that we exclude mixed families from the following analysis. The difference in mean income ranks is smaller between children from mixed families and natives compared to native-foreign income rank gap (5.5 percentile points compared to 7.7 percentile points). However, the role of parental income rank in explaining the native-mixed income rank gap is of the same magnitude than for the native-foreign income rank gap (differences in parental income rank explain 8%–21% of the gap in both cases). The results for mixed families are available from the authors on request.
10 We thank anonymous reviewer for suggesting this comparison.
11 We have no direct way to test how much of the social capital is carried on from parents to children, however we know that about 14% of the children from native and foreign households in our dataset work in the same sector (measured at NACE Rev. 2 level 1) as their parents.
References
- Anspal, S., Järve, J., Kallaste, E., Kraut, L., Räis, M.-L., & Seppo, I. (2011). The cost of school failure in Estonia. Technical report. https://centar.ee/uus/wp-content/uploads/2011/03/2012.03.29-Cost-of-school-failure-in-Estonia-final-technical.pdf.
- Aydemir, A., Chen, W.-H., & Corak, M. (2009). Intergenerational earnings mobility among the children of Canadian immigrants. The Review of Economics and Statistics, 91(2), 377–397. https://doi.org/https://doi.org/10.1162/rest.91.2.377
- Becker, G. S., & Tomes, N. (1979). An equilibrium theory of the distribution of income and intergenerational mobility. Journal of Political Economy, 87(6), 1153–1189. https://doi.org/https://doi.org/10.1086/260831
- Becker, G. S., & Tomes, N. (1986). Human capital and the rise and fall of families. Journal of Labor Economics, 4(3, Part 2), S1–S39. https://doi.org/https://doi.org/10.1086/298118
- Beyer, R. (2016). The labor market performance of immigrants in Germany. IMF Working Papers, 16(6), 1–38. https://doi.org/https://doi.org/10.5089/9781498376112.001
- Blinder, A. S. (1973). Wage discrimination: Reduced form and structural estimates. The Journal of Human Resources, 8(4), 436–455. https://doi.org/https://doi.org/10.2307/144855
- Borisov, G. V., & Pissarides, C. A. (2020). Intergenerational earnings mobility in post-Soviet russia. Economica, 87(345), 1–27. https://doi.org/https://doi.org/10.1111/ecca.12308
- Borjas, G. J. (1992). Ethnic capital and intergenerational mobility. The Quarterly Journal of Economics, 107(1), 123–150. https://doi.org/https://doi.org/10.2307/2118325
- Borjas, G. J. (1993). The intergenerational mobility of immigrants. Journal of Labor Economics, 11(1), 113–135. https://doi.org/https://doi.org/10.1086/298319
- Brenoe, A. A., & Epper, T. (2019). Parenting values moderate the intergenerational transmission of time preferences. IZA Discussion Papers, 12710.
- Brown, M., Henchoz, C., & Spycher, T. (2018). Culture and financial literacy: Evidence from a within-country language border. Journal of Economic Behavior & Organization, 150, 62–85. https://doi.org/https://doi.org/10.1016/j.jebo.2018.03.011
- Büchner, C., Cörvers, F., Traag, T., & van der Velden, R. (2012). How do education, cognitive skills, cultural and social capital account for intergenerational earnings persistence? Evidence from the Netherlands. ROA Research Memoranda, 7. https://doi.org/https://doi.org/10.26481/umaror.2012007.
- Chetty, R., Hendren, N., Jones, M. R., & Porter, S. (2020). Race and economic opportunity in the United States: An intergenerational perspective. Quarterly Journal of Economics, 135(2), 711–783. https://doi.org/https://doi.org/10.1093/qje/qjz042
- Chetty, R., Hendren, N., Kline, P., Saez, E., & Turner, N. (2014). Is the United States still a land of opportunity? Recent trends in intergenerational mobility. American Economic Review, 104(5), 141–147. https://doi.org/https://doi.org/10.1257/aer.104.5.141
- Chiswick, B. R. (1980). The earnings of white and coloured male immigrants in Britain. Economica, 47(185), 81–87. https://doi.org/https://doi.org/10.2307/2553169
- Corak, M. (2006). Do poor children become poor adults? Lessons from a cross-country comparison of generational earnings mobility. In J. Creedy, & G. Kalb (Eds.), Dynamics of inequality and poverty (Research on economic inequality) (pp. 143–188). Emerald Group Publishing Limited. https://doi.org/https://doi.org/10.1016/S1049-2585(06)13006-9
- Corak, M. (2013). Income inequality, equality of opportunity, and intergenerational mobility. Journal of Economic Perspectives, 27(3), 79–102. https://doi.org/https://doi.org/10.1257/jep.27.3.79
- Corak, M. (2016). Inequality from generation to generation: The United States in comparison. IZA Discussion Papers, 9929.
- Eurostat. (2021, March 25). Population by sex, age, migration status, country of birth and country of birth of parents. https://appsso.eurostat.ec.europa.eu/nui/show.do?dataset=lfso_14pcobp&lang=en.
- Guryan, J., Hurst, E., & Kearney, M. (2008). Parental education and parental time with children. Journal of Economic Perspectives, 22(3), 23–46. https://doi.org/https://doi.org/10.1257/jep.22.3.23
- Hammarstedt, M. (2003). Income from work among immigrants in Sweden. Review of Income and Wealth, 49(2), 185–203. https://doi.org/https://doi.org/10.1111/1475-4991.00082
- Hammarstedt, M. (2009). Intergenerational mobility and the earnings position of first-, second-, and third-generation immigrants. Kyklos, 62(2), 275–292. https://doi.org/https://doi.org/10.1111/j.1467-6435.2009.00436.x
- Hammarstedt, M., & Palme, M. (2012). Human capital transmission and the earnings of second-generation immigrants in Sweden. IZA Journal of Migration, 1(4), 1–23. https://doi.org/https://doi.org/10.1186/2193-9039-1-4
- Hermansen, A. S. (2016). Moving up or falling behind? Intergenerational socioeconomic transmission among children of immigrants in Norway. European Sociological Review, 32(5), 675–689. https://doi.org/https://doi.org/10.1093/esr/jcw024
- Kalil, A., Ryan, R., & Corey, M. (2012). Diverging destinies: Maternal education and the developmental gradient in time with children. Demography, 49(4), 1361–1383. https://doi.org/https://doi.org/10.1007/s13524-012-0129-5
- Kivi, L. H., Sõmer, M., & Kallaste, E. (2020). Language training for unemployed non-natives: Who benefits the most? Baltic Journal of Economics, 20(1), 34–58. https://doi.org/https://doi.org/10.1080/1406099X.2020.1740403
- Knüpfer, S., Rantapuska, E. H., & Sarvimäki, M. (2017). Why does portfolio choice correlate across generations? Bank of Finland Research Discussion Paper, 25.
- Kogan, I. (2007). Continuing ethnic segmentation in Austria. In A. F. Heath, & S. Y. Cheung (Eds.), Unequal chances: Ethnic minorities in Western labour markets (pp. 103–142). Oxford University Press. https://doi.org/https://doi.org/10.5871/bacad/9780197263860.003.0003
- Kreiner, C. T., Leth-Petersen, S., & Willerslev-Olsen, L. C. (2020). Financial trouble across generations: Evidence from the universe of personal loans in Denmark. The Economic Journal, 130(625), 233–262. https://doi.org/https://doi.org/10.1093/ej/uez046
- Landersø, R., & Heckman, J. J. (2017). The Scandinavian fantasy: The sources of intergenerational mobility in Denmark and the US. The Scandinavian Journal of Economics, 119(1), 178–230. https://doi.org/https://doi.org/10.1111/sjoe.12219
- Leping, K.-O., & Toomet, O. (2008). Emerging ethnic wage gap: Estonia during political and economic transition. Journal of Comparative Economics, 36(4), 599–619. https://doi.org/https://doi.org/10.1016/j.jce.2008.08.002
- Lindemann, K. (2014). The effects of ethnicity, language skills, and spatial segregation on labour market entry success in Estonia. European Sociological Review, 30(1), 35–48. https://doi.org/https://doi.org/10.1093/esr/jct020
- Lindemann, K., & Saar, E. (2012). Ethnic inequalities in education: Second-generation Russians in Estonia. Ethnic and Racial Studies, 35(11), 1974–1998. https://doi.org/https://doi.org/10.1080/01419870.2011.611890
- Lõgina, J. (2013). Eesti ja venepäraste nimede tähtsus tööle kandideerimisel teenindussektoris [The importance of ethnic Estonian and Russian names in applying to jobs]. MA thesis.
- Mayer, S. E., Kalil, A., Oreopoulos, P., & Gallegos, S. (2019). Using behavioral insights to increase parental engagement the parents and children together intervention. Journal of Human Resources, 54(4), 900–925. https://doi.org/https://doi.org/10.3368/jhr.54.4.0617.8835R
- Nielsen, H. S., Rosholm, M., Smith, N., & Husted, L. (2003). The school-to-work transition of 2nd generation immigrants in Denmark. Journal of Population Economics, 16(4), 755–786. https://doi.org/https://doi.org/10.1007/s00148-003-0164-z
- Oaxaca, R. (1973). Male-female wage differentials in urban labor markets. International Economic Review, 14(3), 693–709. https://doi.org/https://doi.org/10.2307/2525981
- Oaxaca, R. L., & Ransom, M. R. (1999). Identification in detailed wage decompositions. The Review of Economics and Statistics, 81(1), 154–157. https://doi.org/https://doi.org/10.1162/003465399767923908
- Oberdabernig, D., & Schneebaum, A. (2017). Catching up? The educational mobility of migrants’ and natives’ children in Europe. Applied Economics, 49(37), 3701–3728. https://doi.org/https://doi.org/10.1080/00036846.2016.1267843
- Ridala, S., & Toomet, O. (2019). Wage gap in an ethnically segmented labor market: The role of cognitive skills. Eastern European Economics, 57(1), 20–30. https://doi.org/https://doi.org/10.1080/00128775.2018.1524713
- Schnitzlein, D. D. (2012). How important is cultural background for the level of intergenerational mobility? Economics Letters, 114(3), 335–337. https://doi.org/https://doi.org/10.1016/j.econlet.2011.11.007
- Solon, G. (2004). A model of intergenerational mobility variation over time and place. In M. Corak (Ed.), Generational income mobility in North America and Europe (pp. 38–47). Cambridge University Press. https://doi.org/https://doi.org/10.1017/CBO9780511492549.003
- Toomet, O. (2011). Learn English, not the local language! Ethnic Russians in the Baltic states. American Economic Review, 101(3), 526–531. https://doi.org/https://doi.org/10.1257/aer.101.3.526
- Tverdostup, M., & Paas, T. (2017). The role of cognitive skills and their use at work in explaining the immigrant-native wage gap. University of Tartu - Faculty of Economics and Business Administration Working Paper Series, 104.
- Uudmäe, E. (2012). Eesti-ja venepäraste nimede roll tööle kandideerimise protsessis tallinna näitel [The role of ethnic Estonian and Russian names in the process of applying to jobs: The example of Tallinn]. MA thesis.
- Yun, M.-S. (2005). A simple solution to the identification problem in detailed wage decompositions. Economic Inquiry, 43(4), 766–772. https://doi.org/https://doi.org/10.1093/ei/cbi053
Appendix
Figure A1. Mean child income rank versus parent income rank by family type (mixed families included). Note: The figure displays mean percentile income rank of the children versus the percentile income rank of their parents for different family types. As 9% of the parents in the sample have a summed income of zero, the percentiles 0–9 are gathered and displayed as one point per group, set at the 5th percentile. The results are robust to alternatives of setting the attributed value to 1st and 9th percentile (see also explanations on p. 7).
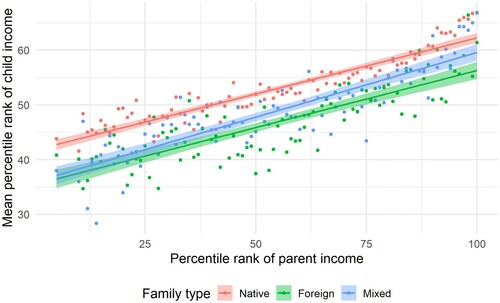
Figure A2. Probability of reaching cohort top income quintile by family type and parent income quintile (mixed families included).
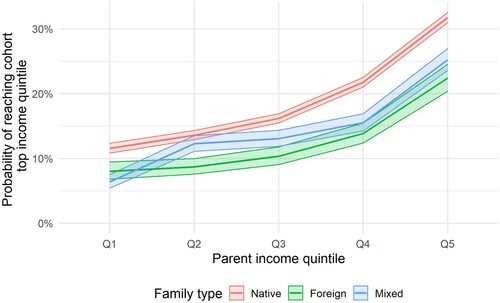
Table A1. Variable description.
Table A2. Descriptive statistics.
Table A3. Probability of reaching cohort top income quintile, by family type and parent income quintile.
Table A4. Linear regression results of the full model – explanatory factors on child income rank.