
 ?Mathematical formulae have been encoded as MathML and are displayed in this HTML version using MathJax in order to improve their display. Uncheck the box to turn MathJax off. This feature requires Javascript. Click on a formula to zoom.
ABSTRACT
In this paper we contribute to the literature on determining the real exchange rate by using models that incorporate structural breaks and nonlinearities. We estimate cointegrated dynamic ordinary least squares regressions and quantile regressions. We find that the estimated coefficients for the EU members from central and eastern Europe are different to those for the other member states. We also find that the models are different before and after the crisis that started in 2008, and this affects the outcome of the long-run equations for the EU15 + Cyprus and Malta.
1. Introduction
A long-standing academic debate has discussed the relationship between the exchange rate and macroeconomic fundamentals. In consequence, purchasing power parity (PPP) and the long-run determinants of real exchange rates (RERs) have probably been researched more than any other topic in international finance. This is because the empirical fulfilment of PPP can be understood as a measure of economic integration (Wei & Parsley, Citation1995), while the RER is related to the competitiveness of a country. The theory of PPP in its absolute version states that the RER between two currencies should be equal to one, so it should be possible to buy a similar basket of goods in two different countries for the same amount of money when prices are translated into a common currency. A less restrictive version of PPP called relative PPP establishes that there should be a co-movement between the nominal exchange rate and the price ratio between the home and foreign markets. Many authors, like Taylor (Citation2002) among others, have established that if the PPP condition holds, it does so only in the long-run.
In consequence, analysis of PPP relies on using tests for the order of integration and cointegration techniques, looking for cointegration between prices and nominal exchange rates so as to assess whether the RER is a mean-reverting process. However, many authors have established that in general the PPP hypothesis does not hold even in the long run, and only qualified versions of PPP are accepted when structural breaks and nonlinear models are introduced (Christidou & Panagiotidis, Citation2010; Cuestas, Citation2009, etc.).
So if the RER is a nonstationary variable, the next step is to analyse its cointegrating relationships with the long-run fundamentals. It should be remembered that the RER affects the competitiveness of an economy, and studying its evolution over time can give us policy insights into how it can be improved. A departure from parity implies that the relative competitiveness of a country has changed. Competitiveness is a key factor for enhancing economic growth, especially for members of the Economic and Monetary Union (EMU). However, most of our target countries except Czech Republic and Croatia have to act under the common commitments given by the Euro Plus Pact and the Macroeconomic Imbalance Procedure of the Six Pack (Gabrisch & Staehr, Citation2015).Footnote1
The main contribution of this paper is to analyse the relationship between the RERs of the EU28 and their main fundamentals, accounting for changes in the form of structural breaks, the impact of appreciations or depreciations, and the possibility that the actual values of the RER may condition the relationships and the estimated coefficients as non-linearities. Non-linearities in the speed of mean reversion have been well researched. As established by Taylor and Peel (Citation2000) and Cuestas (Citation2009) among many others, the sign of the movements may affect how the RER reacts to shocks. In this paper we go a step further with this consideration and analyse how appreciations and depreciations may affect the relationship between the RER and its fundamentals. These three points have largely been ignored in the recent literature, even though analysing them is important as they may not only affect the econometric results, but may also have policy implications.
It must be remembered that the EU28 is a diverse group of countries with different degrees of economic integration and development, and, as shown in , the RERs of these target countries have evolved in quite different ways (Cunado, Citation2011). The western EU countries show swings in the RER without any clear pattern of appreciating or depreciating, but the financial crisis from 2008 onwards and the debt crisis had an impact on their RERs (Cuestas et al., Citation2014). The RERs of the central and eastern European countries (CEECs), which are Bulgaria, Croatia, Czech Republic, Estonia, Hungary, Latvia, Lithuania, Poland, Romania, Slovakia and Slovenia show a clear upward trend until 2008 because of the Balassa-Samuelson effect (Balassa, Citation1964; and Samuelson, Citation1964) and the dynamic Penn effect (Degler & Staehr, Citation2019).
Figure 1. RER EU28.
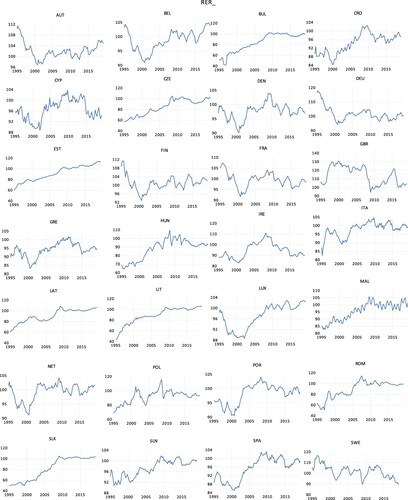
This paper consequently uses quarterly observations to estimate an RER determination model for the full period 1995Q1 – 2019Q2 in order to give an understanding of the overall effect on the RER of movements in the fundamentals. We then analyse whether there is a structural break in the relationship between the RER and its fundamentals from 2008 onwards. This date is chosen for the break on the notion that 2008 is the first year when the EU28 and the countries of the euro area suffer a drop in their combined GDP. It is from the beginning of 2008 that the euro area of 19 members suffers the first drop in its joint GDP.Footnote2 The hypothesis to test is that the beginning of the Great Recession of 2008–2009 and the aftermath of the Global Financial Crisis of 2007–2008 affected the evolution of competitiveness in relation to its fundamentals. In addition, we also test the hypothesis that appreciations and depreciations of the RER may also affect the relationship between the RER and its fundamentals. Along the same lines, we finally estimate quantile regressions to analyse whether the actual values of the RER condition the relationship with the fundamentals. It is logical to assume that since these countries have also had different exchange rate regimes, the results should also differ for different groups.Footnote3
The remainder of the paper is organized as follows. In section 2, we present a literature review on the subject, and in section 3 we summarize the modelling strategy and the econometric methods. In section 4, we present the results, and finally the last section concludes.
2. Brief literature review
The literature on the determinants of the RER is so extensive that a full paper could be devoted to summarizing the most relevant contributions. Here we provide only a brief summary of the main determinants. As established in Cuestas et al. (Citation2019) ‘the long-run relationship is usually obtained using either time series or panel cointegration techniques. Ideally, the selection of these fundamentals should be based on a model for determining exchange rates’. The starting point of theoretical models is the Mundell-Fleming model further developed by Frenkel and Razin (Citation1996), which accounts for short-run price stickiness in a stochastic set up. Following in this vein, the Obstfeld and Rogoff (Citation1995) theoretical model is applied by Aguirre and Calderón (Citation2005), who use as fundamentals productivity, net foreign assets, the terms of trade, and government expenditure. A similar list of fundamentals is proposed by Lane and Milesi-Ferretti (Citation2004), who emphasize the role of net foreign assets, and Galstyan and Lane (Citation2009), who highlight the importance of government spending and investment for the evolution of the RER. The importance of the terms of trade in determining the RER has been established by Neary (Citation1988), Amano and van Norden (Citation1995 and Citation1998), and Benigno and Thoenissen (Citation2003) among others.Footnote4
Another important strand of the literature on the relationship between the exchange rate and economic fundamentals considers the present-value models of the exchange rate. Whether exchange rates are linked to observable macroeconomic fundamentals has long been discussed in the literature. Early evidence argued against such a link in the work of Meese and Rogoff (Citation1983), which led to what was called the disconnect puzzle. More recent findings indicate though that the link might actually exist, and Engel and West (Citation2005) show that the apparently weak relationship between exchange rates and fundamentals can be reconciled within a standard present-value model of asset prices, arguing that a wide range of exchange rate models imply that the exchange rate is determined by the present discounted value of expected future economic fundamentals. They were the first to provide evidence that exchange rates do indeed predict fundamentals, by showing that a wide range of exchange rate models imply that the exchange rate is determined by the present discounted value of expected future economic fundamentals, and not by current or lagged expectations.Footnote5 In addition, Engel et al. (Citation2008) present evidence that exchange rates incorporate news about future macroeconomic fundamentals, as the models imply, demonstrating that they might well be able to account for observed exchange-rate volatility, by examining the response of exchange rates to announcements of economic data.
More recently Sarno and Schmeling (Citation2014) test the prediction of present-value models in a sample of 35 currency pairs ranging over the years from 1900 to 2009. They show that future macro fundamentals drive current exchange rates, by finding that exchange rates have strong and significant predictive power for nominal fundamentals like inflation, money balances, and nominal GDP. Finally, Chen and Chou (Citation2015) investigate the role of permanent and transitory shocks in explaining exchange rates and economic fundamentals. Their results suggest for the six EU countries that they examine over a period of two centuries that transitory shocks dominate exchange rate fluctuations, while permanent shocks dominate the variations in economic fundamentals, as with the shock of the crises of 2008 and 2009.
Following models used in Taylor and Peel (Citation2000), Carmona-González and Díaz-Roldán (Citation2016), Cuestas et al. (Citation2019) and others, we also estimate the models to account for asymmetries of this type by using interaction dummies for periods of depreciation and appreciation. As a novelty we interact the fundamentals with dummy variables for the periods before and after 2008. Finally, to complete our three different approaches the equations are estimated as quantile regressions in order to assess whether various misalignments from parity affect the relationship between the RER and its fundamentals.
3. The econometric modelling
Our model builds upon the long-run equation proposed by Cuestas et al. (Citation2019), who estimate RER models for CEECs using the fundamentals proposed by Berg and Miao (Citation2010) and Vieira and MacDonald (Citation2012). Our model follows the established trends and models the exchange rate not only as a function of real per capita GDP like in Rodrik (Citation2008), but also with other determinants such as the terms of trade, government consumption, or the current account. The determinants Vieira and MacDonald (Citation2012) use include openness, terms of trade, government consumption, investment, and income.Footnote6 This is consistent with the Obstfeld and Rogoff (Citation1995) model, augmented with a public sector. The exchange rate equation obtained from this model is log-linear. Cuestas et al. (Citation2019) use the interest rate differential, but we use the current account as a proportion of GDP instead. We believe that the current account expresses capital inflows or outflows better than the interest rate differential does, particularly if the Tradeable-Non-tradeable (TNT) model for RER determination is applied, where the current account is positively related to the interest rate differential (see also Comunale, Citation2017).Footnote7 To the best of our knowledge there has not been any attempt to update the data to 2019 to include or account for structural breaks in the models that estimate changing parameters.
As we will see later, the variables in the model are all I(1), and we look for cointegration and estimate them with dynamic ordinary least squares (DOLS). For this reason we analyse the cointegrating relationship between the RER (q) and its main fundamentals, which are real GDP (y), the current account as a proportion of gross domestic product (GDP) (ca); real government consumption (gco); real gross fixed capital formation as a proxy for investment (gfcf); openness (op); and the terms of trade (tot). We not only estimate the equation for the full panel, but we also separate the panel into the CEECs and the other EU members, which are the EU15Footnote8 plus Cyprus and Malta. This is done because, as established in Christopoulos et al. (Citation2012), the capacity of a country to attract international lending may affect the relationship between the RER and its fundamentals. Our RER specification is as follows:
(1)
(1) The signs of the coefficients depend on whether the tradeable or the non-tradeable sector dominates. For instance,
is expected to have a positive sign (Benigno & Thoenissen, Citation2003), but
should be negative if expenditure on non-tradeables carries a higher weight and positive if tradeables dominate, meaning it depends on the trade intensity and on the primary and secondary income accounts.
,
and
should be positive if demand shocks dominate (Galstyan & Lane, Citation2009), but if spending happens proportionally more in the more productive tradeable sector, then
should be positive and
,
and
negative. The sign of
is expected to be negative, as the RER depreciates because of imports of cheaper consumption products and exports of more competitive ones.
The relationship between the RER and its fundamentals is analysed using the DOLS estimations proposed by Stock and Watson (Citation1993). We account for the heterogeneity of the panel using pooled, pooled weighted, and group mean estimations. Kao and Chiang (Citation2001) establish that DOLS outperforms fully modified least squares and ordinary least squares for estimating panel cointegrated relationships. DOLS relies upon single equation models, with leads and lags of the I(1) explanatory variables in first differences to correct for endogeneity problems. This is how the base for equation (1) is estimated.
As explained in the introduction we also account for the possibility of time varying parameters by estimating a broken equation, with different slopes for the periods before 2008Q1 and after 2007Q4. We do this by interacting two dummy variables with the fundamentals given in equation (1), to estimate the following equation:
(2)
(2) where d2008 is a dummy variable that takes the value 1 for dates from the beginning of the sample until 2007Q4 and 0 otherwise and d2008on takes the value 1 from 2008Q1 onwards and 0 otherwise.
As mentioned above, we also account for asymmetric effects depending on whether the RER experienced a depreciation or an appreciation in the preceding period. This is an extension of the idea that the RER has asymmetric speed of mean reversion as in Taylor and Peel (Citation2000) among many others. We estimate the equation:
(3)
(3) where apre is a dummy variable that takes the value 1 if the RER appreciated in t-1 and 0 otherwise, and depre is a dummy variable that takes the value 1 if the RER depreciated in t-1 and 0 otherwise.
Finally, we estimate quantile regressions, which allow us to obtain estimated coefficients that are conditional on the quantiles of the values of the dependent variable. This approach allows us to consider not only models that represent the mean values, but also those with different values for the RER. The benefit of this is that we can estimate the long-run equation for a relatively large deviation from the mean. We can then consider regressions between the independent variable x and the dependent one y, conditional on y, so Qq(y|x). The quantile q splits the data into the proportions q below and 1-q above. In quantile regressions, the coefficients are obtained so that they minimize a sum that gives asymmetric penalties (1-q)|ei| for over-prediction and q|ei| for under-prediction, where ei is the model prediction error. In other words, the method for estimating the coefficients for a given quantile minimize the following function:
(4)
(4)
4. Empirical analysis
The data for the EU28 countries are downloaded from Eurostat and consist of seasonally unadjusted quarterly series for the log of the real effective exchange rate, q, using the consumer price index for the 37 main industrial-country trading partners with an increase indicating an appreciation in real terms; the current account as a proportion of GDP, ca; the log of real government consumption, gco; the log of real gross fixed capital formation, gfcf; the log of openness defined as the sum of exports and imports as a proportion of GDP, op; the log of the terms of trade measured as the ratio between export prices and import prices, tot; and the log of real GDP, y, for our target EU28 countries. The period covered is from 1995Q1 to 2019Q2 with a few exceptions that make the dataset an unbalanced panel.Footnote9
The panel unit root tests of Levin et al. (Citation2002), Bai and Ng (Citation2004) and Pesaran (Citation2007) suggest that the variables are I(1), and the Kao (Citation1999) and Westerlund (Citation2007) panel cointegration test rejects the null of no cointegration; see the appendix.
All the models include three centred seasonal dummies to account for seasonal effects in the variables. The leads and lags for the DOLS estimations have been obtained using the Bayesian Schwarz information criterion, but are omitted to save space. All the DOLS equations have been estimated using heteroskedasticity and autocorrelation corrected (HAC) Newey-West residuals.
presents the results of equation (1) for all the countries, the CEECs, and the EU15 + 2 group, where the two are Cyprus and Malta, using three different methods of pooled, pooled weighted, and group mean to treat the heterogeneity. Our results are in line with those obtained in previous papers such as Comunale (Citation2017) and Cuestas et al. (Citation2019). The results for all the EU28 countries show that although the current account is significant at the 10% level with the pooled estimations, it is not significant with the other two methods. Government consumption does not seem to affect the real exchange rate with the pooled estimations and pooled weighted ones, but it has a positive and significant effect in the group mean estimations. Openness and the terms of trade have a positive and significant effect on the real exchange rate, while real GDP only shows a significant and positive effect in the pooled weighted regressions.
Table 1. DOLS long-run estimated.
More interesting results are obtained when we split the panel into two groups, which gives us more explanatory power. The effect of the current account appears to be positive and significant for the CEECs with two of the three estimation methods, but it is negative and significant for the EU15 + 2 group only in the pooled weighted method. This can be interpreted as a sign of how important the CA balance is for the RER and consequent competitiveness. Government consumption is only significant for the EU15 + 2 countries, which may be because private consumption and investment has been the driving factor in the growth in the CEECs. Openness also carries a different sign in the CEECs from that in the EU15 + 2 countries. This may be a consequence of the types of capital flow and imported consumption products and services in the two groups. Finally, the estimated coefficient for real income is only significant for the EU15 + 2 countries. The negative sign implies that supply-side growth, through positive technology shocks, is more predominant, as the countries become more competitive when income increases.
In we show the results for the periods before and after 2008 separately, and in we present the equality tests for the coefficients comparing the periods before and after 2008. From this table we see that the null of equality of the residuals before and after 2008 is strongly rejected in all cases. The adjusted determination coefficients in are higher than those in , which shows evidence of a structural break at the beginning of the Great Recession. The signs and significance of the coefficients during the period before 2008Q1 are very similar to those shown in , but the variables lose their significance after the crisis. This can be explained by the RER becoming much flatter and, in many cases, more volatile, which may be because of the effect of the crisis on expectations and on the exchange rate market. This suggests it is possible that most of the movements of the RER respond to the expectations for the economic fundamentals. The public sector seems to carry some weight for the RER movements of the EU15 + 2 countries, whereas it becomes significant for the CEECs after 2008. This shows that the government measures during the crisis period and beyond had a positive impact on rebalancing the RER.
Table 2. DOLS long-run estimates break 2008
Table 3. DOLS long equality restrictions break 2008 model.
and show the estimations that account for the effect of a depreciation or appreciation in the RER in the previous period. First, the equality tests show that any difference between the coefficients is mild, at the 10% level for all countries, and it is only clearly significant for the EU15 + 2 and for the group mean estimations. This means the results stand in some contrast to those of Carmona-González and Díaz-Roldán (Citation2016), who find that the asymmetric effect tends to disappear within a monetary union (De Grauwe & Sénégas, Citation2004). In the group mean estimations, we find that the coefficient for the current account and government consumption becomes larger when we observe a depreciation in the previous period. It is possible that in periods with depreciations the RER is more sensitive to sudden stops of capital outflows than when the currency is appreciating.Footnote10
Table 4. DOLS long-run estimates asymmetric model.
Table 5. DOLS long equality restrictions, asymmetric model.
Finally, we present the results of the quantile regressions, which also contain three centred seasonal dummies and country fixed effects. In we present the graphs for the estimated coefficients for the different quantiles and in we present the equality tests for the coefficients in the 0.25, 0.5 and 0.75 quantiles. From the Wald test we find that the hypothesis of equality is rejected, and that the main differences come from the coefficient of openness. We observe that the effect of openness becomes weaker the more the RER is appreciated. This may be because of the type of products that are imported as the RER becomes stronger for a country, which normally goes hand in hand through the Balassa-Samuelson effect with a higher degree of development. shows tests for U effects, which seem to be present in this case.
Figure 2. Quantile estimates.
Note: The outer red lines represent 95% confidence intervals.
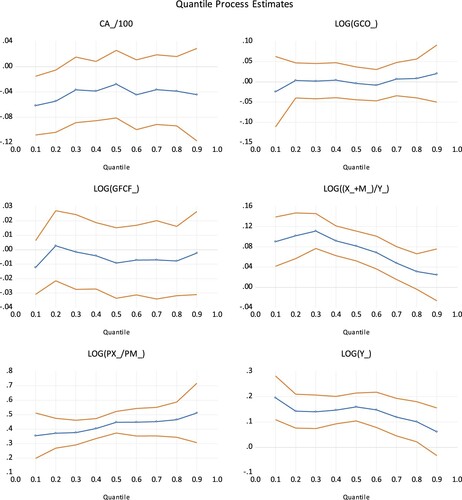
Table 6. Equality test quantile regression.
Table 7. Symmetry test quantile regression.
and show the estimated coefficients for the different quantiles and equality tests for the CEECs group. The results indicate that the effect of the terms of trade and income on the RER seems to be very sensitive to how far the RER is misaligned from parity, which is in line with Berg and Miao (Citation2010). Of particular note, the results suggest that the effect of the terms of trade becomes stronger the more the RER appreciates, while the result is the opposite for real income. shows that there is symmetry between the 0.25 and 0.75 quantiles.
Figure 3. Quantile estimates CEECs.
Note: The outer red lines represent 95% confidence intervals.
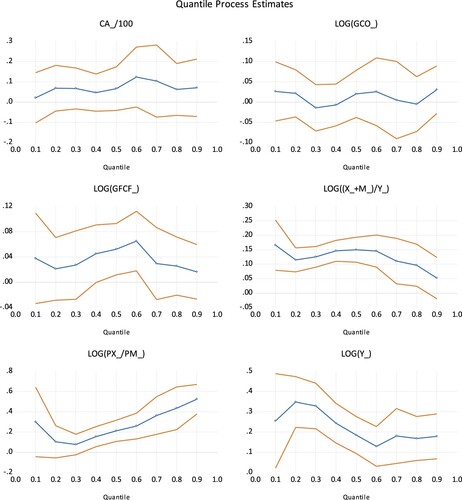
Table 8. Equality test quantile regression CEECs.
Table 9. Symmetry test quantile regression CEECs.
In and and we present the estimated coefficients and the equality and symmetry tests for the EU15 + 2 countries. Overall, we see that the coefficients differ across quantiles for the current account, investment, and income. This can be an indication that if the misalignment from parity is smaller, the impact and the equilibrium is of a smaller magnitude through the current account, government consumption and investment. The effect of the current account and investment seems to become less negative for quantiles between 0.2 and 0.5, whereas the coefficient for real income becomes more negative as the quantiles increase. The coefficient on the income can be explained through the expected increased pressure on appreciation as income or growth increases.
Figure 4. Quantile estimates EU15 + 2.
Note: The outer red lines represent 95% confidence intervals.
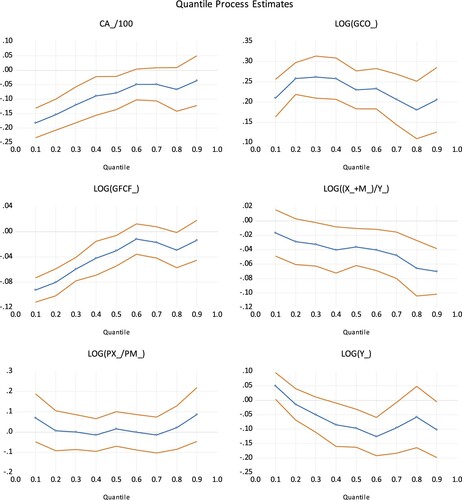
Table 10. Equality test quantile regression EU15 + 2.
Table 11. Symmetry test quantile regression EU15 + 2.
5. Conclusion
In this paper we set out to analyse how the relationship between the EU28’s RERs and their main fundamentals changed in the quarterly data for the period 1995Q1–2019Q2.
We estimate a DOLS cointegrated relationship allowing for breaks in 2008Q1 and conditional on appreciations and depreciations of the real exchange rate. We find that separating the central and eastern European countries from the remaining EU15 + 2 leaves them with different coefficients, and that the Great Recession did indeed have an impact on how the main RER fundamentals affect the long-run equilibrium RER. We also find evidence of asymmetric effects for the EU15 + Cyprus and Malta, since the coefficients are different when the RER appreciates and depreciates. Our quantile regressions show that the magnitude of the RER misalignment from parity also affects the long run.
Acknowledgements
Juan Carlos Cuestas gratefully acknowledges University Jaume I project UJI-B2019-15 and Generalitat Valencia project AICO2021/005. Mercedes Monfort are grateful for support from the University Jaume I research project UJI-B2020-16.
Disclosure statement
No potential conflict of interest was reported by the author(s).
Additional information
Notes on contributors
Juan Carlos Cuestas
Juan Carlos Cuestas graduated in Business Administration from the University of Valencia (Spain) and gained an MSc from the University of Nottingham and a PhD from Jaume I University (Spain). He previously worked at the University of Alicante (Spain), Nottingham Trent University, the University of Sheffield (UK) and Tallinn University of Technology (Estonia) as an academic. In 2016 he joined the research group of the Bank of Estonia. He is currently a Distinguished Research Professor at the Jaume I University accredited as a full professor by the Spanish national agency of quality assessment and accreditation (ANECA). He has participated in a number of research projects funded by the Spanish Ministry of Science and Technology on economic integration and international economics. Juan-Carlos' research interests lie primarily in the area of applied macroeconometrics and in particular the economic integration of European transition countries and development economics.
Mercedes Monfort
Mercedes Monfort is Lecturer of Economics at the Jaume I University in Castellón. She holds a degree in Business Administration and Management and a MSc in Local Development Management. She received his doctorate in Economics from the Jaume I University with the university's Award for Excellence. She has published papers in Economic Modelling, Energy, Open Economies Review, Empirica, Emerging Markets, Finance and Trade, Plos One, Empirica, and in the International Journal of Economics and Finance among others. She has visited the University of Adelaide, The City College of New York and the University of Bath among others.
Bojan Shimbov
Bojan Shimbov obtained his Ms. in Integration and International Trade from the University of Jaume I in 2009. Immediately after in 2010, he started his Ph.D. research activities as part of the project ‘Design of a Logistics Platform Network in Spain’, financed by the Ministry for Transport of the Spanish Government. In 2012 he started working as an economist in the World Bank. He has co-authored fourteen chapters in eight books published by the World Bank and the International Monetary Fund (IMF). He has also co-authored chapters in twenty Regional Economic Reports for the Western Balkan countries. In addition to the above, he has co-authored the trade and integration chapter in the flagship report Western Balkan Systematic Country Diagnostic published in 2018, and also co-authored the export performance and competitiveness chapter in the Serbia Country Economic Memorandum 2.0 strategy. His research topics cover the areas of macroeconomics and international economics, in particular global value chains, trade and integration, as well as public economics, with a focus on fiscal policy and efficacy of spending.
Notes
1 This mechanism targets several measures of competitiveness, highlighting the need to analyse the main fundamentals and potential changes in competitiveness. Central banks in most EU countries produce dedicated policy reports on competitiveness, highlighting the importance of monitoring it.
3 We gratefully acknowledge an anonymous reviewer for pointing this out.
4 For applications see Gil-Alana et al. (Citation2008) and Meshulam and Sanfey (Citation2019) among many others.
5 In a similar vein, Engel and West (Citation2006) find that deviations of real exchange rates from their steady state values forecast inflation and output gaps.
6 A comprehensive literature review on these determinants can be found in Cuestas et al. (Citation2019).
7 We should note that the current account includes short-run flows in addition to long-run ones.
8 The EU15 OECD definition comprises the following 15 countries: Austria, Belgium, Denmark, Finland, France, Germany, Greece, Ireland, Italy, Luxembourg, Netherlands, Portugal, Spain, Sweden, and the United Kingdom.
9 For Austria, gco, gfcf, tot and y start in 1996Q1. For Belgium, the ca starts in 2003Q1. For Bulgaria, the ca starts in 1998Q1. For Croatia, all the variables expect the rer start in 2000Q1. For Cyprus, the ca starts in 2008Q1. For Denmark, the ca starts in 2005Q1. For France, the ca starts in 1999Q1. For the UK, the ca starts in 1997Q1. For Greece and Ireland, the ca starts in 2002Q1. For Italy, the gco, gfcf, op, tot and y start in 1996Q1. For Latvia, the ca starts in 2000Q1. For Malta, all the variables start in 2000Q1, except for the rer (1995Q1) and the ca (2004Q2). For the Netherlands, the ca starts in 2003Q2. For Poland and Slovakia, the ca starts in 2004Q1. For Portugal, the ca starts in 1996Q1. For Romania, the ca starts in 1999Q1. For Sweden, the ca starts in 1995Q2.
10 A similar finding is shown in Sarno and Schmeling (Citation2014), who show that countries whose currencies strongly depreciated against the USD in the past see a significantly higher effect on economic fundamentals.
References
- Aguirre, Á., & Calderón, C. (2005). Real exchange rate misalignments and economic performance. Bank of Chile working paper no. 315. https://core.ac.uk/download/pdf/6642514.pdf.
- Amano, R. A., & van Norden, S. (1995). Terms of trade and real exchange rates: The Canadian evidence. Journal of International Money and Finance, 14(1), 83–104. https://doi.org/10.1016/0261-5606(94)00016-T
- Amano, R. A., & van Norden, S. (1998). Oil prices and the rise and fall of the US real exchange rate. Journal of International Money and Finance, 17(2), 299–316. https://doi.org/10.1016/S0261-5606(98)00004-7
- Bai, J., & Ng, S. (2004). A PANIC attack on unit roots and cointegration. Econometrica, 72(4), 1127–1177. https://doi.org/10.1111/j.1468-0262.2004.00528.x
- Balassa, B. (1964). The purchasing-power parity doctrine: A reappraisal. Journal of Political Economy, 72(6), 584–596. https://doi.org/10.1086/258965
- Benigno, G., & Thoenissen, C. (2003). Equilibrium exchange rates and supply-side performance. The Economic Journal, 113(486), C103–C124. https://doi.org/10.1111/1468-0297.00113
- Berg, A., & Miao, Y. (2010). The real exchange rate and growth revisited: The washington consensus strikes back? IMF Working Papers WP/10/58.
- Carmona-González, N., & Díaz-Roldán, C. (2016). Is the exchange rate an adjustment mechanism? International Advances in Economic Research, 22(1), 107–108. https://doi.org/10.1007/s11294-015-9557-5
- Chen, S.-S., & Chou, Y.-H. (2015). Revisiting the relationship between exchange rates and fundamentals. Journal of Macroeconomics, 46(2015), 1–22. https://doi.org/10.1016/j.jmacro.2015.07.004
- Christidou, M., & Panagiotidis, T. (2010). Purchasing power parity and the European single currency: Some New Evidence. Economic Modelling, 27(5), 1116–1123. https://doi.org/10.1016/j.econmod.2010.03.008
- Christopoulos, D. K., Gente, K., & León-Ledesma, M. A. (2012). Net foreign assets, productivity and real exchange rates in constrained economies. European Economic Review, 56(3), 295–316. https://doi.org/10.1016/j.euroecorev.2011.10.001
- Comunale, M. (2017). Dutch disease, real effective exchange rate misalignments and their effect on GDP growth in EU. Journal of International Money and Finance, 73, 350–370. https://doi.org/10.1016/j.jimonfin.2017.02.012
- Cuestas, J. C. (2009). Purchasing power parity in central and Eastern European countries: An analysis of unit roots and nonlinearities. Applied Economics Letters, 16(1), 87–94. https://doi.org/10.1080/13504850802112252
- Cuestas, J. C., Gil-Alana, L. A., & Staehr, K. (2014). Government debt dynamics and the global financial crisis: Has anything changed in the EA12? Economics Letters, 124(1), 64–66. https://doi.org/10.1016/j.econlet.2014.04.014
- Cuestas, J. C., Mourelle, E., & Regis, P. J. (2019). Real exchange rate misalignments in CEECs: have they hindered growth? Empirica. Retrieved July 25, 2019 from http://link.springer.com/10.1007/s10663-019-09454-5.
- Cunado, J. (2011). Structural breaks and real convergence in OPEC Countries. Journal of Applied Economics, 14(1), 101–117. https://doi.org/10.1016/S1514-0326(11)60007-X
- Degler, M., & Staehr, K. (2019). Price convergence and the dynamic Penn effect in Central and Eastern Europe. Economic change and restructuring, Forthcoming. https://link.springer.com/article/10.1007/s10644-019-09248-6 (October 25, 2019).
- De Grauwe, P., & Sénégas, M.-A. (2004). Asymmetries in monetary policy transmission: Some implications for EMU and Its Enlargement. JCMS: Journal of Common Market Studies, 42(4), 757–773. https://doi.org/10.1111/j.0021-9886.2004.00528.x
- Engel, C., Mark, N. C., & West, K. D. (2008). Exchange rate models are not as bad as you think. In D. Acemoglu, K. Rogoff, & M. Woodford (Eds.), Nber Macroeconomics annual 2007, Volume 22 (pp. 381–441). https://doi.org/10.3386/w13318.
- Engel, C., & West, K. D. (2005). Exchange rates and fundamentals. Journal of Political Economy, 113(3), 485–517. https://doi.org/10.1086/429137
- Engel, C., & West, K. D. (2006). Taylor rules and the deutschmark-dollar real exchange rate. Journal of Money, Credit, and Banking, 38(5), 1175–1194. https://doi.org/10.1353/mcb.2006.0070
- Frenkel, J. A., & Razin, A. (1996). Fiscal policies and growth in the world economy, Third Edition. The MIT Press. https://mitpress.mit.edu/books/fiscal-policies-and-growth-world-economy-third-edition (October 23, 2019).
- Gabrisch, H., & Staehr, K. (2015). The Euro plus pact: Competitiveness and external capital flows in the EU Countries. JCMS: Journal of Common Market Studies, 53(3), 558–576. https://doi.org/10.1111/jcms.12220
- Galstyan, V., & Lane, P. R. (2009). The composition of government spending and the real exchange Rate. Journal of Money, Credit and Banking, 41(6), 1233–1249. https://doi.org/10.1111/j.1538-4616.2009.00254.x
- Gil-Alana, L. A., Luqui, N., & Cunado, J. (2008). Trade balance and exchange rate: Unit roots, Co-integration and long memory in the US and the UK. Economic Notes, 37(1), 59–74. https://doi.org/10.1111/j.1468-0300.2008.00192.x
- Kao, C. (1999). Spurious regression and residual-based tests for cointegration in panel Data. Journal of Econometrics, 90(1), 1–44. https://doi.org/10.1016/S0304-4076(98)00023-2
- Kao, C., & Chiang, M.-H. (2001). On the estimation and inference of a cointegrated regression in panel data. Nonstationary Panels, Panel Cointegration, and Dynamic Panels. https://www.emerald.com/insight/content/doi/10.1016/S0731-9053(00)15007-8/full/html (October 23, 2019).
- Lane, P. R., & Milesi-Ferretti, G. M. (2004). The transfer problem revisited: Net foreign assets and real exchange Rates. Review of Economics and Statistics, 86(4), 841–857. https://doi.org/10.1162/0034653043125185
- Levin, A., Lin, C. F., & Chu, C. (2002). Unit root tests in panel data: Asymptotic and finite-sample properties. Journal of Econometrics, 108(1), 1–24. https://doi.org/10.1016/S0304-4076(01)00098-7
- Meese, R. A., & Rogoff, K. (1983). Empirical exchange rate models of the seventies. Journal of International Economics, 14(1-2), 3–24. https://doi.org/10.1016/0022-1996(83)90017-X
- Meshulam, D., & Sanfey, P. (2019). The determinants of real exchange rates in transition economies. Rochester, NY: Social Science Research Network. SSRN Scholarly Paper. https://papers.ssrn.com/abstract=3451317.
- Neary, P. (1988). Determinants of the equilibrium real exchange Rate. The American Economic Review, 78(1), 210–215. https://www.jstor.org/stable/1814708
- Obstfeld, M., & Rogoff, K. (1995). Exchange rate dynamics Redux. Journal of Political Economy, 103(3), 624–660. https://doi.org/10.1086/261997
- Pesaran, H. M. (2007). A simple panel unit root test in the presence of cross-section dependence. Journal of Applied Econometrics, 22(2), 265–312. https://doi.org/10.1002/jae.951
- Rodrik, D. (2008). The real exchange rate and economic growth. Brookings Paperson Economic Activity, 2, 365–412.
- Samuelson, P. A. (1964). Theoretical notes on trade problems. The Review of Economics and Statistics, 46(2), 145–154. https://doi.org/10.2307/1928178
- Sarno, L., & Schmeling, M. (2014). Which fundamentals drive exchange rates? A cross-sectional perspective. Journal of Money, Credit and Banking, 46(2–3), 267–292. https://doi.org/10.1111/jmcb.12106
- Stock, J. H., & Watson, M. W. (1993). A simple estimator of cointegrating vectors in higher order integrated Systems. Econometrica, 61(4), 783–820. https://doi.org/10.2307/2951763
- Taylor, A. M. (2002). A century of current account dynamics. Journal of International Money and Finance, 21(6), 725–748. https://doi.org/10.1016/S0261-5606(02)00020-7
- Taylor, M. P., & Peel, D. A. (2000). Nonlinear adjustment, long-run equilibrium and exchange rate Fundamentals. Journal of International Money and Finance, 19(1), 33–53. https://doi.org/10.1016/S0261-5606(99)00044-3
- Vieira, F. V., & MacDonald, R. (2012). A panel data investigation of real exchange rate misalignment and Growth. Estudos Econômicos (São Paulo), 42(3), 433–456. https://doi.org/10.1590/S0101-41612012000300001
- Wei, S.-J., & Parsley, D. C. (1995). Purchasing power disparity during the floating rate period: Exchange rate volatility, trade barriers and other culprits. National Bureau of Economic Research. Working Paper. http://www.nber.org/papers/w5032.
- Westerlund, J. (2007). Testing for error correction in panel data. Oxford Bulletin of Economics and Statistics, 69(6), 709–748. https://doi.org/10.1111/j.1468-0084.2007.00477.x