
 ?Mathematical formulae have been encoded as MathML and are displayed in this HTML version using MathJax in order to improve their display. Uncheck the box to turn MathJax off. This feature requires Javascript. Click on a formula to zoom.
ABSTRACT
This study examines the productivity and efficiency spillovers in the presence of trade linkages in 27 European Union countries from 1990 to 2019. The European Union is one of the largest trading blocs in the world and has implemented costly policies and reforms to improve productivity growth. Meanwhile, trade-induced productivity and efficiency spillovers have often been overlooked in the literature, and examining them could provide further clarity to the productivity puzzle. Using a spatial Durbin model and a bilateral trade matrix, this study estimates a spatial stochastic production frontier model using data from the Penn World Table and the World Integrated Trade Solution. We decompose production frontier estimates to obtain the spillover effects of total factor productivity growth and technical efficiency from a network of bilateral trading partners. Our results provide evidence of productivity and efficiency spillovers; however, the gains are uneven. Policy implications are discussed.
1. Introduction
To promote sustainable development and regional integration, the European Union (EU) has implemented various policies, such as the National Productivity Boards and the Innovation Union policy, as well as various structural funding packages such as the Cohesion Funds (Pegkas et al., Citation2020; Webber et al., Citation2019). Yet, despite these costly policies and reforms, the EU has experienced a declining trend in productivity in recent years. A recent ECB Economic Bulletin report highlights that the EU experienced sluggish productivity growth even before the recent global financial crisis of 2008 (ECB, Citation2017). Furthermore, recent studies have found that weak investment and the slow recovery of employment levels – an indicator of resource misallocation – have contributed to low productivity (Claeys et al., Citation2022; Lopez-Garcia, Citation2021).
This is concerning, as productivity is crucial for the region’s sustainable growth and prosperity. Future productivity growth is suggested to depend on an economy’s ability to diffuse technology, within and across countries, through interactions such as trade, foreign direct investment, and mobile factors of production (McGowan et al., Citation2015). Productivity measures, such as total factor productivity (TFP) growth, are dimensionless in nature and do not consider interactions between observations; however, economic interactions between nations play a crucial role in economic growth as they can capture knowledge spillovers and technical diffusion as well as help to optimize resource allocation (Wu et al., Citation2019).
As a result, considering economic interactions is critical in the European context, as cohesion policies and the elimination of intra-EU tariffs have increased trade and economic interactions in the region (Pappalardo & Vicarelli, Citation2017). The EU is suggested to benefit from many convergence mechanisms that arise from certain spillover effects. Empirical studies on the region indicate that the diffusion of technology is vital for productivity growth (Banerji et al., Citation2015; Hafner, Citation2014; Harasztosi, Citation2016; Pegkas et al., Citation2020). Furthermore, other research has emphasized that the gains from spillovers may be uneven, especially for the Eurozone economies, which are suggested to benefit from a currency union (Gunnella et al., Citation2021; Jagelka, Citation2013). This is also true for the Central and Eastern European (CEE) economies, which are relatively new members of the EU enlargement process and have benefitted from technological content from their advanced counterparts (Antimiani & Costantini, Citation2013; Pina & Sicari, Citation2021).
Therefore, the present study re-examines this issue by measuring TFP growth and technical efficiency spillovers through trade linkages in 27 EU Member States from 1990 to 2019. This is of interest for various reasons: First, TFP and technical efficiency spillovers that arise from trade linkages have been overlooked in the literature. This is vital to consider as understanding the role of technical diffusion can provide insights into the declining trend of productivity in the EU, particularly with the role of trade linkages. Second, it allows for a comparative examination of productivity and efficiency spillovers across the EU Member States. This allows one to assess whether the Eurozone countries benefit more from spillovers or whether new Member States catch up in terms of productivity (Bardazzi & Ghezzi, Citation2018; Gunnella et al., Citation2021; Pina & Sicari, Citation2021).
This study offers several innovations over existing literature. First, studies that have examined the spillover impact of productivity and efficiency have focused on geographical spatial spillover effects (Glass et al., Citation2016; Haini, Citation2020). By contrast, this study captures the impact of spillovers from TFP and technical efficiency that occur through trade linkages. This is critical because, as distance becomes less of an obstacle, economies are being increasingly integrated globally and interconnected through trading activities. In fact, intra-trade in the EU has grown by 1200% in real terms (Badinger & Breuss, Citation2004). We provide new empirical evidence regarding the productivity puzzle in the EU, which has been demonstrated to be declining over time. Estimating a frontier that considers trade linkages allows one to examine whether technical spillovers occur, and whether productivity is higher in Eurozone economies. Likewise, we also provide new evidence regarding whether the CEE economies have benefited from technical spillovers from their advanced counterparts.
Finally, many studies have examined the impact of productivity by focusing on the spillover effect of labour productivity or TFP growth, while others have examined the efficiency spillover effects of frontier models (Carvalho, Citation2018; Glass & Kenjegalieva, Citation2019). The present study extends the literature by measuring the impact of technical efficiency spillovers that arise through a network of bilateral trading partners’ performance through an efficiency multiplier. Similarly, this study’s approach differs from the one suggested by Carvalho (Citation2018),Footnote1 which employs Bayesian methods to examine efficiency spillovers through the traditional production function model estimated using maximum likelihood. This allows us to obtain explicit estimates of efficiency spillovers, which could be of interest to policy makers.Footnote2
This study also employs a spatial Durbin stochastic production frontier model that uses a bilateral trade matrix, which is considered one of the most adequate connectivity matrices (Debarsy & Ertur, Citation2019). More specifically, we employ trade in goods exports from the Comtrade Database (World Integrated Trade Solution, Citation2020) to capture the extent of trade linkages between the EU Member States. Using this matrix, we estimate a spatial Durbin frontier using quasi-maximum likelihood methods, which consider endogenous spatial autoregressive and lag variables. We also employ data from the Penn World Table 10.0 (Feenstra et al., Citation2015) and use traditional frontier variables, such as output, capital, and labour. Furthermore, the spatial stochastic frontier model allows us to interpret the estimates like a standard production frontier model in addition to providing estimates of direct, indirect (spillover), and total parameters from the standard capital and labour inputs. Finally, the results can be decomposed to provide estimates of TFP growth, total technical change, technical efficiency change, and returns to scale change.
In addition, we find evidence of TFP growth and technical efficiency spillovers through trade linkages between the EU economies. In particular, our results suggest that indirect technical change and indirect technical efficiency provide an additional average spillover effect of 1.01% and 18.50%, respectively. However, we also find that the CEE economies benefit less compared with our full sample of EU economies as they only benefit from efficiency spillovers, while the Eurozone economies benefit from both indirect efficiency and technical change spillovers. Finally, we demonstrate that diffusion effects from indirect technical change are increasing over time, while direct technical change is declining. This follows the narrative of the EU’s persistently declining trend in productivity; however, it also provides evidence of successful policy implementation in terms of diffusing technical knowledge.
The remainder of this paper is organized as follows: Section 2 presents our theoretical considerations and literature review; Section 3 describes the data sample, variables employed, and econometric strategy; and Section 4 presents the results and provides a brief discussion of them. Finally, Section 5 concludes the study with policy implications and directions for future research.
2. Theoretical considerations and literature review
2.1. Productivity growth and spillovers
Improvements in productivity through innovation, economies of scale, and learning-by-doing can impact economic growth and violate the assumptions of the Solow (Citation1956) model. As a result, two producers can have different labour productivity even though they have the same inputs due to TFP growth (Syverson, Citation2011). In other words, productivity is efficiency in production and how much output is produced given a set of inputs. Since the growth of input factors cannot fully explain the growth of output, there must be other driving forces that explain growth (Nordhaus, Citation1969). Consequently, a decline in productivity is concerning for policy makers as productivity growth is suggested to be vital for sustainable prosperity in regions and countries (Krugman, Citation1994).
In addition, new growth theories have been introduced alongside endogenous models to explain the violations of traditional neoclassical growth models. These models include the new international economics theory, which provides a reformulation of the theories of trade and trade policy, and the new economic geography theory, which attempts to explain the spatial distribution of economic activity (Fujita et al., Citation1999). These theories extend the traditional neoclassical model as it generates long-run growth paths that resemble the Solow model with additional endogenous explanations for returns to scale, rate of technological change, savings, and population (Nijkamp & Poot, Citation1998). More specifically, the new growth theories highlight the growing importance of trade, capital flows, diffusion of innovation, and migration at the interregional and international levels, suggesting that spatial interactions need to be explicitly considered.
For example, factor mobility in capital and labour can have a disequilibrium effect, while the diffusion of technology can affect the growth paths of developing economies, where productivity growth can be driven by importing new technology (Nijkamp & Poot, Citation1998). Regarding trade, Grossman and Helpman (Citation1991) provide an extensive discussion of the links between innovation, trade, and growth in an open economy, as knowledge spillovers between firms and sectors can amplify growth. Technological development is suggested to radiate from a regional source to its surrounding neighbours, which promotes technological progress (Wu et al., Citation2019). Thus, spatial interdependencies are vital to consider as factor mobility, innovation diffusion, and trade occur in open economies that are constantly interacting with one another.
Several empirical papers have highlighted the spillover effect of productivity and efficiency across regions and economic structures. Capello (Citation2009) suggests that neighbouring regions can take advantage of capital and labour availability, while inter-industry linkages allow growth to spill over and be transmitted to neighbouring regions and economies. Other research highlights the importance of trade linkages and spillover effects for exporting firms, which can benefit from agglomeration as it allows for the reduction of supply chain costs (e.g. by sharing a logistics centre), while an industrially dense economy allows for a specialized labour force (Harasztosi, Citation2016). Thus, trade connectivity and linkages are a critical source of knowledge and technical diffusion that can enhance productivity and often crosses regions and countries (Zhang et al., Citation2020). Similarly, several econometric papers have highlighted the importance of modelling spillovers in terms of geographic, economic, trade, and even linguistic distance (Debarsy & Ertur, Citation2019; Glass et al., Citation2013; Glass et al., Citation2016; Ho et al., Citation2013; Tientao et al., Citation2016; Wu et al., Citation2019).
2.2. Productivity in the EU
Modelling trade linkages becomes more critical in the context of the EU as the region has grown considerably through its enlargement process. To provide some background, the EU was initially founded by Belgium, France, Italy, Luxembourg, the Netherlands, and Germany in 1958. It established the European Economic Community and the EU Customs Union, which enable Member States to operate within a single market (McCann & Ortega-Argilés, Citation2013).Footnote3 Today, the region consists of 27 Member States and has developed a single legal binding agreement known as the EU Acquis Communautaire, which consists of a unified economic and institutional setting throughout the region; moreover, it allows for the free movement of goods and services as well as of capital and labour (Gehringer, Citation2013). As a result, the establishment of a European Common Market and the elimination of capital controls has allowed financial development to flourish through increased economic integration between Member States (Bordo & Rousseau, Citation2012).
However, since the turn of the century, growth in the annual gross domestic product (GDP) per capita has been stagnating, marred by the global financial crisis of 2008 and the subsequent Eurozone crisis of 2012 (ECB, Citation2017). Similarly, productivity growth in the region has also followed a declining trend, as labour productivity has dramatically slowed from an average of 2.4% during 1970–1995 to an average of 1.4% during 1995–2014 (Timmer et al., Citation2007). More recently, in 2018, the average labour productivity growth was approximately 1.1% (van Ark et al., Citation2018). The manufacturing sector is suggested to continue to contribute significantly to the productivity growth of the EU, while the productivity of new Member States is converging with the founding members (Pina & Sicari, Citation2021).
In addition, human capital development, infrastructure investment, research and development, and non-ICT capital deepening are found to be major determinants of TFP growth in the region (Strobel, Citation2012). For example, a recent study finds that research and development capital positively contributes to TFP growth in Eurozone countries (Pegkas et al., Citation2020), while another finds financial markets to be a crucial determining factor for capital allocation and productivity in European economies (Claeys et al., Citation2022). Yet, it is suggested that the region still faces various issues, such as weak demand, a changing employment composition, a declining rate of technological progress and diffusion, as well as increasing resource misallocation (ECB, Citation2017). Recent studies have highlighted that declines in the EU are mainly due to a reduction in innovative activity (Oulton, Citation2018), and also that industry misallocation has doubled within the Eurozone economies (Dias et al., Citation2016). Therefore, the EU faces the challenge of addressing and developing future initiatives to reverse the decline in productivity growth and regional disparity across the region, as low productivity can restrict the region’s ability to develop further (Banerji et al., Citation2015).
In response to these issues, the EU has implemented several initiatives. As the region has observed interregional disparities since the 1980s, it has introduced a variety of structural and investment funds that support the EU Cohesion Policy. The aim is to reduce disparities in economic output and support cohesion objectives for new Member States to adjust to the single market environment (McCann & Ortega-Argilés, Citation2013). Furthermore, in March 2000, the European Council adopted the Lisbon Strategy to address the productivity slowdown that the EU has faced compared with the United States, which has higher productivity growth through the adoption of ICT technologies (Palazuelos & Fernández, Citation2010). The Lisbon Strategy aims to increase the EU’s competitiveness by developing the region as a dynamic knowledge-based economy.
Finally, more recently, the EU has adopted a more direct response to address the decline in productivity by establishing the National Productivity Boards in 2016 (Webber et al., Citation2019). In addition, the region has implemented the Innovation Union policy, which includes the development of a European Research Area, the aim of which is to develop and produce high-quality research and innovation to boost productivity (Pegkas et al., Citation2020). Other recent initiatives also focus on cooperation between EU Member States on innovative activity, such as Horizon 2020 and the Important Projects of Common European Interest, which aims to promote further regional growth and convergence (Pina & Sicari, Citation2021).
Finally, the recent COVID-19 pandemic led to the creation of NextGenerationEU, a 750-billion-euro recovery plan launched by the EU in response to the pandemic.Footnote4 The plan aims to provide financial assistance to Member States to help them to recover from the economic and social impacts of the pandemic. The funds will be used to support the green and digital transition, invest in education and training, and support small and medium-sized enterprises (SMEs). This plan can promote productivity and efficiency in the region by boosting investment in innovation and research, supporting the digital and green transition, and providing support to SMEs. By investing in the digital infrastructure and the skills required to support the digital transition, businesses can adopt digital technologies that streamline operations and improve communication, eventually leading to gains in productivity and efficiency.
2.3. Trade, Eurozone, and CEE economies
While productivity has been declining, trade in the region has increased tremendously over the last few decades. In fact, from 1960 to 2000, a study finds that intra-EU trade grew by an impressive 1200% in real terms (Badinger & Breuss, Citation2004). Trade liberalization and income growth of the EU are suggested to have allowed trade to prosper, particularly through the elimination of the intra-EU tariff. Hafner (Citation2014) suggests that the enlargement process of the region has benefited new Member States as they gain access to trade-related foreign technology from old Member States, particularly CEE countries.
More crucially, while trade liberalization and income growth have benefitted the growth of intra-EU trade, the impact of the euro on bilateral trade flows is questionable. It must be noted that the EU is a political agreement, while the Eurozone is a monetary union aimed at increasing economic integration through a common currency. Scholars suggest that a common currency allows for greater unity, controls for volatility, allows for higher market transparency and competition, and provides higher macroeconomic stability (Frankel & Rose, Citation2002). In theory, the Eurozone economies should benefit further from trade as they share a single market and a common currency, which should eliminate many informational and transactional costs.
However, on the other hand, empirical studies that have examined the impact of the euro on trade at the macroeconomic and firm levels have suggested that the effect is nonsignificant (Bresser-Pereira & Rossi, Citation2015; Cafiso, Citation2011; Figueiredo et al., Citation2016; Pappalardo & Vicarelli, Citation2017). Other researchers have found that the currency union unevenly benefits new members of the Eurozone, particularly the relatively smaller and underdeveloped EU countries, and they have suggested that the euro has facilitated the establishment and expansion of production chains (Gunnella et al., Citation2021; Jagelka, Citation2013). Hence, the growth of intra-EU trade and the considerable variation across bilateral trade flows – in both the EU and Eurozone economies – provide an interesting avenue for examining the extent of trade-induced productivity spillovers.
Additionally, another strand of literature highlights the convergence effect that arises from the EU, whereby newer Member States, particularly CEE economies, benefit more than older and developed Member States. Previously, many CEE economies had fragile institutional settings with a high dependence on an unskilled labour force, and the European enlargement process has led to increased export flows and technological spillovers as well as further developed the institutional capacity of newer Member States (Antimiani & Costantini, Citation2013).
Moreover, many CEE countries were part of the former Soviet bloc, in which they suffered from the poor utilization of their production capacity, and thus, convergence to their advanced counterparts was easier (Haini & Wei Loon, Citation2022; Lopez-Garcia, Citation2021). As such, it is unsurprising to observe strong growth and convergence from CEE countries, which have seen fewer losses in output compared with the EU average (Pina & Sicari, Citation2021). Thus, in addition to the Eurozone economies, the CEE economies provide an interesting case study for examining trade-induced productivity and efficiency spillovers as they are expected to absorb more technological progress from their developed counterparts.
3. Empirical methodology
3.1. Spatial Durbin production frontier model
Consider EquationEquation (1)(1)
(1) , which presents the standard stochastic frontier and includes the traditional outcome variable GDP, denoted as
, and the independent input variables
(capital and labour). The composed error structure consists of two components, namely the idiosyncratic error,
and time-varying technical efficiency,
.
(1)
(1) However, EquationEquation (1)
(1)
(1) is dimensionless in nature and does not consider the interactions between the observations, as the cross-sectional units are assumed to be independent. Yet, productivity and efficiency can spill over and be transmitted to other economies (Ertur & Koch, Citation2011). As a result, it is suggested that modelling a closed economy might not be valid and that spatial interdependencies must be considered to capture spillovers between economies (Ho et al., Citation2018). While several studies have examined growth spillovers, the literature on spatial stochastic frontier modelling is relatively scarce, only being developed in recent studies (Glass et al., Citation2016).
Following Glass et al. (Citation2016), the present study employs the spatial Durbin production frontier model estimated using maximum likelihood, as in EquationEquation (2)(2)
(2) . The omission of the spatial autoregressive variable is suggested to lead to bias estimates, while the issue of spatial dependence is seldomly discussed in stochastic frontier modelling. The spatial dependence between the cross-sectional units is captured by the inclusion of a spatial weights matrix, denoted as
. The specification of the matrix is explained in more detail below. Furthermore, the spatial frontier model is estimated using a three-step simulated maximum likelihood method (Filippini & Greene, Citation2016). The estimates of the spatial frontier are obtained in the first stage, followed by the efficiency spillovers and returns to scale, and finally the TFP in the final stage.
(2)
(2) In EquationEquation (2)
(2)
(2) , there are
countries indexed
over time
, indexed
. The dependent variable
represents the traditional stochastic frontier variable, namely real GDP, while
represents a vector of exogenous independent input variables, namely real capital stock and labour. We include a vector of control variables denoted by
and the time trend
and
to account for Hicks-neutral technological change. To account for spatial dependence,
represents a vector of the spatial lags of the exogenous input variables, while
represents a vector of the spatial lags of the control variables. Finally, as the spatial Durbin model nests both the spatial autocorrelation and autoregression model,
represents a vector of the spatial lag of the dependent variable from bilateral trading partners. However, following Glass and Kenjegalieva (Citation2019), the local estimate for the time trend is omitted as it would be perfectly collinear with a row-normalised
. The intercept is denoted as
, while
,
,
,
,
,
, and
are vectors of parameters that shift the stochastic frontier.
Focusing on the spatial weights matrix, , various methods exist for constructing it. However, many spatial weights are not derived from theory but are rather based on geographical distance or features such as a distance or contiguity matrix (Debarsy & Ertur, Citation2019). More recent studies have employed other interaction matrices, which can be employed as a spatial weights matrix, such as bilateral trade flows, genealogic distance, and linguistic distance (Ho et al., Citation2018). This is vital to consider as the misspecification of the interaction matrix could lead to significant biases. This study employs bilateral trade flows as its spatial weights matrix, as it is suggested to be the most adequate interaction matrix based on several robustness tests (Debarsy & Ertur, Citation2019).
Meanwhile, the construction and intuition of the spatial weights matrix remain the same. In this case, captures the spatial arrangement of the cross-sectional units and the strength of the spatial interaction based on pairwise trading partners. The diagonal elements of
are set to zero and row-normalised to have the unit sum
. This preserves the spatial scaling of the data and transforms the spatial lag to be a weighted average of the bilateral trade observations. Thus, denoting
as the identity matrix, one can assume from EquationEquation (2)
(2)
(2) that
is non-singular, that the parameter space of
,
, and
is
as it is row-normalised, and that
represents the lower-limit characteristic root of
.
With the interaction matrix defined, the production frontier model is estimated using the spatial Durbin specification. However, LeSage and Pace (Citation2009) highlight that the coefficients of the independent variables in EquationEquation (2)(2)
(2) cannot be interpreted as elasticities, as the spatial spillover effect arises through the marginal effects of the independent variable interacting with the interaction matrix. Thus, to isolate the marginal effects, EquationEquation (2)
(2)
(2) can be reduced to EquationEquation (3)
(3)
(3) , which allows the estimated parameters to calculate the direct, indirect, and total marginal effects:
(3)
(3) In EquationEquation (3)
(3)
(3) , the unit subscript
is dropped for the successive stacking of cross-sections. It is assumed that
is a matrix of stacked observations for
,
,
,
, and
. As outlined by LeSage and Pace (Citation2009), EquationEquation (3)
(3)
(3) can be differentiated to isolate the effects for the direct, indirect, and total marginal effects. Consequently, the isolated effects allow for estimates of spillover effects arising from trading partners. The direct parameters consider the individual unit’s independent impact on the dependent variable, while the indirect parameters consider the spillover impact of trading partners. As such, the total parameters are the sum of direct and indirect spillovers.
Glass et al. (Citation2016) extend the approach to isolate marginal effects by estimating the relative direct, relative indirect, and relative total efficiencies. Traditional technical efficiency scores in stochastic frontier modelling are generally bounded from the interval [0,1]. The inclusion of indirect efficiency allows scores to be greater than 1, as countries can benefit from importing efficiency spillover from their trading partners. Glass and Kenjegalieva (Citation2019) call this the efficiency multiplier effect. Finally, with technical efficiency defined, we calculate TFP growth using standard components, such as the sum of change in technical efficiency, technical change, and returns to scale change following Kumar and Russell (Citation2002). Additionally, we follow Glass et al. (Citation2013) and extend this to include the spatial decomposition of TFP change, including direct and indirect technical change, total scale changes, and total technical efficiency change. We outline the decomposition in Appendix A1.
3.2. Data and variables
This study employs an annual-level panel dataset of 27 EU Member States, namely Austria, Belgium, Bulgaria, Croatia, Cyprus, Czech, Denmark, Estonia, Finland, France, Germany, Greece, Hungary, Ireland, Italy, Latvia, Lithuania, Luxembourg, Malta, the Netherlands, Poland, Portugal, Romania, Slovakia, Slovenia, Spain, and Sweden. The data for the variables are compiled from the Penn World Table 10.0 (Feenstra et al., Citation2015) from 1990 to 2019. The sample time-period is chosen based on data availability. All variables undergo the standard manipulation of data, such as log-transformation and mean-differencing; thus, the first-order input and time parameters can be interpreted as elasticities.
Additionally, the bilateral trade matrix data are compiled from the Comtrade Database (World Integrated Trade Solution, Citation2020). We employ the average imports and exports of country
from country
over the period 1990–2019 following Debarsy and Ertur (Citation2019). Our bilateral trade flows data are measured in nominal terms, as exports are deflated by two multilateral opposing terms and treating them into real data would not adequately capture the multilateral terms and would be inconsistent in terms of matching exports and imports (Brun, Citation2005).Footnote5 Equally critical is that our bilateral trade data from the Comtrade Database measure and capture trade in goods at the HS-6 level (5000 products). Although trade in services is becoming increasingly important in the EU, which has grown faster than trade in goods (Gunnella et al., Citation2021), trade in goods is still a large component of the EU and accounts for nearly €2,000 billion, while trade in services accounts for €910 billion in 2020 (World Integrated Trade Solution, Citation2020).
As the spatial Durbin frontier model is an extension of the traditional stochastic frontier, the traditional variables used in frontier modelling are employed to calculate TFP growth.Footnote6 The dependent variable represents real GDP, which is measured as output-side real GDP at chained purchasing power parity in 2017 US$ million. Feenstra et al. (Citation2015) recommend using output-side GDP to analyze productivity, as opposed to expenditure-side GDP. Thus, we employ the rgdpo measure from the Penn World Table 10.0. While labour productivity is usually captured using GDP per labour, we employ GDP at level terms with our capital and labour inputs to estimate a spatial stochastic production frontier.
Moreover, represents a vector of inputs that includes labour input, denoted as l, and real capital stock at constant 2017 national prices (in 2017 US$ million), denoted as k. While Glass et al. (Citation2016) use labour employed (emp in Penn World Table 10.0), we extend this and employ the average annual hours worked by persons engaged (avh in Penn World Table 10.0). This allows us to specifically focus on the substitutability of hours worked and capital employed, which extends the traditional frontier methodology. While traditional stochastic frontier models generally use the total number of labour employed (e.g. Glass et al. (Citation2016), who use EU economies), we argue that there are increasing numbers of zero-hour and short-term contracts in the EU and, as a result, it may be misleading to use the total number of labour employed.Footnote7 Furthermore, we employ the rnna variable from the Penn World Table 10.0 as our capital input. Specifically, rnna consists of four assets, namely structures (including residential and nonresidential), machinery (including computers, communication equipment, and other machinery), transport equipment, and other assets (including software, other intellectual property, and cultivated assets; Feenstra et al., Citation2015).
In addition, the interaction term between capital and labour and its squared terms are included following the literature. Furthermore, the time trend and its squared terms are included to capture Hicks-neutral technological change. Finally, represents a vector of control variables, including the ratio of government spending to GDP, denoted by gov (csh_g in Penn World Table 10.0 – the share of government consumption at current purchasing power parity); the ratio of net exports to GDP, denoted as exp (csh_x + csh_m in Penn World Table 10.0 – the sum of the share of merchandise exports and imports at current purchasing power parity); and a dummy variable for the CEE economies,Footnote8 denoted as cee. Net exports are employed rather than trade openness as it signifies imports as leakage (Glass et al., Citation2016).
In addition, we include the share of government spending and net exports as part of our frontier model following the Barro-style regression (Citation1991) and traditional growth accounting aggregate demand models. The empirical literature on government size and GDP is inconclusive as some studies have found government size to be positive for GDP as it allows for the provision of infrastructure and human capital formation, while others have found government size to be detrimental as it distorts incentives and crowds out the private sector (Haini & Wei Loon, Citation2022). Moreover, the relationship between net exports and GDP is straightforward as increases in exports are generally favourable (Balassa, Citation1978). presents the summary statistics of the variables employed at levels.
Table 1. Summary statistics.
Our full sample exhibits considerable heterogeneity across our input and output variables. The average real GDP for the sample is approximately $518,830.70, while the inputs of real capital stock and the average annual hours worked have an average value of $2,535,834.00 and 1,758.69 h. We observe considerable variation in real GDP and real capital, while labour input displays less variation. When grouping our countries into Eurozone and CEE economies, we observe that both real GDP and capital for the CEE economies have lower averages than those of the full sample. However, the average labour input for CEE economies is larger. As expected, the Eurozone economies have a higher average output and input compared with the full sample.
4. Results and discussion
reports the coefficients and parameters of the spatial Durbin production frontier, which includes the spillover effects of the independent variable reported by the direct, indirect, and total parameters. The direct parameters of the spatial production frontier can be interpreted in the same manner as a nonspatial frontier (Glass & Kenjegalieva, Citation2019). Consequently, following the standard frontier literature, the monotonicity properties and condition must hold for the direct parameters of the production function. Monotonicity is a condition where an increase in inputs can never decrease the level of output, and it is important for theoretical consistency; furthermore, if this condition is violated, then the estimated results cannot be interpreted reasonably (Glass et al., Citation2016). We observe that the estimated direct parameters for k and l are both positive and significant at the 1% level to output, which satisfies the monotonicity theory of frontier modelling. The model suggests that capital accounts for 55% of output while labour accounts for 42% of total output.Footnote9
Table 2. Spatial Durbin production frontier coefficients and associated parameters.
In terms of our spatial dependency, we find that the spatial dependence of the model is positive and significant at the 1% level, as captured by the spatial lag coefficient . A higher and significantly positive value for spatial dependence improves the fit and log-likelihood of the model as it measures the average influence of observations by their bilateral trading partners’ observations (LeSage & Pace, Citation2009). Thus, one can assume that, as expected, cross-sectional dependency exists between the European trading partners. Our findings support the strand of literature that indicates the interconnectivity of trade in the EU (Bannò et al., Citation2015; Hafner, Citation2014; Harasztosi, Citation2016), as we find our spatial rho to be positive and significant to output.
While the interpretation of the direct and main coefficients follows the traditional frontier literature, the theory of the spatial production frontier does not specify whether the indirect parameters should be positive or negative (Glass & Kenjegalieva, Citation2019). Our results indicate that the indirect effect of k is nonsignificant to output. This implies that an average increase in the overall capital stock of bilateral trading partners in the EU will have no such effect on GDP in a respective economy.Footnote10 This implies that real capital stock increases in pairwise trading partners do not really spill over in terms of output. A similar observation is made with the local spatial elasticity to capital as Wk is also nonsignificant to output. This contrasts with the idea that capital accumulation is connected to the process of structural change, particularly for EU regions with lower levels of development (Filippetti & Peyrache, Citation2015). Our results imply that capital stock increases in trading partners in the EU are nonsignificant to output spillovers.
Moreover, the indirect effect of l is positive and significant at the 5% level to output, while the local spatial elasticity to labour, Wl, is also positive and significant at the 5% level to output. Our results imply that an increase in labour hours in a respective economy can potentially benefit other trading partners. Intuitively, this is expected as higher levels of production through labour input increases can potentially be exported to trading partners in the form of goods. Moreover, our results loosely imply that dense labour forces can potentially lead to agglomeration and specialization, which can benefit from trade linkages (Harasztosi, Citation2016). Previous studies demonstrate that that labour growth is constrained in many developing European countries (Claeys et al., Citation2022); as such, our results emphasize the importance of increasing labour growth to benefit from output spillovers in a network of trading partners.
We also find that the direct effect of k2 is positive and significant at the 1% level, while the direct effect of l2 is nonsignificant. This implies that there is an increasing returns to scale effect with regards to capital, while labour growth may be constrained. In terms of our Hicks-neutral time trend, we find that the direct and indirect effect of our time-trend t is positive and significant while the direct effect of t2 is positive and significant at the 1% level. This suggests that productivity growth may occur over time. Furthermore, the direct interaction between capital and labour kl is negative and significant at the 1% level, which implies substitutability, and this effect is greater in the indirect parameter. Moreover, the interaction between our inputs and time trend is interesting as kt exhibits a negative and significant direct effect, while lt exhibits a positive and significant direct effect. This implies that labour, over time, may be more important for output than capital. Additionally, the indirect effects of kt and lt are nonsignificant.
Finally, our control variables provide expected signs and significance levels. We find the direct effect of net exports as a share of GDP (exp) to be positive and significant at the 1% level, while the indirect effect of net exports is negative and significant at the 5% level. Intuitively, when neighbouring countries increase their exports, a respective country may potentially import more, which is a leakage on output. Moreover, we find the direct and indirect effect of government spending as a share of GDP (gov) to be negative and significant at the 1% level. Our results support the strand of literature that postulates the crowding-out effect from large governments, which are also susceptible to rent-seeking activities and the misallocation of resources (Haini & Wei Loon, Citation2022). Finally, our dummy variable cee is negative and significant, which suggests that the CEE economies are associated with lower real GDP output, as expected from our summary statistics.
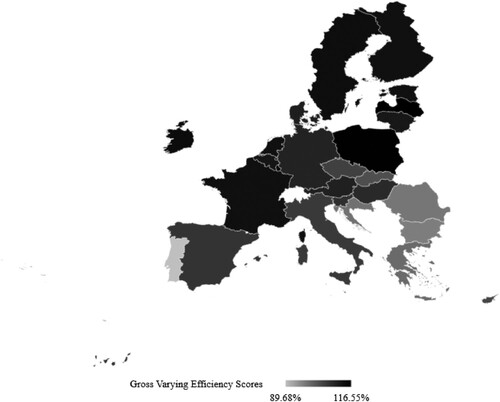
provides the decomposition of the total, direct, and indirect technical efficiency scores across EU Member States. As discussed in Section 3, the efficiency scores are unbounded as they consider a unit’s own net time-invariant, net time-varying and gross varying efficiency, calculated using a spatial multiplier matrix that passes through a unit’s first order and bilateral trading partners units before rebounding back to the original unit. As a result, a unit can benefit from increased performance as it can import efficiency from bilateral trading partners, which acts as an efficiency performance multiplier that leads to efficiency scores above 100% (Glass & Kenjegalieva, Citation2019).
Table 3. Averaged gross efficiency scores across countries.
In addition, we observe that the total average efficiency score of the EU is approximately 108.36%, while the total average for the CEE sample is slightly lower at 107.96% and that for the Eurozone countries is approximately 108.82%. The expectation is that the Eurozone countries will benefit more from a unified currency, and our results suggest that most Eurozone countries outperform non-Eurozone members. However, it is important to note that some CEE countries belong to Eurozone members, such as Czech, Estonia, Latvia, Lithuania, Slovakia, and Slovenia, while Bulgaria, Hungary, Poland, and Romania are not part of the Eurozone. We find that CEE members that are part of the Eurozone have a higher average gross efficiency score of 109.84% compared with 105.14%, with an indirect spillover of 18.70% compared with 18.38%.
Since the efficiency multiplier is based on bilateral trade flows, our results support the strand of literature that emphasizes the importance of the euro for trade (Antimiani & Costantini, Citation2013; Jagelka, Citation2013). Our findings also provide evidence of efficiency spillovers resulting from bilateral trade linkages, which support the role of trade in increasing the technical efficiency of an economy as it benefits from increased production and trade linkages (Debarsy & Ertur, Citation2019; Ho et al., Citation2013; Tientao et al., Citation2016).
By contrast, Pina and Sicari (Citation2021) emphasize that the CEE economies have been catching up. Yet, our results indicate that the overall total average for these economies is below the total average in terms of total gross efficiencies. However, when we examine individual countries, Latvia and Poland benefit the most in terms of total gross efficiency scores, while Bulgaria, Romania, and Croatia do not benefit from spillovers and have scores below 100%.Footnote11 As such, the CEE economies have heterogeneous efficiency scores across the sample. More crucially, we observe the indirect efficiency scores for the CEE economies to be larger on average (18.57%) than those of the Eurozone (18.48%) and our full sample (18.50%). Thus, the indirect efficiency spillovers imply that the CEE economies have a pseudo-convergence effect. Finally, the spillover effect is visualized in , where many of the developed European economies can be observed to have higher levels of efficiency, while the CEE economies have relatively lower efficiency scores.
Figure 1. Averaged gross time-varying efficiency across countries. Source: Author’s compilation from .
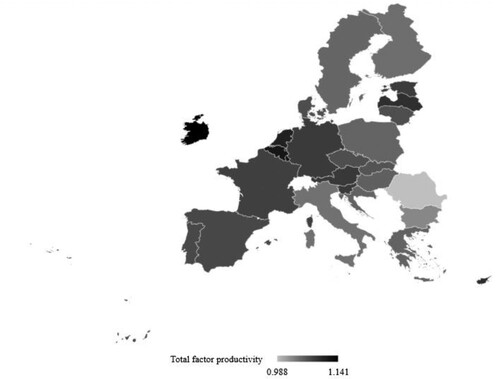
Focusing on TFP growth, presents the averaged TFP growth decompositions. The average TFP growth for the region is approximately 7.2%, which is rather high and differs from the narrative that TFP growth is weak in EU Member States (Schiersch et al., Citation2015). Upon closer examination, when focusing only on direct technical change, we observe that average direct technical change is at 3.1%, which is relatively low, while returns to scale is at 2.0%. Moreover, our results provide evidence of trade-induced technical spillovers with an average indirect technical change of 1.01%. Focusing on the Eurozone and CEE economies, we find an average TFP growth of 8.5% and 5.7%, respectively. This implies that TFP growth is higher in Eurozone economies, supporting recent as well as earlier studies that have demonstrated the positive trade gains that arise from adoption of the euro (Antimiani & Costantini, Citation2013; Gunnella et al., Citation2021).
Table 4. Averaged TFP growth decomposition across countries.
Additionally, the lower average TFP growth from the CEE economies implies that output growth may be driven by capital deepening and labour inputs rather than TFP (Lopez-Garcia, Citation2021). In fact, we find a negative average indirect technical change for the CEE economies, which implies that the CEE region does not benefit from indirect technical spillovers. Here, our intuition is that many CEE economies are developing and have lower levels of human capital formation and institutional capacity (Haini & Wei Loon, Citation2022); as such, they may find it difficult to absorb technical knowledge and know-how from their trading partners. Many studies indicate that human capital formation is an important contributor to productivity and TFP growth, even in Europe as a whole (Álvarez-Ayuso et al., Citation2011). Thus, our findings loosely support previous empirical studies that demonstrate how countries can amplify, absorb, or block trade spillovers (Kireyev & Leonidov, Citation2018).
When focusing on individual economies, we find Ireland, Luxembourg, and Belgium to have the largest TFP growth, whereas Romania and Bulgaria have the lowest out of our full sample. Interestingly, many individual Eurozone countries perform higher than average, while the TFP growth for individual CEE economies is distributed across the full sample. In terms of direct technical change, we find Germany, the Netherlands, and France to have the highest average, while Malta, Cyprus, and Luxembourg have the lowest. Similarly, in terms of indirect technical change, we find Germany, Austria, and Italy to have the highest, while Estonia, Lithuania, and Latvia do not benefit from technical spillovers. This is visualized in , which reveals a higher concentration of TFP growth in the Western EU and Eurozone economies. Thus, our results support the strand of literature that postulates a positive effect from the adoption of the euro (Antimiani & Costantini, Citation2013; Gunnella et al., Citation2021; Jagelka, Citation2013), as we find a higher average technological spillover induced from trade linkages.
Figure 2. Averaged TFP growth decomposition across countries. Source: Author’s compilation from .
Additionally, when we compare the TFP growth rates of CEE economies that are part of the Eurozone with those of CEE economies that are not, we find contrasting results. Specifically, we find that the TFP growth rates of CEE economies in the Eurozone to be 7.5% compared with 2.9% for those that are not part of the Eurozone. However, the indirect technical spillovers are less than 1 for both cases. The TFP growth differences between CEE economies that adopt the euro seem to be driven by returns to scale, as CEE economies within the Eurozone observe a 4.4% increase compared with 3.2%. This highlights the gains from a shared currency.
Finally, presents the average TFP growth decomposition for the EU over time, while graphically presents the findings. We visually observe that returns to scale changes are a major driver of TFP growth in the region, while direct technical change exhibits a decline over time. This somewhat follows the narrative that the EU as a region is experiencing a decline in labour productivity (which in our case is measured by direct technical change; ECB, Citation2017), while we support studies that find capital intensity and investment (returns to scale changes) to be one of the main contributors to productivity growth in the EU (Banerji et al., Citation2015; Lopez-Garcia, Citation2021).
Figure 3. Averaged TFP growth decomposition over time. Source: Author’s compilation from .
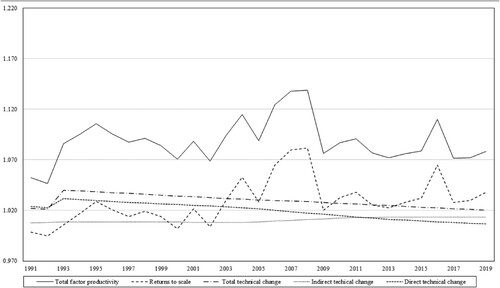
Table 5. Averaged TFP growth decompositions over time.
However, we also find overall TFP growth to be increasing as such growth was 5.2% in 1991 and approximately 7.8% in 2019, while the average direct technical change was approximately 2.2% in 1991 and 2.0% in 2019. Returns to scale changes are one of the main contributors to TFP growth; however, they exhibit fluctuations over time. For example, returns to scale experienced a sharp drop in 2008 and 2009 as well as in 2016. While direct technical progress exhibits a gradual decline, returns to scale changes from input factors are more volatile. The significant drop in 2008 and 2009 can be attributed to the global financial crisis of 2008, while the drop in 2013 can be attributed to the Eurozone crisis of 2012, where many Eurozone members were unable to repay or refinance their government debt. Our findings support the diminishing productivity growth that plagues the region as it experiences a decline in the rate of technical progress and an increase in input misallocation (ECB, Citation2017; Webber et al., Citation2019). It is suggested that the misallocation of capital and labour in the EU can restrict productivity growth (Claeys et al., Citation2022).
On the other hand, we find our indirect technical spillover to increase over time, albeit at a smaller average, from 0.8% in 1991–1.4% in 2019. While the spillover effects that arise from indirect technical change is low, they provide evidence for the importance of trade linkages in promoting technical diffusion and knowledge spillovers (Wu et al., Citation2019). It is suggested that exporting firms benefit from agglomeration and, since Europe as a region benefits from the freer flow of goods and services, exports can benefit from sharing logistical links, innovation, and a matching labour force, which leads to productivity spillover effects (Harasztosi, Citation2016). This may be an indicator of the success of cross-border cooperation and innovation policies that the EU has implemented, such as the Important Projects of Common European Interest (Pina & Sicari, Citation2021).
In general, our results indicate that while there has been a decline in technical change, trade integration and linkages alongside capital intensity contribute to TFP growth in the region and result in productivity and efficiency spillovers. This echoes recent studies that have found that the decline in the EU is mainly due to the reduction in innovative activity (Oulton, Citation2018), which may indicate why our direct technical change is declining over time. This is critical for the EU economies as innovation is a vital process, where less innovation means a permanently lower TFP growth, as our findings demonstrate. Moreover, the effect of returns to scale changes varies as it is usually driven by capital intensity, which fluctuates as capital accumulation returns to a steady-state trend (Claeys et al., Citation2022; Solow, Citation1956). Thus, we support studies that highlight the weak investment in the EU as a major contributor to lower productivity growth.
5. Conclusion
A recent OECD report titled The Future of Productivity suggests that future productivity growth will depend on effective technological diffusion through global connections, such as trade and factor mobility (McGowan et al., Citation2015). Furthermore, the EU has seen intra-EU trade increase substantially since its inception due to the introduction of the single market as well as other policies that promote regional integration, such as the Cohesion and Structural Funds. As previous studies have tended to overlook the spillover impact of TFP growth and technical efficiency, the European context is an interesting case study to examine.
Using a spatial Durbin stochastic frontier model and a bilateral trade matrix, we decompose the estimates and calculate TFP growth, direct and indirect technical change, direct and indirect efficiency change, and returns to scale change. Our results provide empirical evidence of trade-induced productivity and efficiency spillovers within the EU. We find that economies can potentially benefit from an additional indirect technical change of approximately 1.01% and an additional average efficiency spillover effect of 18.50%, which allows countries to push their production frontier.
Of equal importance, we find that the Eurozone economies benefit more from indirect technical change and indirect efficiency spillovers, while the CEE economies do not gain from indirect technical spillovers on average. Furthermore, we find a higher average TFP growth rate for the Eurozone economies, which supports studies that emphasize the importance of the adoption of the euro (Gunnella et al., Citation2021). While our results provide evidence of technical diffusion, direct technical change is declining over time. While our estimation method is not a causal one, our study loosely follows the narrative of the persistently declining productivity trend in the region, which can be attributed to other structural factors (Claeys et al., Citation2022; Lopez-Garcia, Citation2021).
5.1. Policy implications
Our findings have several policy implications. They imply the success of the EU enlargement process and the economic and monetary union in the Eurozone economies. Our findings offer evidence of technical spillovers, which suggests that the EU should continue to pursue cooperative and innovation policies to further gain from TFP growth. Recent initiatives such as Horizon 2020, an EU research and innovation programme aimed at promoting synergies and fostering cross-border networks, as well as the Important Projects of Common European Interest, should continue to be developed to promote further technical spillovers. Similarly, post-COVID-19 initiatives such as the NextGenerationEU should be welcomed.
Given the potential benefits of NextGenerationEU in promoting productivity and efficiency in the region, it is crucial that the plan is implemented and supported by all Member States. To ensure the success of the plan, policymakers must allocate funds effectively and ensure that investments are made in a manner that maximizes their impact on economic growth and job creation. Policymakers should also prioritize support for SMEs as they are a major source of employment and economic growth in the region. Additionally non-Eurozone EU Members States should be encouraged to adopt the euro, as we find evidence of higher TFP growth and technical spillovers. The adoption of the euro can facilitate technical diffusion by facilitating the establishment of production chains within the EU (Gunnella et al., Citation2021).
However, since direct technical change is declining over time, the National Productivity Boards in the respective Member States should identify policies that can further drive technological progress as it can promote sustainable long-run growth. Moreover, the CEE economies should ensure that structural factors, such as institutional capacity and human capital formation, are adequate to benefit from technical spillovers (Álvarez-Ayuso et al., Citation2011; Lopez-Garcia, Citation2021), as we find that they do not gain much from trade-induced technical spillovers.
5.2. Directions for future research
We recommend several directions for future research. This study focuses on productivity and efficiency spillovers from trade by examining the EU. Thus, since economies are increasingly integrated on a global basis, it might be interesting to examine the productivity and efficiency spillovers from a global perspective to estimate the effects of intra- and extra-EU trade. This could provide greater context for the European productivity puzzle as it would allow one to estimate the indirect technical change that arises from trading partners within and outside of the EU.
Second, it might be interesting to examine the productivity and efficiency spillovers through financial flows within the EU. As mentioned earlier, the interaction matrix models cross-sectional interdependence between observations, and previous studies have employed geographic distance, linguistic and cultural distance, and bilateral trade flows. However, financial flows have been overlooked in the literature, and examining productivity and efficiency spillovers with a financial flow matrix could provide deeper insights into the EU productivity puzzle. As such, future studies could empirically examine whether financial linkages can promote technical spillovers.
Finally, future studies could also extend the interaction matrix to consider bilateral trade in services within the EU. Trade in services has grown faster than trade in goods over the last two decades (Gunnella et al., Citation2021) and measuring a bilateral trade flow using services is relatively unexplored. This is due to missing data for the early 2000s as trade in goods was dominant. Nonetheless, if future studies attempt to overcome such missing data, a bilateral trade in services matrix may provide a deeper understanding of the European productivity puzzle.
Availability of data and material
Data sharing is not applicable to this article as no new data were created or analyzed in this study.
Code availability
The econometric analysis was conducted using Stata14.
Acknowledgements
The authors acknowledge the direction of the handling editor, Dr Swapnil Singh, and the suggestions provided by two anonymous referees.
Disclosure statement
No potential conflict of interest was reported by the author(s).
Additional information
Funding
Notes on contributors
Hazwan Haini
Hazwan Haini is a lecturer in economics at the UBD School of Business and Economics in Universiti Brunei Darussalam. His research interests include economic growth, development economics, international trade and productivity. He has published in several peer-reviewed journals and has presented in numerous international conferences.
Pang Wei Loon
Pang Wei Loon is a lecturer in economics at the UBD School of Business and Economics in Universiti Brunei Darussalam. His research interests focuses on international trade and productivity growth. Wei Loon has published book chapters alongside journal articles and has provided consultancy for various government agencies.
Notes
1 Carvalho (Citation2018) employs the Bayesian estimator using the Markov chain Monte Carlo scheme proposed by Tsionas and Michaelides (Citation2016). This is known as the spatial error stochastic frontier as it contains a spatial lag of the inefficiency term. While it estimates a nonspatial frontier in the first stage, Tsionas and Michaelides (Citation2016) assume a half-normal inefficiency error term. These distributional assumptions make it difficult to interpret the spatial variables when calculating for TFP growth as they do not have an economic interpretation. Moreover, Glass and Kenjegalieva (Citation2019) estimate a spatial Durbin stochastic frontier model, which estimates a traditional spatial Durbin frontier and then splits the error term into an idiosyncratic error and its respective efficiency components.
2 Similarly, previous spatial models calculated using the generalized method of moments approach (Fingleton, Citation2008) generally estimate a spatially moving average error term that does not have an economic interpretation in terms of efficiency or productivity.
3 The European Economic Community was largely replaced by the Euro and Eurozone area following the revision of the Treaties in 1992 with the Maastricht Treaty.
4 For more information, see https://next-generation-eu.europa.eu/index_en
5 For example, two trading partners that export to one another will have exactly opposing numbers (e.g., what Austria exports to Belgium is equal to what Belgium imports from Austria). If one deflates this using GDP or CPI from the respective exporting and importing nations, the export and import values would be inconsistent.
6 We follow the traditional production function and calculation of TFP growth with the estimation of a spatially decomposed error term based on a bilateral trade matrix. While our error terms are spatial, we follow the traditional frontier production function, where TFP reflects shifts in the isoquants of a production function from capital and labour (Syverson, Citation2011).
7 We thank Reviewer 1 for the excellent suggestion.
8 The CEE countries are the Central and Eastern European economies, namely Bulgaria, Czech Republic, Estonia, Hungary, Latvia, Lithuania, Poland, Romania, Slovenia, and Slovakia.
9 We do not observe constant returns to scale in this case.
10 Note that capital stock includes structures, machinery, transport equipment, and other assets (Feenstra et al., Citation2015).
11 Scores below 100% imply that they do not benefit from the efficiency spillover and cannot push beyond the optimal practice boundary.
References
- Álvarez-Ayuso, I., Delgado-Rodríguez, M. J., & del Mar Salinas-Jiménez, M. (2011). Explaining TFP growth in the European Union at the sector level. Journal of Economic Policy Reform, 14(3), 189–199. https://doi.org/10.1080/17487870.2011.570088
- Antimiani, A., & Costantini, V. (2013). Trade performances and technology in the enlarged European Union. Journal of Economic Studies, 40(3), 355–389. https://doi.org/10.1108/01443581311283961
- Badinger, H., & Breuss, F. (2004). What has determined the rapid post-war growth of intra-EU trade? Review of World Economics, 140(1), 31–51. https://doi.org/10.1007/BF02659709
- Balassa, B. (1978). Exports and economic growth. Journal of Development Economics, 5(2), 181–189. https://doi.org/10.1016/0304-3878(78)90006-8
- Banerji, A., Dabla-Norris, E., Kim, M., Zdzienicka, A., Roeger, W., Varga, J., in’t Veld, J., Hassler, J., & Andrews, D. (2015). Structural reforms in the EU – policy prescriptions to boost productivity. Intereconomics, 50(5), 240–273. https://doi.org/10.1007/s10272-015-0550-2
- Bannò, M., Giuliani, D., & Zaninotto, E. (2015). The nature of export spillovers on trade: An analysis at NUTS 3 level in Italy. Applied Economics Letters, 22(10), 815–819. https://doi.org/10.1080/13504851.2014.980393
- Bardazzi, R., & Ghezzi, L. (2018). Trade, competitiveness and investment: An empirical assessment. Economic Systems Research, 30(4), 497–520. https://doi.org/10.1080/09535314.2018.1446913
- Barro, R. J. (1991). Economic growth in a cross section of countries. The Quarterly Journal of Economics, 106(2), 407–443. https://doi.org/10.2307/2937943
- Bordo, M. D., & Rousseau, P. L. (2012). Historical evidence on the finance-trade-growth nexus. Journal of Banking & Finance, 36(4), 1236–1243. https://doi.org/10.1016/j.jbankfin.2011.11.012
- Bresser-Pereira, L. C., & Rossi, P. (2015). Sovereignty, the exchange rate, collective deceit, and the euro crisis. Journal of Post Keynesian Economics, 38(3), 355–375. https://doi.org/10.1080/01603477.2015.1087807
- Brun, J.-F. (2005). Has distance died? Evidence from a panel gravity model. The World Bank Economic Review, 19(1), 99–120. https://doi.org/10.1093/wber/lhi004
- Cafiso, G. (2011). Rose effect versus border effect: The Euro’s impact on trade. Applied Economics, 43(13), 1691–1702. https://doi.org/10.1080/00036841003724437
- Capello, R. (2009). Spatial spillovers and regional growth: A cognitive approach. European Planning Studies, 17(5), 639–658. https://doi.org/10.1080/09654310902778045
- Carvalho, A. (2018). Efficiency spillovers in Bayesian stochastic frontier models: Application to electricity distribution in New Zealand. Spatial Economic Analysis, 13(2), 171–190. https://doi.org/10.1080/17421772.2018.1444280
- Caves, D. W., Christensen, L. R., & Diewert, W. E. (1982). The economic theory of index numbers and the measurement of input, output, and productivity. Econometrica, 50(6), 1393. https://doi.org/10.2307/1913388
- Claeys, G., Mouel, M. L. E., & Sgaravatti, G. (2022). The Low Productivity of European Firms: How Can Policies Enhance the Allocation of Resources? No. 06/2022, Working Paper Bruegel, 1–14.
- Debarsy, N., & Ertur, C. (2019). Interaction matrix selection in spatial autoregressive models with an application to growth theory. Regional Science and Urban Economics, 75(November 2018), 49–69. https://doi.org/10.1016/j.regsciurbeco.2019.01.002
- Dias, D. A., Robalo Marques, C., & Richmond, C. (2016). Misallocation and productivity in the lead up to the Eurozone crisis. Journal of Macroeconomics, 49, 46–70. https://doi.org/10.1016/j.jmacro.2016.04.009
- ECB. (2017). The slowdown in Euro area productivity in a global context. ECB Economic Bulletin, 3, 47–67.
- Ertur, C., & Koch, W. (2011). A contribution to the theory and empirics of Schumpeterian growth with worldwide interactions. Journal of Economic Growth, 16(3), 215–255. https://doi.org/10.1007/s10887-011-9067-0
- Feenstra, R. C., Robert, I., & Timmer, M. P. (2015). The next generation of the penn world table. American Economic Review, 105(10), 3150–3182. https://doi.org/10.1257/aer.20130954
- Figueiredo, E., Lima, L. R., & Schaur, G. (2016). The effect of the Euro on the bilateral trade distribution. Empirical Economics, 50(1), 17–29. https://doi.org/10.1007/s00181-015-1004-1
- Filippetti, A., & Peyrache, A. (2015). Labour productivity and technology gap in European regions: A conditional frontier approach. Regional Studies, 49(4), 532–554. https://doi.org/10.1080/00343404.2013.799768
- Filippini, M., & Greene, W. (2016). Persistent and transient productive inefficiency: A maximum simulated likelihood approach. Journal of Productivity Analysis, 45(2), 187–196. https://doi.org/10.1007/s11123-015-0446-y
- Fingleton, B. (2008). A generalized method of moments estimator for a spatial panel model with an endogenous spatial lag and spatial moving average errors. Spatial Economic Analysis, 3(1), 27–44. https://doi.org/10.1080/17421770701774922
- Frankel, J., & Rose, A. (2002). An estimate of the effect of common currencies on trade and income. The Quarterly Journal of Economics, 117(2), 437–466. https://doi.org/10.1162/003355302753650292
- Fujita, M., Krugman, P., & Venables, A. J. (1999). The spatial economy: Cities, regions and international trade. MIT Press.
- Gehringer, A. (2013). Growth, productivity and capital accumulation: The effects of financial liberalization in the case of European integration. International Review of Economics & Finance, 25, 291–309. https://doi.org/10.1016/j.iref.2012.07.015
- Glass, A., Kenjegalieva, K., & Paez-Farrell, J. (2013). Productivity growth decomposition using a spatial autoregressive frontier model. Economics Letters, 119(3), 291–295. https://doi.org/10.1016/j.econlet.2013.03.002
- Glass, A. J., & Kenjegalieva, K. (2019). A spatial productivity index in the presence of efficiency spillovers: Evidence for U.S. banks, 1992–2015. European Journal of Operational Research, 273(3), 1165–1179. https://doi.org/10.1016/j.ejor.2018.09.011
- Glass, A. J., Kenjegalieva, K., & Sickles, R. C. (2016). A spatial autoregressive stochastic frontier model for panel data with asymmetric efficiency spillovers. Journal of Econometrics, 190(2), 289–300. https://doi.org/10.1016/j.jeconom.2015.06.011
- Grossman, G., & Helpman, E. (1991). Endogenous product cycles. The Economic Journal, 101(408), 1214–1229. https://doi.org/10.2307/2234437
- Gunnella, V., Lebastard, L., Lopez-Garcia, P., Serafini, R., & Mattioli, A. Z. (2021). The Impact of the Euro on Trade: Two Decades into Monetary Union. No. 283/October 2021, ECB Occasional Paper Series.
- Hafner, K. A. (2014). Technology spillover effects and economic integration: Evidence from integrating EU countries. Applied Economics, 46(25), 3021–3036. https://doi.org/10.1080/00036846.2014.920479
- Haini, H. (2020). Spatial productivity and efficiency spillovers in the presence of transient and persistent efficiency: Evidence from China’s provinces. Cogent Economics & Finance, 8(1). [Online], https://doi.org/10.1080/23322039.2020.1735781
- Haini, H., & Wei Loon, P. (2022). Examining the impact of government spending on the finance-growth nexus: Evidence from post-communist economies. Post-Communist Economies, 34(6), 756–778. https://doi.org/10.1080/14631377.2021.2006491
- Harasztosi, P. (2016). Export spillovers in Hungary. Empirical Economics, 50(3), 801–830. https://doi.org/10.1007/s00181-015-0965-4
- Ho, C. Y., Wang, W., & Yu, J. (2013). Growth spillover through trade: A spatial dynamic panel data approach. Economics Letters, 120(3), 450–453. https://doi.org/10.1016/j.econlet.2013.05.027
- Ho, C. Y., Wang, W., & Yu, J. (2018). International knowledge spillover through trade: A time-varying spatial panel data approach. Economics Letters, 162, 30–33. https://doi.org/10.1016/j.econlet.2017.10.015
- Jagelka, T. (2013). Bilateral trade and the eurozone: Evidence from new member countries. The World Economy, 36(1), 48–63. https://doi.org/10.1111/twec.12013
- Kireyev, A., & Leonidov, A. (2018). Network effects of international shocks and spillovers. Networks and Spatial Economics, 18(4), 805–836. https://doi.org/10.1007/s11067-018-9400-7
- Krugman, P. (1994). The myth of Asia’s miracle. Foreign Affairs, 73(6), 62–78. https://doi.org/10.2307/20046929
- Kumar, S., & Russell, R. R. (2002). Technological change, technological catch-up, and capital deepening: Relative contributions to growth and convergence. American Economic Review, 92(3), 527–548. https://doi.org/10.1257/00028280260136381
- LeSage, J. P., & Pace, R. K. (2009). Introduction to spatial econometrics. Taylor & Francis.
- Lopez-Garcia, P. (2021). Key factors behind productivity. No. 268/September 2021, ECB Occasional Paper Series.
- McCann, P., & Ortega-Argilés, R. (2013). Redesigning and reforming European regional policy. International Regional Science Review, 36(3), 424–445. https://doi.org/10.1177/0160017612463234
- McGowan, M. A., Adrews, D., Criscuolo, C., & Nicoletti, G. (2015). The future of productivity. OECD Publishing.
- Nijkamp, P., & Poot, J. (1998). Spatial perspectives on new theories of economic growth. The Annals of Regional Science, 32(1), 7–37. https://doi.org/10.1007/s001680050061
- Nordhaus, W. (1969). An economic theory of technological change. The American Economic Review, 59(2), 18–28.
- Oulton, N. (2018). Productivity and the great recession. Intereconomics, 53(2), 63–68. https://doi.org/10.1007/s10272-018-0723-x
- Palazuelos, E., & Fernández, R. (2010). Labour productivity: A comparative analysis of the European Union and United States, 1994-2007. New Political Economy, 15(3), 325–344. https://doi.org/10.1080/13563460903288239
- Pappalardo, C., & Vicarelli, C. (2017). Euro introduction and the behaviour of Italian exporting firms. Oxford Economic Papers, 69(4), 1054–1077. https://doi.org/10.1093/oep/gpw068
- Pegkas, P., Staikouras, C., & Tsamadias, C. (2020). Does domestic and foreign R&D capital affect total factor productivity? Evidence from eurozone countries. International Economic Journal, 34(2), 258–278. https://doi.org/10.1080/10168737.2020.1734645
- Pina, Á, & Sicari, P. (2021). Enhancing regional convergence in the European Union. No. 1696, OECD Economics Department Working Papers.
- Schiersch, A., Belitz, H., & Gornig, M. (2015). Why is TFP growth sectorally concentrated? Applied Economics, 47(55), 5933–5944. https://doi.org/10.1080/00036846.2015.1061642
- Schmidt, P., & Sickles, R. C. (1984). Production frontiers and panel data. Journal of Business & Economic Statistics, 2(4), 367–374. https://doi.org/10.2307/1391278
- Solow, R. M. (1956). A contribution to the theory of economic growth. The Quarterly Journal of Economics, 70(1), 65–94. https://doi.org/10.2307/1884513
- Strobel, T. (2012). New evidence on the sources of EU countries’ productivity growth–industry growth differences from R&D and competition. Empirica, 39(3), 293–325. https://doi.org/10.1007/s10663-011-9169-0
- Syverson, C. (2011). What determines productivity? Journal of Economic Literature, 49(2), 326–365. https://doi.org/10.1257/jel.49.2.326
- Tientao, A., Legros, D., & Pichery, M. C. (2016). Technology spillover and TFP growth: A spatial Durbin model. International Economics, 145, 21–31. https://doi.org/10.1016/j.inteco.2015.04.004
- Timmer, M. P., O’Mahony, M., & van Ark, B. (2007). Growth and productivity accounts from EU klems: An overview. National Institute Economic Review, 200(1), 64–78. https://doi.org/10.1177/0027950107080390
- Tsionas, E. G., & Michaelides, P. G. (2016). A spatial stochastic frontier model with spillovers: Evidence for Italian regions. Scottish Journal of Political Economy, 63(3), 243–257. https://doi.org/10.1111/sjpe.12081
- van Ark, B., de Vries, K., & Jäger, K. (2018). Is Europe’s productivity glass half full or half empty? Intereconomics, 53(2), 53–58. https://doi.org/10.1007/s10272-018-0721-z
- Webber, D. J., Jen, M. H., & O’Leary, E. (2019). European regional productivity: Does country affiliation matter? International Review of Applied Economics, 33(4), 523–541. https://doi.org/10.1080/02692171.2018.1515899
- World Integrated Trade Solution. (2020). Comtrade Database, United Nations commodity trade statistics database. Available at: https://wits.worldbank.org/.
- Wu, C., Dang, K., Zhao, C., & Zhang, H. (2019). A driving force for sustainable economic growth in China from the wave-like effects of technological diffusion. Applied Economics Letters, 26(15), 1228–1233. https://doi.org/10.1080/13504851.2018.1543936
- Zhang, X., Wan, G., Li, J., & He, Z. (2020). Global spatial economic interaction: knowledge spillover or technical diffusion? Spatial Economic Analysis, 15(1), 5–23. doi:10.1080/17421772.2019.1578402
Appendix
A.1 Decomposition of the Indirect, Direct, and Total TFP Growth
From the reduced form in EquationEquation (3)(3)
(3) , it can be assumed that the total parameters from the time-varying technical efficiency is
, which estimates the vectors of total efficiencies. Therefore, the expected values of total relative efficiency can be denoted as
and this can be re-written as Equation (A1) below where
denote direct efficiencies and
denote indirect efficiencies (Glass et al., Citation2016).
(A1)
(A1) For the meantime, technical efficiency can be estimated using the modified Schmidt and Sickles (Citation1984) approach, considering the relative best performing unit in each time period. Glass et al. (Citation2016) further extends this and allows for the disaggregation of relative direct and relative indirect efficiency as outlined in Equations (A2) and (A3).
(A2)
(A2)
(A3)
(A3) Meanwhile, Equations (A2) and (A3) are unbounded and allows technical efficiency scores to be greater than 1, as it decomposes efficiency scores from the direct (own) relative efficiency and indirect (spillover) relative efficiency. The intuitive interpretation is that units with technical efficiency greater than 1 benefits from importing efficiency from its trading partners. Consequently, it is suggested that the spillover acts as an efficiency multiplier and that the network of bilateral trading partners performance can enhance a unit’s efficiency (Debarsy & Ertur, Citation2019; Glass & Kenjegalieva, Citation2019).
(A4)
(A4) Finally, the standard components of TFP change (denoted as
) are the sum of change in technical efficiency (denoted as
), technical change (denoted as
and
) and the returns to scale change (denoted as
and
) following Kumar and Russell (Citation2002) shown in Equation (A4). In simplified terms,
. Similarly, Glass et al. (Citation2013) extends this to include the spatial decomposition of TFP change to include direct and indirect technical change in addition to the non-spatial decomposition as shown by the superscript Ind or Dir which indicates direct and indirect coefficients respectively.
Additionally, and
refers to the scale changes and extends the approach introduced by Caves et al. (Citation1982), while
presents the direct technical change and
presents the indirect technical change. Likewise, the intuition with productivity spillovers can be interpreted like efficiency spillovers. In this case, the productivity spillovers results from importing and exporting productivity through bilateral trade linkages.