
ABSTRACT
Artificial intelligence (AI) and big data have the potential to promote advancement across various industries. Sport management and marketing have also significantly transformed due to rapid technological advances such as those in AI and big data analytics. Especially sports companies, however, are still underutilizing the potential of AI. At the same time, considering the existing sport marketing research, the effectiveness and optimization of dynamic marketing stimuli in dynamic sport media settings remains unclear. This study aims to assess the differences between two AI models’ predictive capabilities with and without access to consumers’ biometric data when forecasting the influence of game features on consumers’ responses. Academic theoretical models indicate that individual biometric features have a considerable influence on consumers’ responses; nevertheless, it remains impractical for companies to access these data concerning message effectiveness and ROI evaluation. Therefore, the study attempts to enhance the feasibility of message optimization for companies by trialing a real-time prediction derived from game features alone, exemplifying how much predictive capability is lost by non-available consumer data. Two supervised machine learning models (one initial, primarily theoretical based model; one adapted model due to available data) were trained to reanalyze large-scale eye tracking and game-related data, resulting in high predictive accuracy and appropriate applicability of the models. Both models were able to predict consumers’ responses with over 90% accuracy (initial model: 96%; adapted model: 94%). This study exemplifies AI usage in sport marketing and management, enabling companies to implement more effective marketing messages and strategies for their sponsorship based on real-time evaluation.
Introduction
The global marketing and management landscape, including the sports field, has transformed significantly, given the rapid technological advances and the increasing use of big data and artificial intelligence (AI) (Bruffy et al., Citation2016; Varshneya & Dasgupta, Citation2018). Even as AI has the potential to develop marketing innovations and increase the intelligence and efficiency of management processes, companies, especially those in the sports industry, have been slow to adopt AI and do not fully exploit its potential (e.g., Verma & Sharma, Citation2021).
The term “dynamic marketing” broadly describes the involvement of real-time data in optimizing and personalizing marketing messages (Kumar & Reinartz, Citation2016), such as content optimization or dynamic pricing. One form of dynamic marketing stimulus includes the in-stadium sponsorship messages placed on LED boards around the fields in various sporting events. These messages often entail substantial costs for companies in professional sports (e.g., Cornwell et al., Citation2012; Schönberner et al., Citation2021). Hence, sponsors expect a return on investment (ROI), which presupposes evaluation. The higher the amount of money involved, the greater the efforts required to evaluate the sponsorship deal in any form (O’Reilly & Madill, Citation2012). Effective sponsorship messages are those that reach the (desired) consumer (e.g., Ngai & Wu, Citation2022).
The concept of visual attention depicts one measurement to verify that consumers are reached; visual attention is the first necessary step for any further cognitive processing of dynamic marketing stimuli by the consumer (Lamme, Citation2003). Understanding the mechanisms underlying the concept is vital for achieving any other sponsorship objective, such as raising brand awareness or building brand image (Cornwell, Citation2019). However, the effectiveness of dynamic marketing stimuli and sponsorship messages in dynamic media settings such as live sports broadcasts requires further analysis and discussion in the literature (e.g., Cornwell & Kwon, Citation2020; Verhoef et al., Citation2015).
Concerning sponsorship effectiveness within sport broadcasts, previous studies have indicated that consumers mostly pay attention to sporting actions instead of sponsors’ messages (e.g., Breuer & Rumpf, Citation2015; Lee & Faber, Citation2007). However, in contrast to consumer- and sponsor-related factors (e.g., Boronczyk et al., Citation2018), scant research has been conducted concerning the influence of game-related factors on consumers’ visual attention allocation. Integrating new technologies into sports stadiums (e.g., real-time playable LED boards and AI-controlled virtual overlays), facilitates the consideration of sporting actions as a relevant factor. Marketing managers’ ability to respond to real-time events in the field highlights game-related features regarding visual attention allocation as a highly under-researched area. In a direct related study, Herold and Breuer (Citation2023) first elaborate on the impact of distinct game-related factors on consumers’ visual attention allocation towards dynamic marketing stimuli based on the theoretical predictions of the limited capacity model of motivated mediated message processing (LC4MP). In brief, this model conceptualizes consumers as biological organisms with finite cognitive resources for allocating visual attention toward marketing stimuli in mediated content (Lang, Citation2000, Citation2006). Using the same core data set than the present study, various game-related factors showed different significant influences on consumers’ visual attention, confirming the theoretically based predictions and providing detailed knowledge for sports marketing managers. Furthermore, the results indicated that individual, biometric consumer features might be crucial when predicting consumer response. However, these data are not applicable to sports practitioners (time-consuming collection, impractical). In contrast, game-related factors are automatically tracked for every high-ranked sporting event, making them easily applicable in real-time. Therefore, the current study attempts to provide advancement as a follow-up study of Herold and Breuer (Citation2023), reanalyzing their data set and testing the influence of incorporating individual, biometric consumer features as inputs, fostering practical application of scientific insights and proofing theoretical assumptions derived from the first study. Furthermore, additional game-related information provided by an external company (SkillCorner, Citation2022) was added to the present study’s data set compared to the data set of Herold and Breuer (Citation2023). The literature and method section further discusses and differentiates between previous work and the current study.
Since (1) the present literature on (sport) marketing requires real-time analytics across various industries (e.g., Ngai & Wu, Citation2022), (2) sponsorship research calls for greater practicability, relevance, and applicability of research results (e.g., Jensen & White, Citation2018; Volkmar et al., Citation2022), (3) companies do not fully exploit the potential of AI (e.g., Verma & Sharma, Citation2021), and (4) the explanation provided in the previous paragraph, this study aims to answer the following research question (RQ): How do the predictive capabilities of two AI models with and without access to consumers’ biometric data differ, when forecasting the influence of game features on consumers’ responses? Academic theoretical models indicate that individual, biometric features hold considerable influence on consumers’ responses; nevertheless, it remains impractical for companies to access these data concerning message effectiveness and ROI evaluation. By comparing two AI models, novel insights can be gained on how much predictive capability is lost by non-available consumer data but accessible game data or, conversely, how much additional predictive capability can be attained by adding biometric data additional to game data. Therefore, the study attempts to enhance the feasibility of message optimization for companies by trialing an AI-based real-time prediction derived from game features alone.
Based on these findings, the current knowledge concerning the theoretical predictions of the LC4MP model will be extended, and deeper insights on the (un-)importance of individual, biometric features regarding consumers’ responses in dynamic media will be gathered. Practitioners can leverage existing data in the sports industry to implement more optimized and effective marketing strategies. Sport marketing managers will benefit from the insights generated regarding attention-capturing tactics based on real-time events, which firstly allow for immediate response and adaptation of marketing content and sponsorship messages during games and secondly, allow ROI evaluation concerning valuable time slots after the games.
As the study implements an AI-based methodology, this paper is organized less conventionally. The following section introduces AI and consumer responses in dynamic media and summarizes the existing literature on game-related factors as determinants of sponsorship effectiveness. Thereafter, the research settings and data handling methods are described in line with the methodology section. The next section presents the training and testing of the AI model, which constitutes the results of this study. A discussion of the results, study contributions, and avenues for future research follows this. The final section presents the conclusions of the study.
Conceptual framework
Artificial intelligence and consumer response
AI and machine learning (ML) usage in marketing has been constantly increasing (e.g., Davenport et al., Citation2020; Volkmar et al., Citation2022). Among others, AI applications significantly transform existing approaches to marketing strategies and consumer behavior. The integration of AI has opened new possibilities for businesses to understand their consumers better, personalize experiences, and optimize marketing efforts (e.g., Ghorbani et al., Citation2022; Rumpf et al., Citation2020). Although a significant amount of research has been conducted in the last couple of years, studies on the application of AI in sport marketing are still limited, and scholars have emphasized its potential for various businesses (e.g., Davenport et al., Citation2020; Verma & Sharma, Citation2021). In particular, research based on big data sets, real-time evaluations, and the acceptance and usage of AI is required. AI-powered marketing tools should facilitate easy access to information and follow data-driven approaches (Vlačić et al., Citation2021).
This study addresses these gaps by training an AI model based on big data and fostering the real-time evaluation of sponsorships using easily accessible data. In accordance with the two-layer ML framework introduced by Ngai and Wu (Citation2022), which outlines AI applications in marketing by utilizing the 7Ps marketing mix and predominant technologies, the domain of “people” encompasses AI systems focusing on customer prediction (e.g., Jeon et al., Citation2020). Consumers’ responses to dynamic marketing stimuli (sponsorship messages), message personalization, and thus message optimization are comprised within this domain. Furthermore, Ngai and Wu (Citation2022) demonstrate that Random Forest, XGBoost, gradient boost, and support vector machines (SVM) are well-known and frequently used ML technologies for predicting consumer responses, that is, consumers’ visual attention allocation.
Consumers’ visual attention, emotions, and dynamic marketing stimuli
Numerous studies have highlighted the significance of visual attention as an essential measure for understanding consumer responses to dynamic marketing stimuli and sponsorship messages (e.g., Pieters & Wedel, Citation2004; Rumpf et al., Citation2020). As other outcome measures, such as sponsor recall, recognition, or brand awareness (e.g., Dees et al., Citation2019; Walsh et al., Citation2014), are applicable only if the stimulus was visually attended previously, understanding what influences consumers’ visual attention is vital (Lardinoit & Derbaix, Citation2001). Visual attention is commonly described as allocating an individual’s processing capacity to stimuli in their visual field (Bundesen et al., Citation2005). It comprises two primary mechanisms: bottom-up and top-down attention. Bottom-up attention is automatic and rapid and is driven by the saliency of an object, whereas top-down attention is consciously directed by individuals (Itti & Koch, Citation2000; Wolfe & Horowitz, Citation2004).
Research on visual attention allocation in dynamic media remains limited, with most studies focusing on consumer attention to TV ads (e.g., Aoki & Itoh, Citation2000; Teixeira et al., Citation2010). In contrast to sponsorship messages in broadcasts, TV ads represent a direct form of marketing, which should be considered differently regarding consumers’ visual attention allocation. A few studies have already explored visual attention to embedded marketing stimuli, such as sponsor messages in sports broadcasts or virtual billboards in video games (e.g., Breuer & Rumpf, Citation2012, Citation2015; Lee & Faber, Citation2007). Further research concerning sponsorship messages in mediated content, which used different outcome measures (e.g., recall, recognition, brand awareness, etc.), showed that TV commercials were most effective compared to combined promotion, athlete endorsement, and venue signage (Cianfrone & Zhang, Citation2006). Additionally, the results of Dees et al. (Citation2019) indicate that videoboards, LED in-stadium advertising, and on-site activation led to increased brand awareness for sponsors. This was specified by Lee et al. (Citation2022), who stated, based on the LC4MP, that the single-signage rotation technique of sponsor signage within sport broadcasts will support sport fans’ recall.
One conceptual model elaborating on the specificity of sponsor marketing stimuli embedded in sports broadcasts is the aforementioned LC4MP. The model considers consumers biological organisms with finite cognitive resources for allocating visual attention to mediated content (Lang, Citation2000, Citation2006). This suggests that consumers’ attention allocation varies, and cognitive overload might occur when there are insufficient cognitive resources for processing. Additionally, the LC4MP argues that the aversive motivational system is activated in response to arousal and (un)pleasant content, affecting consumers’ attention and memory. This is in line with numerous studies that report a significant interaction between consumers’ emotions and visual attention (Breuer, Rumpf, et al., Citation2021; Wang & Lang, Citation2012; Yegiyan & Lang, Citation2010). Within the LC4MP, emotions are conceptualized as a two-dimensional space consisting of arousal and valence (Lang et al., Citation1993; Russell, Citation1980). Valence ranges from highly positive to highly negative, whereas arousal ranges from calming to exciting. Thus, this framework allows consumers’ emotional states to be negative and exciting, negative and calming, positive and calming, or positive and exciting. Given the emotional intensity of consumers’ experiences through televised sports (e.g., Desarbo & Madrigal, Citation2011; Knobloch-Westerwick et al., Citation2009), it is crucial to consider the role of emotions when examining consumers’ visual attention to dynamic marketing stimuli in sports contexts. In a setting similar to the present study, Breuer, Rumpf, et al. (Citation2021) demonstrated, though with slightly varied measurements, that low-to-moderate arousal and valence-neutral emotional states increase viewer attention to sponsor in-stadium messages.
Game’s run of play, message optimization, and sponsorship effectiveness
In the context of live sports broadcasts, the presence of sponsor messages alongside the primary sporting content poses a unique challenge. Sponsor messages are typically processed by consumers as peripheral signals rather than central ones, as they share the screen with the content that holds the audience’s primary interest (Breuer & Rumpf, Citation2015; Breuer, Rumpf, et al., Citation2021; Lee & Faber, Citation2007). Thus, the effectiveness of sponsors’ messages in broadcasts remains unclear (e.g., Cornwell, Citation2014; Cornwell & Kwon, Citation2020).
Concerning the factors influencing consumers’ visual attention to sponsor messages, the literature primarily examines two groups of determinants: sponsor-related factors, such as color, animation, and congruence (e.g., Otto & Rumpf, Citation2018; Toh et al., Citation2022), and consumer-related factors, such as knowledge, awareness, and involvement (e.g., Boronczyk et al., Citation2018; Lee et al., Citation2019). With the advent of digitalization and new technologies in the sports business, a new stream of research has emerged that analyzes the influence of game-related factors (e.g., Breuer, Boronczyk, et al., Citation2021). Owing to the availability of real-time adjustable LED boards in stadiums, marketing managers can now customize content on a second-by-second basis (e.g., DFL, Citation2020). However, this capability has primarily been utilized for digital overlays and country-specific feeds rather than targeted message optimization.
Five studies were found to examine the influence of game-specific events on consumer responses to sponsor messages. Le Roy and Vivier (Citation2008) revealed that individuals paid greater attention to sponsor messages during non-action periods, such as timeouts and penalties in rugby games. In 2021, Breuer et al. used as one of the first full soccer live broadcasts instead of edited video sequences to demonstrate how a dynamic management approach can contribute to greater sponsor message efficiency. Based on GLMM modeling, the authors highlighted the importance of game suspense in influencing visual attention to sponsor messages. A second study by Breuer, Rumpf, et al. (Citation2021) highlighted that greater outcome uncertainty increases arousal and the magnitude of emotional response. Using multi-level modeling and similar measurements to the present study, the results showed that low-to-moderate arousal and valence-neutral emotional states, in turn, increase viewer attention to sponsor messages. Furthermore, Boronczyk et al. (Citation2022) concentrated on distinct game features in full live broadcasts one year later. Game time, ball possession, score, and ball position were significant factors affecting sponsor message attention. According to this, Herold and Breuer (Citation2023) subsequently conducted the first systematic research investigating the impact of specific soccer game features and run-of-play events on consumers’ visual attention, utilizing live broadcasts and a larger, more comprehensive dataset. Based on the prediction of the LC4MP model and GLMM testing, several game events significantly influenced consumers’ visual responses to sponsor messages.
The present study reuses the data set of Herold and Breuer (Citation2023). However, the dataset of the present research has been expanded by including consumer data on emotions. Based on initial findings indicating a participant-specific, individualized influence, the influence of incorporating consumer emotion data and its practicability should be tested throughout the present study. Furthermore, additional game-related data was added. By reanalyzing the data set in terms of an application-oriented research approach, results should give deeper insights on the un-(importance) of including individual emotions data and solely relying on game data. The analysis approaches between the two studies significantly differ. GLMM, with its primary focus on elucidating the relationship between variables and quantifying said relationship, imparts a structural framework to the data throughout the first study. In contrast, the black-box nature of AI and ML analysis in the present study allows for a more data-based analysis, enhancing pattern recognition without imposing a rigid structure, rendering it conducive to improved prediction and practical applications, particularly in handling large datasets.
Research settings and data handling
Study design and procedures
According to Herold and Breuer (Citation2023), the study uses a quantitative approach. In total, 42 highly involved soccer fans participated in a controlled lab study aligned with previous research (e.g., Breuer, Boronczyk, et al., Citation2021; Breuer, Rumpf, et al., Citation2021). Live soccer broadcasts from the German Bundesliga were used as stimuli. As all German Bundesliga stadiums are equipped with LED boards around the fields and cam carpets behind the goals (DFL, Citation2020), the broadcasts present an adequate subject of investigation as sponsor messages are consistently visible. Additionally, soccer is the most popular sport in which sponsors invest, given its large following among TV audiences (Sports, Citation2018). Following a pre-testing phase, data were collected during the 2019/2020 season. Participants had to be highly involved with the team playing in the home stadium (i.e., be fans of the home team). All participants were German and provided written consent prior to the start of the study, following the university’s ethical guidelines and in line with the principles stated in the Declaration of Helsinki. As the study aimed to pursue a realistic setup that adhered to necessary scientific criteria, two participants simultaneously watched the same soccer broadcast in identical setups (Herold & Breuer, Citation2023). presents the relevant sociodemographic characteristics and summary statistics concerning the participants’ involvement.
Table 1. Socio-demographic characteristics and involvement of participants (Herold & Breuer, Citation2023).
Measures
Consumers’ biometric measures
Three consumer biometric measurements were used. Visual attention can be objectively measured using eye-tracking technology, which continuously tracks the eye movements of consumers in real-time (Isaacowitz et al., Citation2006; Orquin & Holmqvist, Citation2018). Two remote SensoMotoric Instruments (SMI) Red eye-tracking systems (60 Hz; infrared) gathered participants’ gaze data on two identical 43-inch TV screens (SMI & GmbH, Citation2011). To create the target variable, gaze hit (dummy coding: 0=no gaze hit; 1=gaze hit), areas of interest (AOIs) were marked using the analysis software (SMI BeGaze) for each sequence where sponsor messages were visible in the videos. A gaze hit was determined when the participant visually contacted the AOIs for more than 100 ms (fixation). Gaze hits serve as a valid measure of visual attention to sponsor messages in the media (Breuer, Rumpf, et al., Citation2021; Duchowski, Citation2007). Thus, this variable serves as the AI models target (dependent variable).
Compared to the dataset of Herold and Breuer (Citation2023), the data set of the present study was extended by adding data on consumers’ emotions. Participants’ emotional arousal and valence were assessed by their heart rates and by performing facial electromyography (EMG). Heart rate is a widely used autonomic measure of the intensity dimension of consumers’ affective reactions (arousal; e.g., Lee et al., Citation2019; Poels & Dewitte, Citation2006). Two Shimmer3 GSR+ systems (128 Hz) were used to collect participants’ heartbeats-per-minute (BMP) via an electrode placed on their second finger. Higher values indicated higher emotional arousal, whereas lower values indicated lower emotional arousal (Wang & Lang, Citation2012). Unlike self-reported measures of emotions, which may be influenced by cognitive and social desirability biases, autonomic measures reflect the physiological reactions caused by changes in the autonomic nervous system (e.g., Bagozzi, Citation1991; Winkielman et al., Citation2001). To measure emotional valence, consumers’ facial muscular activity of the corrugator supercilii (eyebrow muscle) and the zygomaticus major (cheek muscle) were assessed using a Myon EMG system (1000 Hz). Therefore, higher activity of the corrugator supercilii indicates an unpleasant emotional experience (aversive response), whereas higher activity of the zygomaticus major indicates a pleasant emotional experience (appetitive response; e.g., Bolls et al., Citation2001; Lee, Citation2021). The raw EMG signal was rectified and smoothed using the average rectified value (ARV). The feature variable EMG-delta was calculated thereafter (EMG-delta=zygomaticus major – corrugator supercilii), with values < 0 representing an aversive response and values > 0 indicating an appetitive response. Both variables, heart-rate and EMG-delta, were included as features (independent variables) in the AI models.
Gameplay measures
shows the gameplay measures, divided into common game-event features, game-intense features, and game-replay features. While most data were obtained from the laboratory setup, additional information concerning the position of every trackable object (ball, player, and referee) and the possession of the ball, as well as ball speed, were acquired through a soccer analytics company called SkillCorner (SkillCorner, Citation2022). Compared to the first study of Herold and Breuer (Citation2023), the data set of the present study was extended with the named data of SkillCorner. The first study does not include this data source. Furthermore, the in-play betting odds were accessed via a sports bookmaker’s website (bet365, Citation2023).
Table 2. Overview of the gameplay features.
Because gameplay is highly shaped by different game events occurring in the field over 90 minutes, common game-event features are the first set of features utilized identical to Herold and Breuer (Citation2023). These features were aligned with their frequency of occurrence during games and the commonly used live game statistics of DFL (DFL, Citation2022). Most features within this set are recognized as either not happening at all, as game events of the home team, or as game events of the away team. The second set of features are the game-intense features, which differs from Herold and Breuer (Citation2023). Testing not only one but several different game-intense features throughout the analysis process allows strengthening an AI application, which should be solely based on game features for practical use. In-play betting odds (only game-intense variable already tested in Herold and Breuer (Citation2023)) were used as reliable and objective measures of game outcome uncertainty. They reflect the game’s suspense level during a certain time (e.g., Forrest & Simmons, Citation2002). A square root transformation of the absolute distance between the winning odds of both teams was calculated (odds_differential0.5) based on a curve-fitting procedure to test nonlinear relationships, with smaller distances indicating higher degrees of outcome uncertainty. Furthermore, the features goal_difference, field_zones, ball_speed, and game_time, as additional game-intense variables, served as further indicators of game outcome uncertainty based on previous research (e.g., Boronczyk et al., Citation2022; Herold et al., Citation2021). The third set, called game-replay features, was included because a considerable amount of time during soccer broadcasts is devoted to repeating game events. This set is identical to Herold and Breuer (Citation2023). The replays often include seconds with clearly visible sponsor messages and hold the same potential for consumers’ visual attention allocation to sponsor messages as the primary live broadcast. Therefore, replays are also considered relevant features when forecasting consumers’ gaze hits in a sports broadcast. All gameplay sets were included as features in the AI models.
Data handling
Based on the different measurement frequencies of the data (gaze hits 60 HZ, heart rate 128 Hz, EMG-delta 1000 Hz, gameplay features 1 Hz), the Blickshift Recorder (blickshift, Citation2022) software was used to synchronize and merge the data adequately. The data were aggregated second by second (1 Hz) and reduced to a regular playing time of 90 minutes. Including 42 participants in the study resulted in 226,800 possible observations. However, as the clear visibility of sponsor messages is indispensable when forecasting consumers’ gaze hits, the dataset was reduced to only those seconds in which sponsor messages were clearly visible. This resulted in 100,298 observations. Exploratory data analysis was performed to clean the data set and to account for missing values, leading to 77,322 cases (dplyr; Wickham et al. (Citation2023)). To mitigate the risk of data leakage arising from adjacent seconds with identical values in the data set, all duplicates were removed during data cleaning (e.g., Apicella et al., Citation2024; Manjusha & Suryanarayana, Citation2022; Nisbet et al., Citation2009). For the final model training and testing 69,649 valid cases were used. Due to the new data sources that were added, the number is different from Herold and Breuer (Citation2023).
Model training and results
Training and testing procedure
For the AI model training and testing, a rational AI approach designed to make decisions based on logical reasoning and objective analysis was used (Yu & Yu Angela, Citation2022). Five supervised learning models were trained and tested in RStudio: Gradient Boost (gbm; Greenwell et al. (Citation2022)), XGBoost (xgboost; Chen and He (Citation2023)), SVM (e1071; Meyer et al. (Citation2019)), and Random Forest (twice; randomForest; Liaw and Wiener (Citation2002)). Supervised ML targets a statistical model that can predict outputs based on one or more inputs. In contrast to unsupervised ML, where the data are unlabeled, supervised learning involves using data that already hold a possible output and a set of explanatory variables, as in a previous study (Syam & Sharma, Citation2018). The choice of different ML models (also called learners, or algorithm) was based on their specific requirements and popularity in different research areas. They are well-known learners concerning classification problems (contrast: regression problem), can handle big data sets and produce accurate results in many research fields (e.g., Breiman, Citation2001; Chen & Guestrin, Citation2016; Friedman, Citation2001).
To produce valid and reliable results, the training and testing process consisted of two stages. First, the four alternatives of supervised ML models (Gradient Boost, XG Boost, SVM, Random Forest) were trained and tested, including all features (heart-rate, EMG-delta, set of gameplay features) and the target gaze hit. This initial stage benchmarks the choice of the most appropriate model for the given dataset based on the theoretical prediction of the LC4MP (necessity to include biometric features). In the second stage, the best-performing model is trained and tested. However, this time, the two biometric features, heart-rate and EMG-delta were excluded to ensure the practical applicability of the ML model in the sports industry (as consumers’ biometric data are not available there).
Based on previous literature, the size, and characteristics of the underlying data set, 80% of the final set was used to train the model, whereas the remaining 20% was used to test the models’ performance and avoid overfitting (e.g., Wang et al., Citation2019). Splitting the data set was conducted randomly (Kuhn, Citation2008), as the data set has a sufficient number of valid cases, and random sampling leads to low bias in the model’s performance (Lohr, Citation1999). Owing to the significant discrepancy between the number of gaze hits and seconds without gaze hits (i.e., class imbalance in binary classification), the Synthetic Minority Oversampling Technique (SMOTE; UBL; Branco et al. (Citation2016)) was applied to the data set prior model training (Chawla et al., Citation2002; He & Garcia, Citation2009). This technique attempts to balance the class distribution, lowers biases, and improves the model’s performance on the minority class. provides an overview of the different data sets in terms of quantification.
Table 3. Quantification of the data sets.
In the next step, each model was executed using the default hyperparameters, i.e., predefined settings or values that are used to regulate the learning process of the model. The R package mlr (Bischl et al., Citation2016) was used to perform random search, which optimizes the models and identifies the best hyperparameters (Bergstra & Bengio, Citation2012). Once the optimal hyperparameters were obtained, cross-validation was conducted during the training to mitigate the risk of overfitting additionally (King et al., Citation2021). The parameters F1 score, accuracy, (inverse) recall, and (inverse) precision were selected to evaluate the performance of the models (Powers, Citation2011; Sokolova & Lapalme, Citation2009; Srinivas & Sultana, Citation2015). The parameter recall states the model’s ability to identify true positive instances effectively, which is particularly of interest in scenarios where minimizing false negatives is crucial. Precision refers to the model’s accuracy of positive predictions and is, in turn, of particular interest in scenarios where minimizing false positive predictions is important. The F1 score harmonizes the consideration of both parameters, precision, and recall, especially in data sets with an unequal distribution between the positive and negative class. At last, accuracy serves as a comprehensive measure of the model’s overall correctness, encompassing evaluations of both true positive and true negative predictions. Please consider for more information.
Table 4. Performance metrics of the four supervised machine learning models.
Stage I: training and performance of the LC4MP-based model
reports the performance metrics of the four supervised ML models used in the first stage. Across the models, Random Forest demonstrates overall the best performance, with an F1 score of 0.27 and an accuracy of 96.37%. The model shows a higher precision (32.09%) compared to the recall (23.81%), implying less false positive predictions than false negatives in relation to true positives. Both inverse ratios are comparably high (>97%), implying a high prediction accuracy concerning the true negatives.
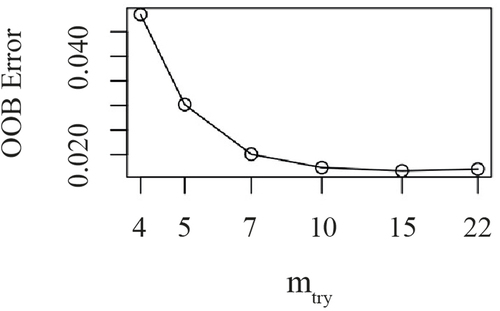
Comparing the model’s overall ability to predict visual attention allocation to sponsor messages, the results show that the model is generally able to distinguish correctly between gaze hit = 0 and gaze hit = 1. However, the results also indicate a noticeable disparity in predictive performance between the two classes. The model outperforms in predicting the negative class (gaze hit = 0) compared to the positive class (gaze hit = 1). The model’s best result was obtained with the hyperparameters ntrees = 500 and mtry = 15. This means that the highest accuracy for the model was achieved when the number of trees in the Random Forest algorithm was set to 500, and the number of features considered for each split in the trees was set to 15. shows the out-of-bag error (OOB) that was used to obtain the optimal number of features sampled for each tree (mtry).
Figure 1. Out-of-bag error vs. mtry of the Random Forest.
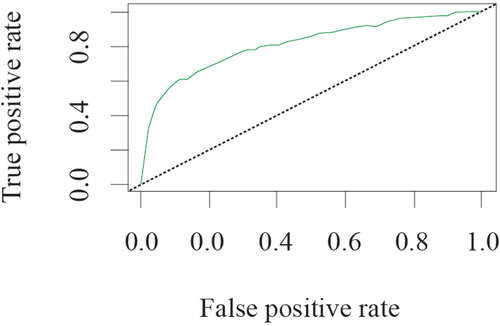
To further elaborate on the model’s performance, depicts the receiver operating characteristics (ROC) curve (ROC curve; e.g., Fawcett, Citation2006). The y-axis shows the true-positive rate (i.e., sensitivity), whereas the x-axis displays the false-positive rate (i.e., specificity). The ROC curve represents the balance between sensitivity and specificity. The larger the area under the ROC curve, the better the model performance. As the area under the curve is clearly more than 0.5, the model can clearly distinguish between when consumers allocate visual attention to the sponsor message (i.e., gaze hit = 1) and when do they not allocate visual attention to the sponsor message (i.e., gaze hit = 0).
Figure 2. Receiver operating characteristics curve of the Random Forest model.
To assess feature importance in the Random Forest model, the Gini index or Mean Decrease in Gini (MDI) was used (Kuhn (Citation2008) (Breiman, Citation2001, Citation2002). illustrates how the error (x-axis) increases when the model is deprived of the corresponding feature on the left-hand side. The most crucial feature affecting the model’s predictions was the feature objects_on_screen (common game-event feature), followed by odds_differential0.5 (game-intense feature). Both of these are gameplay features. The biometric features, heart-rate and EMG-delta, were ranked third and fourth in terms of importance for the model’s decision. Other factors that significantly contribute to forecasting gaze hits include various game-intense features such as goal_difference or game_time and common game-event features such as ball_possession, throw-in, or foul.
Figure 3. Feature importance in the Random Forest model.
Stage II: training and performance of the adapted model
Because the Random Forest model performed best during the initial phase, an additional Random Forest model was trained in the second stage, which excluded consumers’ biometric data (heart-rate, EMG-delta) as features. The optimal hyperparameters of the initial model (ntrees = 500 and mtry = 15) remained unchanged and were reused.
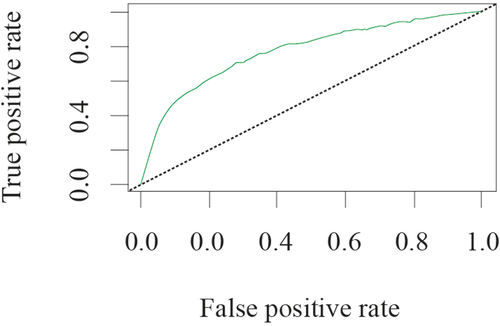
The results of the adapted model still indicated a good overall performance with an F1 score of 0.20 and an accuracy of 94.53%. Compared to the initial model, the recall has slightly improved with 24.06%. However, precision dropped to 17.29%, which indicates a loss of almost half of the initial model’s value. This implies more false positive predictions than false negatives in relation to true positives and underlines the importance of the two biometric measures that were not included. Furthermore, the inverse recall decreases slightly (96.61%), whereas inverse precision stays nearly the same (97.73%). To put it differently, this model maintained a high overall accuracy rate in predicting consumers’ visual attention to sponsor messages but lost a significant amount of its precision due to excluding the biometric input features. The error rates of the two models increase from 3.63% (initial model) to 5.47% (adapted model). As depicted in , the area under the ROC curve remains above 0.5 and only differs marginally, indicating that the adapted model could still correctly distinguish whether the consumers respond to the stimuli or not.
Figure 4. Receiver operating characteristics curve of the adapted Random Forest model.
shows the MDI graph illustrating the feature importance in the adapted Random Forest model. The most important feature for the model’s predictions was the common game-event objects_on_screen. Similar to the first model, the game-intense feature odds_differential0.5 is the second most important. In contrast to the initial model, the two biometric features were replaced by two game-intense features (goal_difference and game_time), now ranked third and fourth. Furthermore, the importance ranking of the features ranked third to twelfth changed. The features possession_change and replay_foul were included in the adapted model.
Figure 5. Feature importance in the adapted Random Forest model.
Discussion
ML and consumer response to dynamic marketing stimuli
This study demonstrates an application-oriented, new approach for optimizing sponsorship messages in live sports broadcasts. By comparing the predictive capabilities of two AI models with and without access to biometric features, this study contributes to the existing body of knowledge on predicting consumer responses to dynamic marketing stimuli in real-time. Based on a re-analyzation of the data set used prior by Herold and Breuer (Citation2023), testing practical applicability of the models allows for direct post-hoc sponsorship message evaluation concerning valuable seconds during each game. Thus, the study extends the literature on sponsorship evaluation and effectiveness and attempts to close the gap between theory and practice. The initial models were trained, including the access to biometric features using eye tracking data and two consumer biometric features, heart-rate and EMG-delta. The second model excluded the two aforementioned biometric features demonstrating more applicability (no access to biometrics) for implementation in real-world non-academic sports industry settings.
Comparing the two models concerning the outlined RQ, the initial model demonstrates a good potential for sports companies overall. The overall accuracy exceeds 96%, and the precision of predicting a second in which a gaze hit occurs (positive class) correctly is over 30%. Seconds in which no gaze hit occurs (negative class) are correctly predicted with over 97%. Among all input features, the number of objects on screen is the most crucial feature for forecasting visual attention allocation, followed by the game’s degree of suspense. However, arousal and valence (biometrics) emerged as the third and fourth most important features. This finding supports the predictions of the LC4MP (i.e., emotions should be considered when forecasting visual attention). It indicates the difficulties for an AI application solely using game-relevant input information to evaluate sponsorships at first glance. However, the features with the most crucial impact are the two named game-relevant information. Eleven other game-related features (from the fifth position onwards) are highly important when forecasting visual attention (e.g., pitch zone, game time, ball speed, and ball possession). This is in line with the second model’s performance at first glance: after excluding the biometric features, the adapted Random Forest model still showed an accuracy of 94%. However, putting it differently, this is an increase in the model’s error rate of 1.84%. Furthermore, the precision of the model decreased to nearly half of the initial model’s precision, which is significant. This implies that an AI application, which deviates from the assumptions of the LC4MP by excluding biometrics, records a significant decline in its efficacy of forecasting consumer response to sponsor messages. Having no access to consumer biometrics generally still enables sport marketing and management practitioners to evaluate their sponsorships in real-time, but at the expense of a certain reliability. In this model, the most important features are objects on screen, followed by a game’s degree of suspense. In exchange for biometric features, this model relies its decision on two additional gameplay features. compares the most crucial features and presents the MDI values for both ML models.
Table 5. Feature importance comparison for the initial and adapted model.
For a comprehensive discussion of the models, shows the confusion matrices. Both models show a low recall (sensitivity) and a high inverse recall (specificity), implying that the models are, for a relatively high percentage, able to correctly identify when no gaze hit is happening (true negative) compared to when a gaze hit is happening (true positive). The moderate sensitivity and precision in both models indicate that the models exhibit slightly elevated rates of false negatives and false positives in relation to the positive class. However, the primary emphasis in this study was placed on assessing whether the model would operate effectively in the absence of consumers’ emotional data, which it indeed does at first glance. As stated previously, nevertheless, with a decrease in two performance parameters, which should not be neglected. Furthermore, attention should be directed toward minimizing the risk of false positives, as this would impart an erroneous evaluation regarding sponsors’ value/ROI. The elevated rates of false negatives and false positives indicate an opportunity for future research (see corresponding chapter).
Table 6. Confusion matrices for the initial and adapted random forest models.
Based on the two application scenarios discussed within this study, the following managerial implications, presented as exemplified instances, arise from the study. Regarding Scenario I (timely adjustment and real-time adaption of sponsorship messages based on increased visibility, i.e., when sponsor messages accumulate higher consumer attention), sponsorship packages could still be offered in tiers, but on a more comprehensive negotiation basis, ensuring, for example, high-visibility time slots for the “platinum” package. If Sponsor A has bought this “platinum” package and thus the right to be presented during times with a high likelihood to attract consumers’ visual attention, this could be guaranteed by adapting the forthcoming 30-second duration of the LED board: taking the feature “ball is in the home team’s goal area” as a high-visibility instance, the LED boards can be adjusted for the forthcoming 30-seconds directly when it turns out that the ball is or stays in this field area for longer than the current 30-second slot (e.g., kick-off, corner kick away team, goal area tussle, etc.). Another example would be to use the feature “objects on screen” as an indicator for displaying platinum sponsor messages, as this is the most influential feature in the models. Hence, the strategic adjustment of sponsorship messages regarding the forthcoming 30-second intervals would be based on whether it is apparent that fewer objects will be on the screen, such as throw-ins or injury situations.
Regarding Scenario II (immediate real-time and/or post-event evaluation of sponsor message visibility and ROI), sponsors could receive a comprehensive, individualized report shortly after or even during each game concerning their visibility. Since sponsorship packages and agreements are established prior to the season, teams could leverage this data during the negotiation process. By utilizing these metrics, clubs could effectively promote the idea that, based on meticulous analysis, sponsors will receive what was originally pledged. This assurance could, for instance, include the provision of compensatory advertising spaces during upcoming games or other team-related events if the visibility fell short of the expectations associated with their platinum sponsorship in past games.
Contribution and ethical issues
This study contributes to the understanding and application of AI in the sports industry, which is in line with the recent literature. These findings demonstrate the potential of optimizing dynamic marketing stimuli through real-time adaption, supporting previous research on the benefits of adopting AI in marketing more often (Davenport et al., Citation2020; Verma & Sharma, Citation2021). This study provides insights into the practical applications of ML and emphasizes the importance of new approaches and technologies in the sports industry. By using real-time game-related information that companies within the industry automatically track, this study demonstrates a feasible and targeted approach to assess the effectiveness of sponsorships, which is questioned extensively (Breuer & Rumpf, Citation2012; Cornwell & Kwon, Citation2020). This aligns with several calls for greater practical relevance and applicability of the research results (e.g., Volkmar et al., Citation2022). The study also addresses the importance of real-time evaluation approaches in predicting (sport) audience responses (Jensen & White, Citation2018; Vlačić et al., Citation2021). Furthermore, ML models provide an opportunity to resolve the challenges of evaluating ROI and return on objectives (ROO) in live sports broadcasts (Jensen & White, Citation2018). Additionally, the current study expands the literature on price negotiations between sponsors and recipients, which Cornwell and Kwon (Citation2020) reported as lacking. The models provide relevant information and groundwork to establish new pricing strategies based on the expected ROI and ROO. Overall, this study contributes to the ongoing discussion on the effectiveness of dynamic marketing stimuli and sponsorship messages to reach the right consumers (Cornwell & Kwon, Citation2020; Verhoef et al., Citation2015).
Recent studies on AI usage have highlighted significant ethical and consumer data privacy concerns (du & Xie, Citation2020; Hermann, Citation2022; Ngai & Wu, Citation2022); these are briefly elaborated here. The biometric measurements used in this study (eye tracking, heart rate, and EMG) do not allow for considering a person’s biological sex or age. All data were anonymized, aggregated, and precluded from drawing conclusions about the individuals. Based on the moral mediation theory of technology, it is important to mention that technology is never value-neutral but rather shapes human experiences and actions and plays an active role in assessing ethics and morality (Verbeek, Citation2011). This can lead to tension regarding ethical principles owing to different stakeholder interests (Floridi et al., Citation2018). While sport marketing and management often aim for profit maximization, the primary interest of the sports consumers is the sporting event itself. Therefore, the principle of autonomy, which can be applied to consumer self-determination in this context, should always be considered (Hermann, Citation2022). Finally, ethical principles can potentially be integrated into AI systems to help resolve these issues (du & Xie, Citation2020; Hermann, Citation2022).
Limitations and future research
The shortcomings of this study provide avenues for future research concerning consumer response in dynamic media. First, the data set was created in a laboratory setting, which might evoke fewer emotions within the consumer compared to a real-world consumption experience. Considering that emotional experiences can affect attention allocation, it is necessary to replicate the findings of this study in a realistic live sports context. Also, consumers’ responses might differ for in-stadium spectators compared to TV viewers, and the data set was reanalyzed. Second, this study focuses on in-stadium sponsorship messages around soccer fields alone. However, the results can be used as groundwork and guidance for effective message optimization and in the next step, message personalization, targeting various sponsor messages and sports settings. Third, future studies can mitigate the potential risk of data leakage by including adjacent seconds by conducting analyses focusing on the duration of individual game features or events or by adopting alternative sample splitting methods. Additionally, more sponsor-related features can be included in the models to mitigate false negatives and false positives. At last, the model targets forecasting visual attention; however, it does not currently consider any further cognitive processing or the impact on brand preferences or product choices. Further research should investigate how gaze hits lead to downstream effects to provide a more comprehensive forecast of sports marketing and management success.
Conclusion
This study aimed to assess the differences between two AI models’ predictive capabilities with and without access to consumers’ biometric data when forecasting the influence of game features on consumers’ responses. For this purpose, the study reanalyzes the data set of Herold and Breuer (Citation2023). By comparing two AI models, novel insights were gained on how much predictive capability is lost by non-available consumer data but accessible game data, enhancing feasible message optimization for companies derived from game features alone. The results show that an AI application, without biometric features concerning consumer emotions, would still enable reliable and targeted real-time sponsorship evaluation in live sport broadcasts, but at the expense of a certain reliability. Furthermore, message optimization through real-time adapted content based on a game’s run-of-play would be feasible with the AI model developed in this study, which in turn underlines the importance of adapting new approaches and technologies in sport marketing and management. Different companies within the soccer industry automatically track the game-related information used in this study for every game. This suggests an uncomplicated, albeit more targeted, and straightforward utilization of game data concerning sponsorship evaluation in the future.
Disclosure statement
No potential conflict of interest was reported by the author(s).
Data availability statement
The data set used in this study is available upon request from the authors.
References
- Aoki, H., & Itoh, K. (2000). Analysis of cognitive attitudes to commercial films on basis of eye tracking data. Proceedings of the XIVth Triennial Congress of the International Ergonomics Association and 44th Annual Meeting of the Human Factors and Ergonomics Association. San Diego, CA, United States (pp. 38–41). Ergonomics for the New Millennnium.
- Apicella, A., Isgrò, F., & Prevete, R. (2024). Don’t push the button! exploring data leakage risks in machine learning and transfer learning. arXiv Preprint arXiv: 2401.13796. https://doi.org/10.48550/arXiv.2401.13796
- Bagozzi, R. P. (1991). The role of psychophysiology in consumer research. In T. S. Robertson & H. H. Kassarjian (Eds.), Handbook of consumer behavior (pp. 124–161). Prentice-Hall.
- Bergstra, J., & Bengio, Y. (2012). Random search for hyper-parameter optimization. Journal of Machine Learning Research, 13(2), 281–305.
- bet365. (2023). Bet with Bet365. Retrieved August 20, 2021, from https://www.bet365.de/?_h=NlL8qwP5aYaLEsOmpW9-Lw%3D%3D#/HO/
- Bischl, B., Lang, M., Kotthoff, L., Schiffner, J., Richter, J., Studerus, E. … Jones, Z. (2016). Mlr: Machine Learning in R. Journal of Machine Learning Research, 17(170), 1–5. https://jmlr.org/papers/v17/15-066.htmlblickshift
- Blickshift. (2022). Blickshift recorder software. https://www.blickshift.com/products-services/blickshiftrecorder/?lang=de
- Bolls, P. D., Lang, A., & Potter, R. F. (2001). The effects of message valence and listener arousal on attention, memory, and facial muscular responses to radio advertisements. Communication Research, 28(5), 627–651. https://doi.org/10.1177/0093650010280050
- Boronczyk, F., Rumpf, C., & Breuer, C. (2018). Determinants of viewer attention in concurrent event sponsorship. International Journal of Sports Marketing and Sponsorship, 19(1), 11–24. https://doi.org/10.1108/IJSMS-09-2016-0063
- Boronczyk, F., Rumpf, C., & Breuer, C. (2022). Game play and the effectiveness of sponsor signage: Visual attention to brand messages in live sport broadcasts. International Journal of Sports Marketing and Sponsorship, 23(5), 950–965. https://doi.org/10.1108/IJSMS-03-2021-0063
- Branco, P., Ribeiro, R. P., & Torgo, L. (2016). UBL: An R package for utility-based learning. arXiv Preprint arXiv: 1604.08079. https://doi.org/10.48550/arXiv.1604.08079
- Breiman, L. (2001). Random forests. Machine Learning, 45(1), 5–32. https://doi.org/10.1023/A:1010933404324
- Breiman, L. (2002). Manual on setting up, using, and understanding random forests (Vol. 3). Statistics Department University of California Berkeley.
- Breuer, C., Boronczyk, F., & Rumpf, C. (2021). Message personalization and real-time adaptation as next innovations in sport sponsorship management? How run-of-play and team affiliation affect viewer response. Journal of Business Research, 133, 309–316. https://doi.org/10.1016/j.jbusres.2021.05.003
- Breuer, C., & Rumpf, C. (2012). The viewer’s reception and processing of sponsorship information in sport telecasts. Journal of Sport Management, 26(6), 521–531. https://doi.org/10.1123/jsm.26.6.521
- Breuer, C., & Rumpf, C. (2015). The impact of color and animation on sports viewers’ attention to televised sponsorship signage. Journal of Sport Management, 29(2), 170–183. https://doi.org/10.1123/JSM.2013-0280
- Breuer, C., Rumpf, C., & Boronczyk, F. (2021). Sponsor message processing in live broadcasts—A pilot study on the role of game outcome uncertainty and emotion. Psychology & Marketing, 38(5), 896–907. https://doi.org/10.1002/mar.21481
- Bruffy, K., Desbordes, M., & Richelieu, A. (2016). Global sport marketing: Contemporary issues and practice. Sport Management Review, 19(1), 83–84. https://doi.org/10.1016/j.smr.2015.01.004
- Bundesen, C., Habekost, T., & Kyllingsbæk, S. (2005). A neural theory of visual attention: Bridging cognition and neurophysiology. Psychological Review, 112(2), 291–328. https://doi.org/10.1037/0033-295X.112.2.291
- Chawla, N. V., Bowyer, K. W., Hall, L. O., & Kegelmeyer, W. P. (2002). SMOTE: Synthetic minority over-sampling technique. Journal of Artificial Intelligence Research, 16 1 , 321–357. https://doi.org/10.1613/jair.953
- Chen, T., & Guestrin, C. (2016). Xgboost: A scalable tree boosting system. Proceedings of the 22nd acm sigkdd international conference on knowledge discovery and data mining (pp. 785–794). https://doi.org/10.1145/2939672.2939785
- Chen, T., & He, T. (2023). xgboost: eXtreme Gradient Boosting. R package version 1.7.5. https://mirror.las.iastate.edu/CRAN/web/packages/xgboost/vignettes/xgboost.pdf
- Cianfrone, B. A., & Zhang, J. J. (2006). Differential effects of television commercials, athlete endorsements, and venue signage during a televised action sports event. Journal of Sport Management, 20(3), 322–344. https://doi.org/10.1123/jsm.20.3.322
- Cornwell, T. B. (2014). Sponsorship in marketing: Effective communication through sports, arts and events. Routledge.
- Cornwell, T. B. (2019). Less ‘sponsorship as advertising’ and more sponsorship-linked marketing as authentic engagement. Journal of Advertising, 48(5), 1–12. https://doi.org/10.1080/00913367.2019.1588809
- Cornwell, T. B., Humphreys, M. S., Quinn, E. A., & McAlister, A. R. (2012). Memory of sponsorship-linked marketing communications: The effect of competitor mentions. Sage Open, 2(4), 215824401246813. https://doi.org/10.1177/2158244012468139
- Cornwell, T. B., & Kwon, Y. (2020). Sponsorship-linked marketing: Research surpluses and shortages. Journal of the Academy of Marketing Science, 48(7), 607–629. https://doi.org/10.1007/s11747-019-00654-w
- Davenport, T., Guha, A., Grewal, D., & Bressgott, T. (2020). How artificial intelligence will change the future of marketing. Journal of the Academy of Marketing Science, 48(1), 24–42. https://doi.org/10.1007/s11747-019-00696-0
- Dees, W., Gay, C., Popp, N., & Jensen, J. A. (2019). Assessing the impact of sponsor asset selection, intangible rights, and activation on sponsorship effectiveness. Sport Marketing Quarterly, 28(2), 91–101. https://doi.org/10.32731/smq.282.062019.03
- Desarbo, W. S., & Madrigal, R. (2011). Examining the behavioral manifestations of fan avidity in sports marketing. Journal of Modelling in Management, 6(1), 79–99. https://doi.org/10.1108/17465661111112511
- DFL. (2020). Durchführungsbestimmungen für den Einsatz von LED-Banden und Virtueller Werbung bei Meisterschaftsspielen der Bundesliga und 2.Bundesliga – Saison 2020/2021 – 2022/2023. https://media.dfl.de/sites/2/2020/05/2020-05-11_LED-Banden_Virtuelle-Werbung_Durchf%C3%BChrungsbestimmungen_und_Techniknormen.pdf
- DFL. (2022). Bundesliga Match Facts for More Insights into the Game. Retrieved February 24, 2022, from https://www.dfl.de/en/topics/match-data/bundesliga-match-facts-for-more-insights-into-the-game/
- du, S., & Xie, C. (2020). Paradoxes of artificial intelligence in consumer markets: Ethical challenges and opportunities. Journal of Business Research, 129(1), 961–974. https://doi.org/10.1016/j.jbusres.2020.08.024
- Duchowski, A. (2007). Eye tracking methodology. Theory and practice (Vol. 2). Springer.
- Fawcett, T. (2006). An introduction to ROC analysis. Pattern Recognition Letters, 27(8), 861–874. https://doi.org/10.1016/j.patrec.2005.10.010
- Floridi, L., Cowls, J., Beltrametti, M., Chatila, R., Chazerand, P., Dignum, V., Luetge, C., Madelin, R., Pagallo, U., Rossi, F., Schafer, B., Valcke, P., & Vayena, E. (2018). AI4People—an ethical framework for a good AI society: Opportunities, risks, principles, and recommendations. Minds and Machines, 28(4), 689–707. https://doi.org/10.1007/s11023-018-9482-5
- Forrest, D., & Simmons, R. (2002). Outcome uncertainty and attendance demand in sport: The case of English soccer. Journal of the Royal Statistical Society, 51(2), 229–241. https://doi.org/10.1111/1467-9884.00314
- Friedman, J. H. (2001). Greedy function approximation: A gradient boosting machine. Annals of Statistics, 29(5), 1189–1232. https://doi.org/10.2307/2699986
- Ghorbani, Z., Kargaran, S., Saberi, A., Haghighinasab, M., Jamali, S. M., & Ale Ebrahim, N. (2022). Trends and patterns in digital marketing research: Bibliometric analysis. Journal of Marketing, 2(2), 158–172. https://doi.org/10.1057/s41270-021-00116-9
- Greenwell, B., Boehmke, B., Cunningham, J., & Developers, G. (2022). gbm: Generalized boosted regression models. R package version 2.1.8.1. https://CRAN.R-project.org/package=gbm
- He, H., & Garcia, E. A. (2009). Learning from imbalanced data. IEEE Transactions on Knowledge and Data Engineering, 21(9), 1263–1284. https://doi.org/10.1109/TKDE.2008.239
- Hermann, E. (2022). Leveraging Artificial Intelligence in marketing for social good-an ethical perspective. Journal of Business Ethics, 179(1), 43–61. https://doi.org/10.1007/s10551-021-04843-y
- Herold, E., Boronczyk, F., & Breuer, C. (2021). Professional clubs as platforms in multi-sided markets in times of COVID-19: The role of spectators and atmosphere in live football. Sustainability, 13(4), 2312. https://doi.org/10.3390/su13042312
- Herold, E., & Breuer, C. (2023). Does the game matter? Analyzing sponsorship effectiveness and message personalization in sport live broadcasts. Journal of Sport Management, Ahead of Print, 37(4), 290–301. https://doi.org/10.1123/jsm.2022-0206
- Isaacowitz, D. M., Wadlinger, H. A., Goren, D., & Wilson, H. R. (2006). Selective preference in visual fixation away from negative images in old age? An eye-tracking study. Psychology and Aging, 21(1), 40–48. https://doi.org/10.1037/0882-7974.21.1.40
- Itti, L., & Koch, C. (2000). A saliency-based search mechanism for overt and covert shifts of visual attention. Vision Research, 40(10–12), 1489–1506. https://doi.org/10.1016/S0042-6989(99)00163-7
- Jensen, J. A., & White, D. W. (2018). Trends in sport sponsorship evaluation and measurement: Insights from the industry. International Journal of Sports Marketing and Sponsorship, 19(1), 2–10. https://doi.org/10.1108/IJSMS-07-2017-0057
- Jeon, Y., Jeon, S. G., & Han, K. S. (2020). Better targeting of consumers: Modeling multifactorial gender and biological sex from Instagram posts. User Modeling and User-Adapted Interaction, 30(5), 833–866. https://doi.org/10.1007/s11257-020-09260-w
- King, R. D., Orhobor, O. I., & Taylor, C. C. (2021). Cross-validation is safe to use. Nature Machine Intelligence, 3(4), 276–276. https://doi.org/10.1038/s42256-021-00332-z
- Knobloch-Westerwick, S., David, P., Eastin, M. S., Tamborini, R., & Greenwood, D. (2009). Sports spectators’ suspense: Affect and uncertainty in sports entertainment. Journal of Communication, 59(4), 750–767. https://doi.org/10.1111/j.1460-2466.2009.01456.x
- Kuhn, M. (2008). Building predictive models in R using the caret package. Journal of Statistical Software, 28(5), 1–26. https://doi.org/10.18637/jss.v028.i05
- Kumar, V., & Reinartz, W. (2016). Creating enduring customer value. Journal of Marketing, 80(6), 36–68. https://doi.org/10.1509/jm.15.0414
- Lamme, V. A. F. (2003). Why visual attention and awareness are different. Trends in Cognitive Sciences, 7(1), 12–18. https://doi.org/10.1016/s1364-6613(02)00013-x
- Lang, A. (2000). The limited capacity model of mediated message processing. Journal of Communication, 50(1), 46–70. https://doi.org/10.1111/j.1460-2466.2000.tb02833.x
- Lang, A. (2006). Motivated cognition (LC4MP): The influence of appetitive and aversive activation on processing of video games. In P. Messaris & L. Humphreys (Eds.), Digital media: Transformations in human communication (pp. 237–256). Peter Lang. https://doi.org/10.1177/0093650214566623
- Lang, P. J., Greenwald, M. K., Bradley, M. M., & Hamm, A. O. (1993). Looking at pictures: Affective, facial, visceral, and behavioral reactions. Psychophysiology, 30(3), 261–273. https://doi.org/10.1111/j.1469-8986.1993.tb03352.x
- Lardinoit, T., & Derbaix, C. (2001). Sponsorship and recall of sponsors. Psychology and Marketing, 18(2), 167–190. https://doi.org/10.1002/1520-6793(200102)18:2<167:AID-MAR1004>3.0.CO;2-I
- Lee, M. (2021). A re-inquiry of the emotion spillover effect using psychophysiological approaches: How game outcome and process influence cognitive processing of TV commercial. European Sport Management Quarterly, 23(4), 1159–1181. https://doi.org/10.1080/16184742.2021.1966069
- Lee, M., & Faber, R. J. (2007). Effects of product placement in on-line games on brand memory: A perspective of the limited-capacity model of attention. Journal of Advertising, 36(4), 75–90. https://doi.org/10.2753/JOA0091-3367360406
- Lee, M., Potter, R. F., & Pedersen, P. M. (2019). The effects of emotions on cognitive effort while processing mediated stadium-embedded advertising: A dynamic motivational systems approach. European Sport Management Quarterly, 19(5), 605–624. https://doi.org/10.1080/16184742.2018.1562483
- Lee, M., Tuchman, D., & Arner, E. (2022). Single vs. Multiple Signage: Applying limited capacity message processing to fan’s recognition and recall of In-stadium advertising. International Journal of Human Movement Science, 16(1), 19–28. https://doi.org/10.23949/ijhms.2022.04.16.1.2
- Le Roy, I., & Vivier, J. (2008). Game, set, match! Brand eye tracking on TV sport programmes. World multi media measurement 2008 (pp. 1–10). Esomar Research Papers.
- Liaw, A., & Wiener, M. (2002). Classification and regression by randomForest. R News, 2(3), 18–22.
- Lohr, S. L. (1999). Sampling: Design and analysis (1st ed.). Duxbury Press.
- Manjusha, L., & Suryanarayana, V. (2022). Detect/remove duplicate images from a dataset for deep learning. Journal of Positive School Psychology, 6(2), 606–609.
- Meyer, D., Dimitriadou, E., Hornik, K., Weingessel, A., Leisch, F., Chang, C. C., & Lin, C. C. (2019). e1071: Misc functions of the department of statistics, probability theory group (formerly: E1071). TU Wien R Package Version, 1(2).
- Ngai, E. W., & Wu, Y. (2022). Machine learning in marketing: A literature review, conceptual framework, and research agenda. Journal of Business Research, 145, 35–48. https://doi.org/10.1016/j.jbusres.2022.02.049
- Nisbet, R., Elder, J., & Miner, G. (2009). Handbook of statistical analysis and data mining applications. Academic Press.
- O’Reilly, N., & Madill, J. (2012). The development of a process for evaluating marketing sponsorships. Canadian Journal of Administrative Sciences, 29(1), 50–66. https://doi.org/10.1002/cjas.194
- Orquin, J. L., & Holmqvist, K. (2018). Threats to the validity of eye-movement research in psychology. Behavior Research Methods, 50(4), 1645–1656. https://doi.org/10.3758/s13428-017-0998-z
- Otto, F., & Rumpf, C. (2018). Animation intensity of sponsorship signage: The impact on sport viewers’ attention and viewer confusion. Sport, Business and Management, 8(2), 177–194. https://doi.org/10.1108/SBM-05-2017-0029
- Pieters, R., & Wedel, M. (2004). Attention capture and transfer in advertising: Brand, pictorial, and text-size effects. Journal of Marketing, 68(2), 36–50. https://doi.org/10.1509/jmkg.68.2.36.27794
- Poels, K., & Dewitte, S. (2006). How to capture the heart? Reviewing 20 years of emotion measurement in advertising. Journal of Advertising Research, 46(1), 18–37. https://doi.org/10.2501/S0021849906060041
- Powers, D. M. W. (2011). Evaluation: From precision, recall and F-measure to ROC, informedness, markedness and correlation. International Journal of Machine Learning Technology, 2(1), 37–63. https://doi.org/10.48550/arXiv.2010.16061
- Rumpf, C., Boronczyk, F., & Breuer, C. (2020). Predicting consumer gaze hits: A simulation model of visual attention to dynamic marketing stimuli. Journal of Business Research, 111, 208–217. https://doi.org/10.1016/j.jbusres.2019.03.034
- Russell, J. A. (1980). A circumplex model of affect. Journal of Personality and Social Psychology, 39(6), 1161–1178. https://doi.org/10.1037/h0077714
- Schönberner, J., Woratschek, H., & Ellert, G. (2021). Hidden agenda in sport sponsorship – the influence of managers’ personal objectives on sport sponsorship decisions. Sport Management Review, 24(2), 204–225. https://doi.org/10.1016/j.smr.2020.07.001
- SkillCorner. (2022). Retrieved August 20, 2022, from https://www.skillcorner.com/
- SMI. In S. I. GmbH (Ed.). (2011). iView XTM system manual version 2.7. smivision.
- Sokolova, M., & Lapalme, G. (2009). A survey on evaluation metrics for data classification evaluations. Journal of Educational and Behavioral Statistics, 34, 490–527. https://doi.org/10.3102/1076998609332751
- Sports, N. (2018). Sponsor-trend 2018 status und trends im sponsoringmarkt in Deutschland, Österreich und der Schweiz, Issue. http://nielsensports.com/wp-content/uploads/2014/12/Nielsen-Sports_Sponsor-Trend-2018_web.pdf
- Srinivas, K. R., & Sultana, R. (2015). A comparative study on performance evaluation metrics for classification problems. International Journal of Computer Applications, 113(18), 8–15. https://doi.org/10.5120/19925-2034
- Syam, N., & Sharma, A. (2018). Waiting for a sales renaissance in the fourth industrial revolution: Machine learning and artificial intelligence in sales research and practice. Industrial Marketing Management, 69, 135–146. https://doi.org/10.1016/j.indmarman.2017.12.019
- Teixeira, T. S., Wedel, M., & Pieters, R. (2010). Moment-to-moment optimal branding in TV commercials: Preventing avoidance by pulsing. Marketing Science, 29(5), 783–804. https://doi.org/10.1287/mksc.1100.0567
- Toh, B., Leng, H. K., & Phua, Y. X. P. (2022). Effect of colours on sponsor recall. Asia Pacific Journal of Marketing & Logistics, 35(4), 797–808. https://doi.org/10.1108/apjml-12-2021-0905
- Varshneya, G., & Dasgupta, S. (2018). Digital Marketing: A review of the past decade and future outlook. Journal of Research in Interactive Marketing, 12(4), 412–428. https://doi.org/10.1108/jrim-12-2018-0166
- Verbeek, P.-P. (2011). Moralizing technology: Understanding and designing the morality of things. University of Chicago Press.
- Verhoef, P. C., Kannan, P. K., & Inman, J. J. (2015). From multi-channel retailing to omni-channel retailing: Introduction to the special issue on multi-channel retailing. Journal of Retailing, 91(2), 174–181. https://doi.org/10.1016/j.jretai.2015.02.005
- Verma, S., & Sharma, R. (2021). Artificial intelligence in marketing: Systematic review and future research directions. International Journal of Information Management Data Insights, 1(2), 100002. https://doi.org/10.1016/j.jjimei.2020.100002
- Vlačić, B., Corbo, L., e Silva, S. C., & Dabić, M. (2021). The evolving role of artificial intelligence in marketing: A review and research agenda. Journal of Business Research, 128(May 2021), 187–203. https://doi.org/10.1016/j.jbusres.2021.01.055
- Volkmar, G., Fischer, P. M., & Reinecke, S. (2022). Artificial intelligence and machine learning: Exploring drivers, barriers, and future developments in marketing management. Journal of Business Research, 149(October 2022), 599–614. https://doi.org/10.1016/j.jbusres.2022.04.007
- Walsh, P., Zimmerman, M. H., Clavio, G., & Williams, A. S. (2014). Comparing brand awareness levels of in-game advertising in sport video games featuring visual and verbal communication cues. Communication & Sport, 2(4), 386–404. https://doi.org/10.1177/2167479513489120
- Wang, C., Wang, T., Huang, Z., Liu, Y., & Chen, J. (2019). A systematic review of software engineering practices in machine learning. Information and Software Technology, 106(12), 101–115. https://doi.org/10.1016/j.infsof.2018.10.006
- Wang, Z., & Lang, A. (2012). Reconceptualizing excitation transfer as motivational activation changes and a test of the television program context effects. Media Psychology, 15(1), 68–92. https://doi.org/10.1080/15213269.2011.649604
- Wann, D. L., & Branscombe, N. R. (1993). Sports fans: Measuring degree of identification with their team. International Journal of Sport Psychology, 24(1), 1–17.
- Wickham, H., François, R., Henry, L., Müller, K., & Vaughan, D. (2023). dplyr: A grammar of data manipulation. R package version 1.1.3. https://CRAN.R-project.org/package=dplyr
- Winkielman, P., Berntson, G. G., & Cacioppo, J. T. (2001). The psychophysiological perspective on the social mind. In A. Tesser & N. Schwarz (Eds.), Blackwell handbook of social psychology: Intraindividual processes (pp. 89–101). CHAP.
- Wolfe, J. M., & Horowitz, T. S. (2004). What attributes guide the deployment of visual attention and how do they do it? Nature Reviews Neuroscience, 5(6), 495–501. https://doi.org/10.1038/nrn1411
- Yegiyan, N. S., & Lang, A. (2010). Processing central and peripheral detail: How content arousal and emotional tone influence encoding. Media Psychology, 13(1), 77–99. https://doi.org/10.1080/15213260903563014
- Yu, F. R., & Yu Angela, W. (2022). A brief history of intelligence: From the big bang to the metaverse. Springer Nature.
- Zaichkowsky, J. L. (1994). The personal involvement inventory: Reduction, revision, and application to advertising. Journal of Advertising, 23(4), 59–70. https://doi.org/10.1080/00913367.1943.10673459